O
pen
A
rchive
T
OULOUSE
A
rchive
O
uverte (
OATAO
)
OATAO is an open access repository that collects the work of Toulouse researchers and makes it freely available over the web where possible.This is an author-deposited version published in : http://oatao.univ-toulouse.fr/
Eprints ID : 14101
To cite this version : Maury, Francis and Mungkalasiri, Jitti and
Bedel, Laurent and Emieux, Fabrice and Dore, Jeanne and Renaud, François N. R. Comparative study of antibacterial efficiency of
M-TiO2 (M = Ag, Cu) thin films grown by CVD. (2014) Key Engineering
Materials, vol. 617. pp. 127-130. ISSN 1662-9795
Any correspondance concerning this service should be sent to the repository administrator: [email protected]
To link to this article : DOI:10.4028/www.scientific.net/KEM.617.127
Comparative study of antibacterial efficiency of M-TiO
2(M = Ag, Cu) thin
films grown by CVD
F. Maury
1, a, J. Mungkalasiri
1, 2, L. Bedel
2, b, F. Emieux
2, J. Doré
3,
F.N.R. Renaud
3, c1CIRIMAT, CNRS/INPT/UPS, 4 allée Emile Monso, 31030 Toulouse cedex 4, France 2L2CE/DTNM, CEA Grenoble, 17 rue des martyrs, 38054 Grenoble, France
3Nosoco.tech®, Faculté Pharmacie, Lab. de Microbiologie, Université Lyon 1, 8 av. Rockefeller, 69373, France.
a[email protected]; b[email protected]; c[email protected]
Keywords: Nanocomposite coatings; Metal nanoparticles; Antibacterial activity; Bactericidal
surfaces; TiO2; DLICVD.
Abstract. M-TiO2 (M = Ag, Cu) nanocomposite layers were grown by pulsed direct liquid injection
chemical vapor deposition (DLICVD) on various substrates to produce bactericidal surfaces with long term activity. Monodisperse Ag nanoparticles (NPs) with an average size of 5-10 nm are embedded in an anatase matrix. A bactericidal behavior determined by the JIS Z 2801 standard test was found for Ag-TiO2 films for Ag ≤ 1 at. % and above. Higher Ag content is not necessary since
efficiency is already at its maximum (relative activity 100%). By contrast, using Cu as antibacterial agent, a larger size distribution of metal particles was found (20 to 400 nm). Cu-TiO2 films exhibit a
bactericidal behavior if their thickness is higher than 100 nm and Cu content ≥ 3.5 at. %. These coatings are still antibacterial after 5 months of aging and their efficiency has decreased by only 35%.
Introduction
The presence of bacteria is an ongoing concern because of their impact on health and the economy. To limit the spread and growth of biofilms, the surfaces must undergo regular and frequent chemical and physical cleanings. Sustainable preventive solutions are sought to reduce these costly curative actions. Different surface treatments have been proposed to immobilize antibacterial agents on a surface or to incorporate it into a functional coating. They are either of organic type (triclosan...), or inorganic or metallic (Au, Ag, Co...). The addition of metal nanoparticles in an oxide matrix is a route that has demonstrated its effectiveness [1-3] but it requires the development of deposition processes industrially viable.
In this context, this work aims to compare the antibacterial efficiency of Ag and Cu in a TiO2
matrix to find the optimal content required to produce bactericidal surfaces, i.e. with a relative efficiency of 100%. The same CVD reactor has been used to prepare the samples. The film thickness was generally lower than 300 nm so as not to change the appearance of substrate.
Experimental
M-TiO2 thin films (M = Ag, Cu) were deposited at 410 °C in a one step DLICVD process
previously described [3]. Titanium tetra-iso-propoxide (TTIP) has been used for the growth of TiO2.
The content of Cu and Ag particles was controlled by the mole fraction of their molecular precursor: silver pivalate (Ag-Piv) and copper bis(2,2,6,6-tetramethyl-3,5-heptationate (Cu(tmhd)2),
respectively. The growth conditions are detailed in [3, 4].
The antibacterial behavior was determined by using the JIS Z 2801 standard with S. aureus [5]. All antibacterial tests were performed in the absence of UV radiation to avoid possible photocatalytic action of TiO2 [6]. The protocol and more discriminating additional tests are
Results and discussion
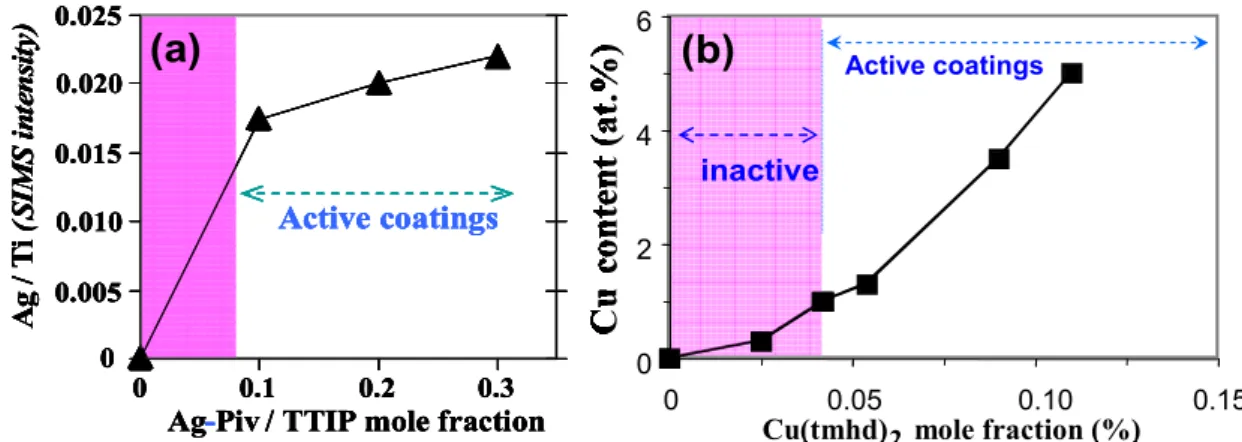
Film composition. The amount of metal M incorporated into the films is deliberately very low,
which makes it difficult to quantify because it is often near or below the detection limit of the techniques used. Moreover films analyzed were of nanometric thickness (< 100 nm) in order not to alter the surface appearance of the support. The content of the element M in M-TiO2 coatings
increases with the mole fraction of the corresponding precursor (Fig. 1). The SIMS profiles show a uniform distribution of the metallic element in the film thickness (Fig. 2). A surface enrichment of Cu is only revealed on a depth of about 60 nm for a 300 nm thick film.
0 0.005 0.010 0.015 0.020 0.025 0 0.1 0.2 0.3 A g / T i (S IM S i n te n si ty )
Ag-Piv / TTIP mole fraction
Active coatings C o p p er c o n te n t ( a t. % ) 0 2 4 6 0 0.05 0.10 0.15 Cu co n te n t ( a t. % )
Cu(tmhd)2mole fraction (%)
Active coatings C o p p er c o n te n t ( a t. % ) 0 2 4 6 0 0.05 0.10 0.15 Cu co n te n t ( a t. % )
Cu(tmhd)2mole fraction (%)
C o p p er c o n te n t ( a t. % ) 0 2 4 6 0 0.05 0.10 0.15 Cu co n te n t ( a t. % )
Cu(tmhd)2mole fraction (%)
Active coatings C o p p er c o n te n t ( a t. % ) 0 2 4 6 0 0.05 0.10 0.15 Cu co n te n t ( a t. % )
Cu(tmhd)2mole fraction (%)
Active coatings C o p p er c o n te n t ( a t. % ) 0 2 4 6 0 0.05 0.10 0.15 Cu co n te n t ( a t. % )
Cu(tmhd)2mole fraction (%)
C o p p er c o n te n t ( a t. % ) 0 2 4 6 0 0.05 0.10 0.15 Cu co n te n t ( a t. % )
Cu(tmhd)2mole fraction (%)
Active coatings inactive
(a)
(b)
0 0.005 0.010 0.015 0.020 0.025 0 0.1 0.2 0.3 A g / T i (S IM S i n te n si ty )Ag-Piv / TTIP mole fraction
Active coatings C o p p er c o n te n t ( a t. % ) 0 2 4 6 0 0.05 0.10 0.15 Cu co n te n t ( a t. % )
Cu(tmhd)2mole fraction (%)
Active coatings C o p p er c o n te n t ( a t. % ) 0 2 4 6 0 0.05 0.10 0.15 Cu co n te n t ( a t. % )
Cu(tmhd)2mole fraction (%)
C o p p er c o n te n t ( a t. % ) 0 2 4 6 0 0.05 0.10 0.15 Cu co n te n t ( a t. % )
Cu(tmhd)2mole fraction (%)
Active coatings C o p p er c o n te n t ( a t. % ) 0 2 4 6 0 0.05 0.10 0.15 Cu co n te n t ( a t. % )
Cu(tmhd)2mole fraction (%)
Active coatings C o p p er c o n te n t ( a t. % ) 0 2 4 6 0 0.05 0.10 0.15 Cu co n te n t ( a t. % )
Cu(tmhd)2mole fraction (%)
C o p p er c o n te n t ( a t. % ) 0 2 4 6 0 0.05 0.10 0.15 Cu co n te n t ( a t. % )
Cu(tmhd)2mole fraction (%)
Active coatings inactive 0 0.005 0.010 0.015 0.020 0.025 0 0.1 0.2 0.3 A g / T i (S IM S i n te n si ty )
Ag-Piv / TTIP mole fraction
Active coatings 0 0.005 0.010 0.015 0.020 0.025 0 0.1 0.2 0.3 A g / T i (S IM S i n te n si ty )
Ag-Piv / TTIP mole fraction
Active coatings C o p p er c o n te n t ( a t. % ) 0 2 4 6 0 0.05 0.10 0.15 Cu co n te n t ( a t. % )
Cu(tmhd)2mole fraction (%)
Active coatings C o p p er c o n te n t ( a t. % ) 0 2 4 6 0 0.05 0.10 0.15 Cu co n te n t ( a t. % )
Cu(tmhd)2mole fraction (%)
C o p p er c o n te n t ( a t. % ) 0 2 4 6 0 0.05 0.10 0.15 Cu co n te n t ( a t. % )
Cu(tmhd)2mole fraction (%)
Active coatings C o p p er c o n te n t ( a t. % ) 0 2 4 6 0 0.05 0.10 0.15 Cu co n te n t ( a t. % )
Cu(tmhd)2mole fraction (%)
Active coatings C o p p er c o n te n t ( a t. % ) 0 2 4 6 0 0.05 0.10 0.15 Cu co n te n t ( a t. % )
Cu(tmhd)2mole fraction (%)
C o p p er c o n te n t ( a t. % ) 0 2 4 6 0 0.05 0.10 0.15 Cu co n te n t ( a t. % )
Cu(tmhd)2mole fraction (%)
Active coatings
inactive
(a)
(b)
Fig.1: Variation of the metal content in M-TiO2 films as a function of the metalorganic precursor
mole fraction in the input gas phase. The Ag content being close to the detection limit it is given as relative content deduced by SIMS (a) while XPS data are reported for Cu (b). Coatings with a composition in the colored area are inactive according to the microbiological JIZ test.
1,00E+02 1,00E+03 1,00E+04 1,00E+05 1,00E+06 1,00E+07 1,00E+08 0 200 400 600 800 1000 Sputtering time (s) S IM S I n te ns ité (u .a .) Ti O Cu Si Temps de pulvérisation (s) 0 200 400 600 800 Sputtering time (s) S IM S i n te n s it y (a .u .) Ti O Cu Si 300 nm 1,00E+02 1,00E+03 1,00E+04 1,00E+05 1,00E+06 1,00E+07 1,00E+08 0 200 400 600 800 1000 Sputtering time (s) 1,00E+02 1,00E+03 1,00E+04 1,00E+05 1,00E+06 1,00E+07 1,00E+08 0 200 400 600 800 1000 Sputtering time (s) S IM S I n te ns ité (u .a .) Ti O Cu Si Temps de pulvérisation (s) 0 200 400 600 800 Sputtering time (s) S IM S i n te n s it y (a .u .) Ti O Cu Si 300 nm 60 nm 1,00E+02 1,00E+03 1,00E+04 1,00E+05 1,00E+06 1,00E+07 1,00E+08 0 200 400 600 800 1000 Sputtering time (s) S IM S I n te ns ité (u .a .) Ti O Cu Si Temps de pulvérisation (s) 0 200 400 600 800 Sputtering time (s) S IM S i n te n s it y (a .u .) Ti O Cu Si 300 nm 1,00E+02 1,00E+03 1,00E+04 1,00E+05 1,00E+06 1,00E+07 1,00E+08 0 200 400 600 800 1000 Sputtering time (s) 1,00E+02 1,00E+03 1,00E+04 1,00E+05 1,00E+06 1,00E+07 1,00E+08 0 200 400 600 800 1000 Sputtering time (s) S IM S I n te ns ité (u .a .) Ti O Cu Si Temps de pulvérisation (s) 0 200 400 600 800 Sputtering time (s) S IM S i n te n s it y (a .u .) Ti O Cu Si 300 nm 60 nm 0 100 200 300 400 500 Sputtering time (s) S IM S i n te n si ty ( a .u .) Ti Ag Si O 0 100 200 300 400 500 Sputtering time (s) S IM S i n te n si ty ( a .u .) Ti Ag Si O
60 nm
0 100 200 300 400 500 Sputtering time (s) S IM S i n te n si ty ( a .u .) Ti Ag Si O 0 100 200 300 400 500 Sputtering time (s) S IM S i n te n si ty ( a .u .) Ti Ag Si O60 nm
(a)
(b)
1,00E+02 1,00E+03 1,00E+04 1,00E+05 1,00E+06 1,00E+07 1,00E+08 0 200 400 600 800 1000 Sputtering time (s) S IM S I n te ns ité (u .a .) Ti O Cu Si Temps de pulvérisation (s) 0 200 400 600 800 Sputtering time (s) S IM S i n te n s it y (a .u .) Ti O Cu Si 300 nm 1,00E+02 1,00E+03 1,00E+04 1,00E+05 1,00E+06 1,00E+07 1,00E+08 0 200 400 600 800 1000 Sputtering time (s) 1,00E+02 1,00E+03 1,00E+04 1,00E+05 1,00E+06 1,00E+07 1,00E+08 0 200 400 600 800 1000 Sputtering time (s) S IM S I n te ns ité (u .a .) Ti O Cu Si Temps de pulvérisation (s) 0 200 400 600 800 Sputtering time (s) S IM S i n te n s it y (a .u .) Ti O Cu Si 300 nm 60 nm 1,00E+02 1,00E+03 1,00E+04 1,00E+05 1,00E+06 1,00E+07 1,00E+08 0 200 400 600 800 1000 Sputtering time (s) S IM S I n te ns ité (u .a .) Ti O Cu Si Temps de pulvérisation (s) 0 200 400 600 800 Sputtering time (s) S IM S i n te n s it y (a .u .) Ti O Cu Si 300 nm 1,00E+02 1,00E+03 1,00E+04 1,00E+05 1,00E+06 1,00E+07 1,00E+08 0 200 400 600 800 1000 Sputtering time (s) 1,00E+02 1,00E+03 1,00E+04 1,00E+05 1,00E+06 1,00E+07 1,00E+08 0 200 400 600 800 1000 Sputtering time (s) S IM S I n te ns ité (u .a .) Ti O Cu Si Temps de pulvérisation (s) 0 200 400 600 800 Sputtering time (s) S IM S i n te n s it y (a .u .) Ti O Cu Si 300 nm 60 nm 0 100 200 300 400 500 Sputtering time (s) S IM S i n te n si ty ( a .u .) Ti Ag Si O 0 100 200 300 400 500 Sputtering time (s) S IM S i n te n si ty ( a .u .) Ti Ag Si O60 nm
0 100 200 300 400 500 Sputtering time (s) S IM S i n te n si ty ( a .u .) Ti Ag Si O 0 100 200 300 400 500 Sputtering time (s) S IM S i n te n si ty ( a .u .) Ti Ag Si O60 nm
(a)
(b)
Fig. 2: SIMS depth profiles of Ag-TiO2 (a) and Cu-TiO2 (b) coatings showing uniform distribution
in depth of the metal NPs acting as antibacterial agent (film thickness 60 and 300 nm, respectively). The Cu profile shows a Cu-rich surface over a thickness of 60 nm by contrast with Ag.
Microstructure of the films. The structure of the TiO2 matrix depends on the incorporated
metal. At 410 °C, Ag-TiO2 films only exhibit the anatase structure whatever the Ag content while
for Cu-TiO2 an anatase-rutile mixture is formed with a rutile proportion increasing with the Cu
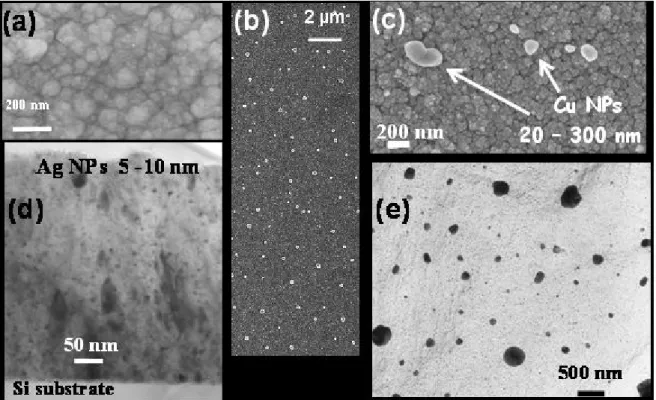
content. For the highest metal content, XRD patterns show the fcc metal structure of both Ag and Cu. Ag particles are not observed on SEM images while spherical Cu particles are clearly dispersed on the surface (Fig. 3). TEM analysis confirms that metal Ag NPs with a monodisperse size in the range 5-10 nm are uniformly distributed in the films thickness (Fig. 3d). The Cu particles have a greater size distribution between 20 and 400 nm, most of which (~ 76%) being between 20-100 nm (Fig. 3e). The largest Cu particles emerge from the surface of the thin film (Fig. 3b,c) which explains the observed enrichment of Cu on the SIMS profiles (Fig. 2b).
Fig. 3: Surface morphology of Ag-TiO2 (a) and Cu-TiO2 (b, c) films shown by SEM micrographs.
TEM cross section micrograph of Ag-TiO2 (d) and planar view of Cu-TiO2 coatings (e) show the
metal NPs distribution in the TiO2 matrix.
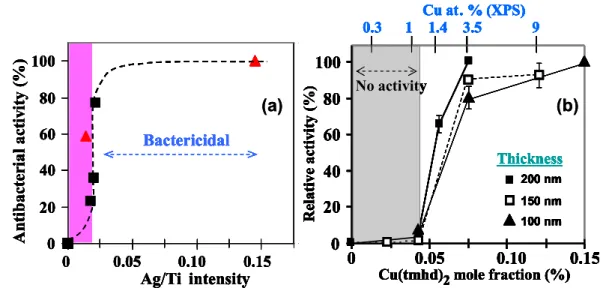
Antibacterial activity of M-TiO2 coatings. Ag-TiO2 nanocomposite films exhibit significant
antibacterial activity for Ag ≤ 1 at. %, i.e. near the detection limit of EDS and XPS (Fig. 4a). It is not necessary to concentrate more Ag since the films are already bactericidal beyond this threshold as the inactive-bactericidal transition is particularly steep. No thickness effect is found and consequently films are bactericidal (rel. activity = 100 %) for thickness as low as 20 nm.
For Cu-TiO2 coatings, a thickness of 100 nm is necessary for a bactericidal behavior. For lower
thicknesses the surface is only antibacterial (rel. activity < 100 %). This originates from the Cu surface enrichment of coatings due to the large size dispersion of Cu particles.
The activity of Cu-TiO2 films increases with the Cu content and become bactericidal for Cu ≥ 3.5
at. % (Fig. 4b). The inactive-bactericidal transition is gradual which reveals a composition range where the coatings are only antibacterial.
In order to better characterize the microbiological behavior of the coatings more discriminating methods derived from the literature were tested to assess the performances of these CVD coatings as reported in [7]. The results confirm that the antibacterial activity of Cu-TiO2 composite coatings
increases with the Cu content.
As-deposited Cu-TiO2 samples exhibiting 100% of relative activity according to the JIZ standard
test were exposed in a climatic chamber in dark under two conditions: 20 °C/RH 40 % and 60 °C/RH 100 %. A decrease of the efficiency was observed with aging (more important for the most severe condition). Typically the performances of coatings decreased by only 35 % after 5 months aging in conditions close to room temperature. This can be due to oxidation of Cu particles emerging from the surface.
Conclusions
The greater efficiency of Ag is demonstrated by the fact that Ag-TiO2 nanocomposite coatings
become bactericidal, i.e. a reduction of approximately 7 log CFU (colony forming units) for Ag content close to only 1 at. % while a comparable efficiency requires about 3.5 at. %. of Cu. In addition, the inactive-bactericidal transition is very steep for Ag and gradual for Cu revealing a
composition range where the Cu-TiO2 films are antibacterial (0 < rel. activity < 100%) and therefore
not complete bactericidal. Compared to Ag an advantage of Cu is its lowest cost. However a drawback is that a minimum thickness of 100 nm is required for bactericidal Cu-TiO2 coatings. As a
result of the combined effect of the higher Cu content and this minimum thickness the surface appearance of some substrates may be altered.
Aging tends to decrease the antibacterial activity of Cu-TiO2, but they are still active after 5
months with a performance loss of only 35%. Surfaces with a high antibacterial activity over such a long period are attractive for many applications, particularly in hospitals.
A n ti b a cte ri a l a cti v ity ( % ) 0 20 40 60 80 100 0 0.05 0.10 0.15 Bactericidal Ag/Ti intensity A n ti b a cte ri a l a cti v ity ( % ) 0 20 40 60 80 100 0 0.05 0.10 0.15 Bactericidal Ag/Ti intensity 0 20 40 60 80 100 0 0.05 0.10 0.15
Cu(tmhd)2mole fraction (%)
R el a ti v e a ct iv it y (% ) 0.3 1 1.4 3.5 9 Cu at. % (XPS) 200 nm 100 nm 150 nm Thickness No activity 0 20 40 60 80 100 0 0.05 0.10 0.15
Cu(tmhd)2mole fraction (%)
R el a ti v e a ct iv it y (% ) 0.3 1 1.4 3.5 9 Cu at. % (XPS) 200 nm 100 nm 150 nm Thickness No activity 0 20 40 60 80 100 0 0.05 0.10 0.15
Cu(tmhd)2mole fraction (%)
Cu(tmhd)2mole fraction (%)
R el a ti v e a ct iv it y (% ) 0.3 1 1.4 3.5 9 Cu at. % (XPS) Cu at. % (XPS) 200 nm 100 nm 150 nm 200 nm 100 nm 150 nm Thickness No activity (a) (b) A n ti b a cte ri a l a cti v ity ( % ) 0 20 40 60 80 100 0 0.05 0.10 0.15 Bactericidal Ag/Ti intensity A n ti b a cte ri a l a cti v ity ( % ) 0 20 40 60 80 100 0 0.05 0.10 0.15 Bactericidal Ag/Ti intensity 0 20 40 60 80 100 0 0.05 0.10 0.15
Cu(tmhd)2mole fraction (%)
R el a ti v e a ct iv it y (% ) 0.3 1 1.4 3.5 9 Cu at. % (XPS) 200 nm 100 nm 150 nm Thickness No activity 0 20 40 60 80 100 0 0.05 0.10 0.15
Cu(tmhd)2mole fraction (%)
R el a ti v e a ct iv it y (% ) 0.3 1 1.4 3.5 9 Cu at. % (XPS) 200 nm 100 nm 150 nm Thickness No activity 0 20 40 60 80 100 0 0.05 0.10 0.15
Cu(tmhd)2mole fraction (%)
Cu(tmhd)2mole fraction (%)
R el a ti v e a ct iv it y (% ) 0.3 1 1.4 3.5 9 Cu at. % (XPS) Cu at. % (XPS) 200 nm 100 nm 150 nm 200 nm 100 nm 150 nm Thickness No activity A n ti b a cte ri a l a cti v ity ( % ) 0 20 40 60 80 100 0 0.05 0.10 0.15 Bactericidal Ag/Ti intensity A n ti b a cte ri a l a cti v ity ( % ) 0 20 40 60 80 100 0 0.05 0.10 0.15 Bactericidal Ag/Ti intensity 0 20 40 60 80 100 0 0.05 0.10 0.15
Cu(tmhd)2mole fraction (%)
R el a ti v e a ct iv it y (% ) 0.3 1 1.4 3.5 9 Cu at. % (XPS) 200 nm 100 nm 150 nm Thickness No activity 0 20 40 60 80 100 0 0.05 0.10 0.15
Cu(tmhd)2mole fraction (%)
R el a ti v e a ct iv it y (% ) 0.3 1 1.4 3.5 9 Cu at. % (XPS) 200 nm 100 nm 150 nm Thickness No activity 0 20 40 60 80 100 0 0.05 0.10 0.15
Cu(tmhd)2mole fraction (%)
Cu(tmhd)2mole fraction (%)
R el a ti v e a ct iv it y (% ) 0.3 1 1.4 3.5 9 Cu at. % (XPS) Cu at. % (XPS) 200 nm 100 nm 150 nm 200 nm 100 nm 150 nm Thickness No activity (a) (b)
Fig. 4: Influence of Ag (a) and Cu (b) content of M-TiO2 nanocomposite coatings on the
antibacterial behavior against S. aureus. The colored zone corresponds to inactive surfaces according to the JIZ test. Squares and triangles in (a) are SIMS and EDS data measured on 20 and 400 nm thick films, respectively. The surface is bactericidal for Ag ≤ 1 at. % and above (with a sharp transition) and for Cu ≥ 3.5 at % (Fig. b is reproduced with permission [7]).
References
[1] L.A. Brook, P. Evans, H.A. Foster, M.E. Pemble, A. Steele, D.W. Sheel, H.M. Yates, J. Photochem. Photobiol. A Chem. 187 (2007) 53-63.
[2] K. Page, R.G. Palgrave, I.P. Parkin, M. Wilson, S.L.P. Savin, A.V. Chadwick, J. Mater. Chem., 17 (2007) 95–104.
[3] J. Mungkalasiri; L. Bedel, F. Emieux; J. Doré; F. Renaud; F. Maury, Surf. Coat. Technol., 204 (2009) 887–892.
[4] J. Mungkalasiri, L. Bedel, F. Emieux, J. Doré, F. N. R. Renaud, C. Sarantopoulos, F. Maury, Chem. Vap. Deposition, 16 (2010) 35-41.
[5] JIS Z 2801 (2000), “Antimicrobial products. Test for antimicrobial activity and efficacy”, 2000.
[6] T. Ochiai, A. Fujishima, J. Photochem. Photobio. C: Photochem. Reviews, 13 (2012) 247-262. [7] J. Mungkalasiri, L. Bedel, F. Emieux, A. Vettese-Di Cara, J. Freney, F. Maury, F.N.R. Renaud,