HAL Id: hal-02285602
https://hal.archives-ouvertes.fr/hal-02285602
Submitted on 12 Sep 2019
HAL is a multi-disciplinary open access archive for the deposit and dissemination of sci-entific research documents, whether they are pub-lished or not. The documents may come from teaching and research institutions in France or abroad, or from public or private research centers.
L’archive ouverte pluridisciplinaire HAL, est destinée au dépôt et à la diffusion de documents scientifiques de niveau recherche, publiés ou non, émanant des établissements d’enseignement et de recherche français ou étrangers, des laboratoires publics ou privés.
Current and future availability of non-genetically
modified soybean seeds in the U.S., Brazil and Argentina
Julien Milanesi, Marion Desquilbet, E. Luch, R. Rocha de Santos
To cite this version:
Julien Milanesi, Marion Desquilbet, E. Luch, R. Rocha de Santos. Current and future availability of non-genetically modified soybean seeds in the U.S., Brazil and Argentina. [Technical Report] Deliverable D3.11, Task T3.7, CO-EXTRA ”GM and non-GM supply chains: their CO-EXistence and TRAceability”, Project 007158, Integrated project, Sixth Framework Programme, Priority 5 (Food Quality and Safety, Inconnu. 2009. �hal-02285602�
CO-EXTRA
GM and non-GM supply chains: their CO-EXistence and TRAceability
Project number: 007158
Integrated project
Sixth Framework Programme
Priority 5
Food Quality and Safety
Deliverable D3.11
Due date of deliverable: M 54
Actual submission date: M 54
Start date of the project: April 1
st, 2005
Duration: 48 months
Organisation name of lead contractor: INRA
Revision: V
Project co-funded by the European Commission within the Sixth Framework Programme (2002-2006)
Dissemination Level PU Public
PP Restricted to other programme participants (including the Commission Services)
PP RE Restricted to a group specified by the consortium (including the Commission Services)
CO Confidential, only for members of the consortium (including the Commission Services)
Current and future availability
of non-genetically modified soybean seeds
in the U.S., Brazil and Argentina
Task T3.7
October 2009
Authors:
- Julien Milanesi, INRA, Toulouse School of Economics (France) - Marion Desquilbet, INRA, Toulouse School of Economics (France) - Evelin Lucht, UNIBRASIL (Brazil)
Acknowledgements
We are very grateful to all the people (researchers, plant breeders, farmers, firms or non-profit organizations’ employees, civil servants or journalists) from Argentina, Brazil, France, the U.S. and Switzerland who provided us with useful information and data.
Contents
Introduction ... 6
1 Global overview of the markets of soybeans and soybean seeds and short term issues .... 7
1.1 Soybean world market... 7
1.1.1 World soybean production ... 7
1.1.2 World soybean consumption ... 9
1.1.3 Soybean prices... 10
1.1.4 Non-GM soybean market ... 10
1.2 Production of non-GM soybeans in the U.S. and shortage of non-GM soybean seeds 13 1.2.1 An increase in non-GM production... 14
1.2.2 Good global profitability of non-GM soybeans ... 15
1.2.2.1 Premium for non-GM soybeans ... 17
1.2.2.2 Increase in the production costs of GM soybeans... 17
1.2.3 Reduction in distribution channels and problems of production planning... 19
1.2.4 Difficulties for U.S. farmers to find non-GM soybean seeds... 20
1.3 Brazil: the world’s leading producer of non-GM soybeans ... 21
1.4 Argentina: Small-scale production of non-GM soybean... 25
2 Soybean plant breeding and availability of non-GM soybean seeds ... 27
2.1 Intellectual Property Rights for plant breeders in Argentina, Brazil and the U.S.... 27
2.2 Non-GM breeding and seeds in the U.S... 29
2.2.1 Market concentration... 30
2.2.1.1 Mergers and acquisitions (M&A) in the soybean seed industry ... 30
2.2.1.2 Concentration of soybean seed sellers ... 33
2.2.1.3 Analysis of patents and PVP certificates on soybeans ... 35
2.2.2 Non-GM seed breeders and availability of non-GM seeds ... 43
2.2.2.1 State universities ... 44
2.2.2.1.1 Why breed non-GM soybeans? ... 44
2.2.2.1.2 Characteristics and performances of non-GM varieties released... 45
2.2.2.2 Private companies ... 46
2.2.2.2.1 Pioneer... 46
2.2.2.2.2 Stine... 47
2.2.2.2.3 Syngenta Canada ... 48
2.2.2.2.4 Dairyland Seed (Dow)... 49
2.2.2.2.5 Hornbeck – SoyTech ... 49
2.2.2.2.6 NuTech Seed ... 50
2.2.2.2.7 Galena Genetics, LLC ... 50
2.2.2.2.8 eMerge Genetics (Schillinger) ... 51
2.2.2.3 Characteristics of non-GM varieties ... 52
2.3 Brazil ... 53
2.3.1 Legal framework for plant breeding... 53
2.3.1.1 Cultivar Law... 54
2.3.1.2 The Seed Law... 56
2.3.1.3 GMO seeds ... 56
2.3.1.4 Access to genetic patrimony ... 57
2.3.2 Market structure ... 57
2.4 Extinction of non-GM soybean seed releases in Argentina ... 64
2.4.1 Argentinean soybean seed breeding industry... 64
3 The Future of non-GM plant breeding ... 69
3.1 Forward Breeding vs. Backcross... 69
3.2 U.S.A.: Dependency on industry leaders ... 71
3.2.1 Future of public research on soybean breeding... 71
3.2.1.1 Decrease in public financial resources ... 71
3.2.1.2 Decrease in access to germplasm resources ... 72
3.2.1.3 Future global competitiveness of public breeding ... 72
3.2.1.4 Focus on germplasm improvement ... 73
3.2.2 Difficulty for small breeders to be competitive ... 74
3.2.3 Which strategy for industry leaders?... 74
3.3 The central position of EMBRAPA in Brazil ... 76
3.4 Argentina: No high-performing non-GM seeds in a large scale for years to come . 76 4 Conclusion: ... 78
5 References ... 80
6 Tables of figures... 87
Introduction
In the U.S., Brazil and Argentina, the leader countries in soybean production, the high adoption rates of GMOs has raised the question of whether non-GM varieties will go on being developed for farmer uses, i.e. whether new competitive non-GM varieties will be bred and released. This issue has become more prominent in 2009 with anecdotal information revealing that some U.S. farmers had difficulties to access non-GM soybean seeds.
In this context, the aim of this report is to provide some information on the current situation on the soybean seed market and on soybean plant breeding for the three leading producers of soybeans, and to discuss to what extent the apparent seed shortage of 2009 in the U.S. is just a short-term issue or whether it reveals a more general trend of strong decline of competitive non-GM seed breeding and supply.
These investigations on non-GM soybean seeds availability in America are of interest to the European Union because they provide new facts and perspectives on the issue of the future non-GM soybean supply in these countries. Europe depends on soybean imports and the question of the future availability of non-GM materials for feed uses, linked for instance to labelling policies, is an important source of debate.1 Issues like identity preservation in the supply chain have already been tackled in different works but the question of the availability of non-GM seeds for farmers in exporting countries has not been investigated yet.
This focus on research and development of new soybean varieties in countries with different adoption rates of GM soybeans and different economic and legal contexts also gives new information on whether, and how, the development of a GM culture, of any species, in a country might exclude the development of the alternative non-GM culture of the same crop.2
Methodologically, this report relies on data from variety registers or from databases on intellectual protection rights, like certificates or patents on varieties, in the three countries; on phone or e-mail interviews with actors of the sectors considered (researchers, plant breeders, farmers, firms or non-profit organizations’ employees, civil servants or journalists) in the three countries; on an Internet search on companies’ public documents (like variety catalogues); and on scientific and gray literature.
The first section of the report gives an overview of the world soybean GM and non-GM market. It describes the current non-non-GM soybean production and the current demand for non-GM soybean seeds in the three countries.
The second section presents the different types of intellectual property rights for plant breeders, the market structure in the soybean seed industry, the non-GM soybean breeding activity and the availability of non-GM seeds for farmers in each country.
The third section discusses prospects on the future of non-GM soybean breeding activity.
1
See for instance the report published by DEFRA and the Food Standards Agency in August 2009: GM Crops and Foods: Follow-up to the Food Matters report by Defra and the FSA
http://www.defra.gov.uk/environment/quality/gm/crops/index.htm
2 A process called “path-dependency”. See for instance Vanloqueren G., Baret P. V. (2009) ; Liebowitz S.J., Margolis S.E. (1995); Arthur B. (1989).
1 Global overview of the markets of soybeans and
soybean seeds and short term issues
This first section is dedicated to an overview of the world soybean market and to a presentation of the market of non-GM soybean seeds in the U.S, Brazil and Argentina.
It includes a special focus on the shortage of non-GM soybean seeds that occurred in the U.S. in 2009.
1.1 Soybean world market
This subsection gives a rapid overview of world supply and demand of soybeans.
1.1.1 World soybean production3
World production of soybeans has significantly increased over the last 25 years (Graph 1).
Graph 1: World soybean production (Source: www.cmegroup.com)
• Production concentrated in three countries: the United States, Brazil and Argentina
The United States, Brazil and Argentina, the three countries studied in this document, are the world soybean production leaders. In 2008, they accounted for 82% of the world production of soybeans (see below).
Graph 2: World soybean production in 2008 (Source: USDA, www.soystats.com)
3 An analysis of these different figures is available for instance in “USDA Agricultural Projections to 2018, February 2009” (http://www.ers.usda.gov). Million of Tons % United States 72.9 33.00% Brazil 61 27.61% Argentina 46.2 20.91% China 14 6.34% India 9.3 4.21% Paraguay 6.8 3.08% Canada 2.7 1.22% Other 8 3.62% Total 220.9 100%
While production has been quite stable in the U.S. in the last decade, it has risen significantly in Argentina and Brazil (Graph 3).
0 10 20 30 1997 1998 1999 2000 2001 2002 2003 2004 2005 2006 2007 2008 M il li o n s o f H e c ta re s
United States Argentina Brazil
0 10 20 30 40 50 60 70 1997 1998 1999 2000 2001 2002 2003 2004 2005 2006 2007 2008 M il li o n s o f H e c ta re s
United States Argentina Brazil
Graph 3: Planted areas of soybean in Argentina, Brazil and United States (Source: USDA/FAS, ArgenBio,
ISAAA, CONAB, www.soystats.com)
• Adoption of transgenic soybeans in Argentina, Brazil and the United States From 11.2% in 1997, the average adoption rate of transgenic soybeans in these three countries reached more than 85% in 2008, with significant differences between the three countries. Almost all of Argentinean soybeans are transgenic, while 45% of soybean areas are still planted with conventional varieties in Brazil. The United States are in an intermediate position with 8 to 9% of the surface planted with conventional soybeans (Graph 4).
0% 10% 20% 30% 40% 50% 60% 70% 80% 90% 100% 1997 1998 1999 2000 2001 2002 2003 2004 2005 2006 2007 2008 % o f a re a p la n te d ( to ta l o f U S A + B ra z il + A rg e n ti n a ) GM Conventional 0% 25% 50% 75% 100% 1997 1998 1999 2000 2001 2002 2003 2004 2005 2006 2007 2008 A d o p ti o n r a te o f G M s o y b e a n
United States Argentina Brazil
Graph 4: Evolution of the GM soybean adoption in Argentina, Brazil and the United States (Source:
USDA/FAS, ISAAA, ArgenBio, CONAB, www.soystats.com)
After a decade of constant decrease, the area planted with conventional soybeans increased slightly between 2007 and 2008 in Brazil and in the United States (Graph 5). This move has been reinforced in 2009 in the United States with an increase of more than 400,000 hectares of conventional soybean plantings, that is to say, 1.3% of U.S. soybean areas. This trend is analyzed below (subsection 1.2.1).
0 10 20 30 40 50 60 70 80 1997 1998 1999 2000 2001 2002 2003 2004 2005 2006 2007 2008 M il li o n s o f H e c ta re s
GM production (Argentina, Brazil, United States) Brazil non-GM
Argentina non-GM United States non-GM
0 10 20 30 40 50 60 70 80 1997 1998 1999 2000 2001 2002 2003 2004 2005 2006 2007 2008 M il li o n s o f H e c ta re s
Non-GM production (Argentina, Brazil, United States) Brazil GM
Argentina GM United States GM
Graph 5: GM and non-GM soybean areas planted in Argentina, Brazil and the United States (Source:
USDA/FAS and ISAAA, ArgenBio, CONAB, www.soystats.com)
1.1.2 World soybean consumption
Soybeans are mainly used for oil and meal production. Industrial uses are also increasing, such as biodiesel in the U.S.
Soybean oil represents 30% of world oil consumption and soybean meal 68% of world protein consumption (Graph 6).
Graph 6: World vegetable oil (left) and protein (right) consumption in 2008 (Source: USDA; from
http://www.soystats.com/2009/Default-frames.htm)
The increase in soybean production is mainly driven by an increasing demand in developing countries. Higher incomes and population growth generate higher demand for vegetable oil for human food and for protein for livestock production.
Since the beginning of the century, Chinese imports have been rising strongly, and this trend is expected to go on in the following years (Graph 7).
Graph 7: Global soybean imports, in million tons (Source: USDA Agricultural Projections to 2018, February 2009, USDA, Economic Research Service)
1.1.3 Soybean prices
Soybean prices increased considerably during the “world food price crisis” of 2007-2008, and were still, after a major decrease in 2007-2008, at a high level in July 2009 (398 US$ per ton at Chicago Board, see Graph 8).
A u g 1 9 9 9 J a n 2 0 0 0 J u n 2 0 0 0 N o v 2 0 0 0 A p r 2 0 0 1 S e p 2 0 0 1 F e b 2 0 0 2 J u l 2 0 0 2 D e c 2 0 0 2 M a y 2 0 0 3 O c t 2 0 0 3 M a r 2 0 0 4 A u g 2 0 0 4 J a n 2 0 0 5 J u n 2 0 0 5 N o v 2 0 0 5 A p r 2 0 0 6 S e p 2 0 0 6 F e b 2 0 0 7 J u l 2 0 0 7 D e c 2 0 0 7 M a y 2 0 0 8 O c t 2 0 0 8 M a r 2 0 0 9 0 100 200 300 400 500 600 U S $ /t o n
Graph 8 Monthly price of soybeans (Source: Chicago soybean futures contract, US$/ton
).
1.1.4 Non-GM soybean market
Due to the reluctance of consumers, mainly in Europe and Japan, to eat GM products or products from animals fed with GM materials, a non-GM soybean market with identity preservation (IP) has been developing since the beginning of the decade.
• Different types of non-GM soybeans
The non-GM soybean market is composed of different product types, with various characteristics, offering premiums to producers. It is mainly divided between soybeans for general use and soybeans with special traits:4
- The most common non-GM soybeans are soybeans for general use, sold as a commodity with possibly a premium for non-GM Identity Preservation. These soybeans are mainly used for producing oil for human or industrial use (biodiesel) and soybean meal for animal feed.
- Low and ultra-low linolenic soybeans contain less than 3 percent linolenic acid vs. about 7 percent for conventional soybean varieties. The saturated fat content of low-linolenic oil is lower than that of partially hydrogenated soybean oil.
- Food grade soybeans include traits that are desirable for certain food uses, including high protein products produced from soy milk and fermented food products.
- High protein and/or oil soybeans contain over 35% protein and/or 19% oil.
- Organic soybeans are produced with the organic production standard. They are mainly used in food production.
The term “conventional” soybeans is often used to talk about “non-GM” varieties, but it may lead to some confusion, because it is also used for varieties that are not organic, or for non-GM varieties without special traits. We will therefore use in this report the term “non-GM” to talk about all kinds of non-GM varieties. When used in quotations the term “conventional” has not been changed.
4 UW Madison Department of Agronomy, Markets for Specialty Soybeans in WI (http://soybean.uwex.edu/documents/marketing_soy_feb_08_rev1.pdf)
Except for the variety description, in section 2, we will not differentiate between the different types of non-GM soybeans. Indeed, data on the production or marketing of different non-GM soybeans are not available.
• Production of non-GM soybeans
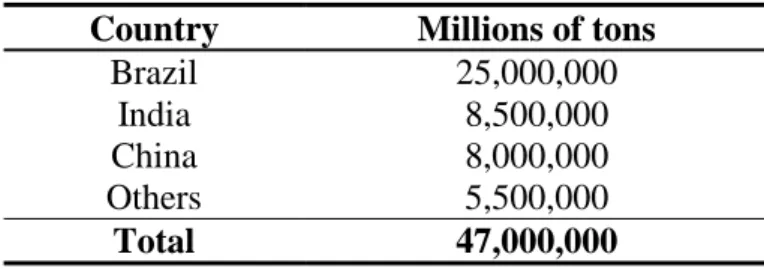
According to ABRANGE, the association of producers of non-GM soybeans, Brazil is producing approximately 53% of the world’s non-GM soy, followed by India and China, countries which produce 18 and 17% of the world’s non-GM crop, respectively.
Country Millions of tons
Brazil 25,000,000
India 8,500,000
China 8,000,000
Others 5,500,000
Total 47,000,000
Table 1 Non-GM soybean production in volume – 2009 Estimated (Source: Abrange)
These estimations however did not include the increase of non-GM production in the U.S. in 2009. According to the estimated surface planted, the total production of non-GM soybeans in the US may represent in 2009 around 7 millions tons. (see section 1.2.1)
• Demand for non-GM soybeans
The demand for non-GM soybeans mainly originates from Europe and Japan.
In Europe, this demand is driven by the production of animals fed with non-GM soybeans. Until now, this demand has been restricted to quality products, like “Label-Rouge” animal products in France (Milanesi, 2008). However, demand for non-GM soybeans may rise in the future due to recent changes in the German and French labelling policies. In 2008 Germany adopted a law authorizing labelling for products from animals fed with non-GM soybeans, that is, containing less than 0.9% of (authorized) GM grains.5 The French National Consumer Council (a democratic consultative body attached to the Ministry for consumer affairs) spoke out in May 2009 in favour of a label mentioning “fed without GMO”,6 with conditions similar to Germany. This (not yet legal) label has already been adopted, with a different phrasing, by the leader of the “Label rouge” poultry market, “Les Fermiers de Loué”,7 and several dairy or meat producers.8 Other poultry producers intend to follow them before the end of 2009.9 The French government has so far tolerated these labels, and has not brought any legal action against the leading firm. This may indicate that this label will be translated later in the French legal framework, in accordance with the recommendation of the National Consumer Council, allowing producers feeding their animals with non-GM soybeans10 (for now, approximately 20% of French animal products) to label their products. The Ethical Economic and Social Committee of the French “High Council of Biotechnologies” is currently working on an advice on “GMO free” products.
These labelling changes in France and Germany, the first and third agricultural producing countries of the EU, consolidate the non-GM policies of producers who already 5http://www.traceconsult.com/images/stories/pdf/nationale_regelungen/EGGenTDurchfG_2008_05_27.pdf 6 http://www.minefi.gouv.fr/conseilnationalconsommation/avis/2009/190509ogm.pdf 7http://www.loue.fr/sans_OGM.asp 8http://www.sans-ogm.org/les-filieres-engagees.asp
9 Personal communication with executives from firms in the sector. 10
adopted it and may give incentives to others.11 These producers are indeed paying a premium for non-GM soybeans12 mainly coming from Brazil, and labelling allows them to value this policy and to pass on the extra costs to consumers.
It may therefore be expected that European demand for non-GM soybeans will stay at the same level (about 1 million tons for France in 200713) or even increase in the coming years, depending on consumer reaction to labels.
Japan is the other important market for non-GM soybeans, mainly for food uses (tofu, natto, miso, soymilk or soy sauce14). All Japanese companies producing soy-food indeed require non-GMO varieties from their suppliers15. A non-GM soybean market has existed in the Tokyo Grain Exchange since 200016 (Parcell, 2001) and in 2006 and 2008 represented more than half of the volume exchanged in this commodity market (Graph 9). GM soybeans from the U.S are also traded in the Kansai commodity exchange (KANEX).17
Graph 9: Trading volume in the Tokyo Grain Exchange (Source:
http://www.orionkoeki.co.jp/en/growth.html)
In 2005, Japanese needs totalled about 1 million tons of soybeans for food uses.18 Around 80% of these soybean imports were from the U.S.,19 with a price premium.
•
Price premiumsImporters of non-GMO soybeans pay premiums (see for instance Graph 10 for premiums paid by a French leader in poultry production) to compensate for segregation costs and give incentives to farmers (Milanesi, 2008).
11 A network of 260 European regions, the “GMO free regions”, also promotes this type of production. (http://www.gmo-free-regions.org/).
12
Ranging from 20 to 30 €/ton on average. 13 Data from importers, personal communications.
14 Kikkoman, Corporate Citizenship Report 2006, Use of Non-GMO (genetically modified) Materials, (http://www.kikkoman.co.jp/kankyou/english/katsudo/6_2.html)
15
The Organic & Non-GMO Report, July 2006, Japan’s non-GMO soybean market update (http://www.non-gmoreport.com/articles/jul06/non_GMO_soybean_market.php)
16http://www.tge.or.jp/english/trading/tra_m01.shtml 17 http://www.kanex.or.jp/english/index-eng.htm 18
Reuters, 9th of March 2005, Safety Concerns Keep E.Asia Consumers Off GMO Food (http://www.planetark.com/dailynewsstory.cfm/newsid/29856/story.htm).
19 The Organic and non-GMO report, November 2008, Japanese soy sauce manufacturers want US non-GMO soybeans
0 10 20 30 40 50 60 70 80 90 0 2 /0 3 /0 3 0 5 /0 3 /0 3 0 8 /0 3 /0 3 1 1 /0 3 /0 3 0 2 /0 3 /0 4 0 5 /0 3 /0 4 0 8 /0 3 /0 4 1 1 /0 3 /0 4 0 2 /0 3 /0 5 0 5 /0 3 /0 5 0 8 /0 3 /0 5 1 1 /0 3 /0 5 0 2 /0 3 /0 6 0 5 /0 3 /0 6 0 8 /0 3 /0 6 1 1 /0 3 /0 6 0 2 /0 3 /0 7 0 5 /0 3 /0 7 0 8 /0 3 /0 7 1 1 /0 3 /0 7 0 2 /0 3 /0 8 0 5 /0 3 /0 8 0 8 /0 3 /0 8 1 1 /0 3 /0 8 0 2 /0 3 /0 9 € /t o n
Graph 10: Premiums paid by a French poultry company for non-GM soybean from Brazil (Source: Personal communication)
1.2 Production of non-GM soybeans in the U.S. and shortage of
non-GM soybean seeds
The U.S. is the world’s leading producer of soybeans, representing one third of world production in 2008 (see Graph 2). After corn (34.4 million hectares planted in 2009), soybeans are the second U.S crop production in terms of planted area (ERS/USDA).
Soybean production is mainly located in the Midwest and the Mississippi valley. Maturity groups20 of varieties range from 00 in the North to VII-VIII in the South (to V for the most commonly used) (Map 1).
Map 1: Location of soybean production (left) and maturity groups (right) of varieties in the U.S. (Source:
NASS/USDA, National Soybean Research Laboratory21)
20 “As soybean breeding developed in the United States and Canada,it became a general practice to group soybeans according totheir photoperiod response and general area of adaptation. Thirteenmaturity groups (MGs) are now recognized. They are designatedby roman numerals, starting with "000" for the earliest maturitygroup adapted to the long days and short summers of southernCanada and northern United States, and ending with "X" for thelatest maturity group, which is adapted to the short days oftropical regions on either side of the equator.” (Alliprandini & al., 2009, p.802)
21
Due to changes in the relative profitability of GM and non-GM varieties, more U.S. farmers decided to grow non-GM soybean in 2009. As seed producers did not expect this
increase, there was a shortage of non-GM seeds in some States. This problem of quantitative availability of non-GM seeds should be solved next year by an increase in seed production.
The following subsection details the main drivers of this increase in non-GM soybean plantings and of the subsequent seed shortage.
1.2.1 An increase in non-GM production
The non-GM soybean area increased by 1 million acres in 2009, from 5.96 million acres (2.4 million hectares) in 2008, to 6.97 million acres (2.8 million hectares).22 After over a decade of permanent decrease of the non-GM area, this figure confirms the first slight increase that occurred in 2008 (Graph 11).
0 5 10 15 20 25 30 1997 1998 1999 2000 2001 2002 2003 2004 2005 2006 2007 2008 2009 M il li o n s o f H e c ta re s Non-GM GM
Graph 11: GM and non-GM soybean planted area in the U.S., in hectares (Sources: Planted areas based on USDA/FAS March 2009)
As a result, the share of non-GM soybean plantings increased in 2009 for the first time since 2000. The non-GM soybeans accounted for 9% of a record high 31.4 million hectares of soybeans planted in 2009. In 2008, non-GMO soybeans accounted for 8% of 30.6 million hectares of soybeans (Graph 12).
Graph 12: Adoption of GM crops in the U.S. (Source: USDA23)
http://www.nsrl.uiuc.edu/aboutsoy/production02.html 22 Data from USDA.
23
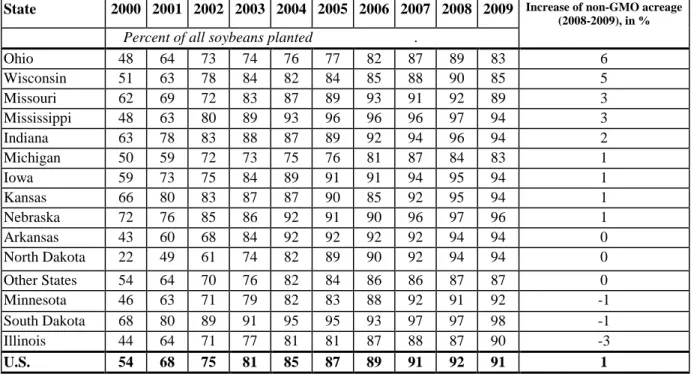
The biggest changes occurred in the Ohio and Wisconsin States, where the non-GM acreage increased by 6% and 5%, respectively. The change was also superior to the U.S. average by 1% in Missouri, Mississippi and Indiana. In Minnesota, South Dakota and Illinois, the non-GM acreage decreased, by 3% for the last State (Table 2).
State 2000 2001 2002 2003 2004 2005 2006 2007 2008 2009 Increase of non-GMO acreage
(2008-2009), in %
Percent of all soybeans planted .
Ohio 48 64 73 74 76 77 82 87 89 83 6 Wisconsin 51 63 78 84 82 84 85 88 90 85 5 Missouri 62 69 72 83 87 89 93 91 92 89 3 Mississippi 48 63 80 89 93 96 96 96 97 94 3 Indiana 63 78 83 88 87 89 92 94 96 94 2 Michigan 50 59 72 73 75 76 81 87 84 83 1 Iowa 59 73 75 84 89 91 91 94 95 94 1 Kansas 66 80 83 87 87 90 85 92 95 94 1 Nebraska 72 76 85 86 92 91 90 96 97 96 1 Arkansas 43 60 68 84 92 92 92 92 94 94 0 North Dakota 22 49 61 74 82 89 90 92 94 94 0 Other States 54 64 70 76 82 84 86 86 87 87 0 Minnesota 46 63 71 79 82 83 88 92 91 92 -1 South Dakota 68 80 89 91 95 95 93 97 97 98 -1 Illinois 44 64 71 77 81 81 87 88 87 90 -3 U.S. 54 68 75 81 85 87 89 91 92 91 1
Table 2: Genetically engineered (GE) soybean varieties by State and United States, 2000-2009 (Source: USDA24)
1.2.2 Good global profitability of non-GM soybeans
This global increase in non-GM plantings may be explained by new economic conditions on GM and non-GM soybean cultivation. The July/August 2009 issue of the Organic & Non-GMO Report writes that “a few farmers told [Mark Albertson, director of marketing at the Illinois Soybean Association] they haven’t grown non-GMO soybeans in seven or eight years but this year they say the economics favour non-GMO.”25
Steve Waddle, in Ohio, is one of these farmers. He explains why in 2009, for the first time in years, he is back to planting non-GM soybeans: “because of the economic conditions last year when our expenses rose drastically and that carried over to into this year and then grain prices dropped, we needed to find other ways to make a profit.”26
According to Jim Beuerlein (Ohio State University), there are “two things that are sparking grower interest: cheaper seed and the grain is worth more. (…) There are a number of markets, both stateside and internationally, that want non-biotech varieties and they are willing to pay the premiums for it”. 27
As seen below this information on the good profitability of non-GM soybean growing has been partially disseminated by universities (Document 1) and small firms (Table 3) providing non-GM seeds and/or marketing non-GM soybeans.
24
http://www.ers.usda.gov/Data/BiotechCrops/ExtentofAdoptionTable3.htm
25 The Organic & Non-GMO Report, July/August 2009
26 WCPN radio, 28th of May 2009 (http://www.wcpn.org/WCPN/news/26357/)
27 Corn and Soybean Digest, 14th of April 2009, Interest in Non-biotech soybeans growing (http://cornandsoybeandigest.com/soybeans/0414-non-biotech-soybean-interest/index.html)
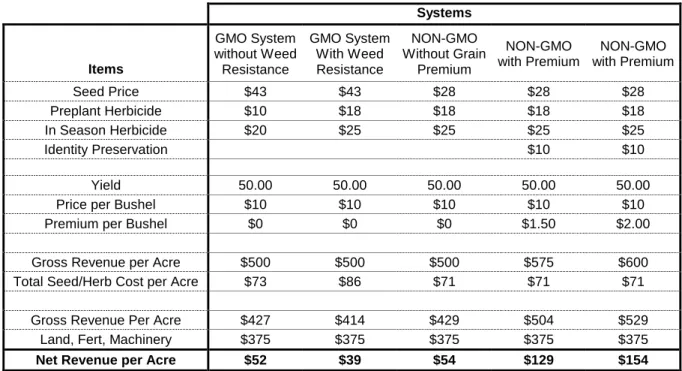
Due to their commercial objectives, the following output of calculations of non-GM value per acre made by eMerge28 (Table 3) should be used with caution. They do however show how companies promoting non-GM seeds and production communicate to farmers on the economic gains they can make with non-GM growing and the overall economic rationale to shift from GM to non-GM.
The drivers of this increased relative profitability of non-GM soybeans (compared with GM soybeans) are detailed in the following subsections.
Document 1: More profit from non-GM soybean, arguments by Dr Grover Shannon from Missouri University (Source: Delta Center Field day, 2008)
28
Systems Items GMO System without Weed Resistance GMO System With Weed Resistance NON-GMO Without Grain Premium NON-GMO with Premium NON-GMO with Premium Seed Price $43 $43 $28 $28 $28 Preplant Herbicide $10 $18 $18 $18 $18 In Season Herbicide $20 $25 $25 $25 $25 Identity Preservation $10 $10 Yield 50.00 50.00 50.00 50.00 50.00
Price per Bushel $10 $10 $10 $10 $10
Premium per Bushel $0 $0 $0 $1.50 $2.00
Gross Revenue per Acre $500 $500 $500 $575 $600
Total Seed/Herb Cost per Acre $73 $86 $71 $71 $71
Gross Revenue Per Acre $427 $414 $429 $504 $529
Land, Fert, Machinery $375 $375 $375 $375 $375
Net Revenue per Acre $52 $39 $54 $129 $154
Table 3: eMerge “Non-GMO Value per Acre Calculator”29 (Source: http://www.emergegenetics.com)
1.2.2.1 Premium for non-GM soybeans
30Premiums are paid to U.S farmers for several types of non-GM soybeans, for feed or human food use. These premiums are usually set through private contracts between soybean firms and farmers,31 and there is no market reference price for non-GM soybeans. These premiums vary according to the type of soybean grown and depend on the usual market supply and demand factors. They are re-evaluated each year.
According to non-GM grain traders these premiums varied in 2009 from 1 to 2.75 $ per bushel, that is to say 36.8 $/ton to 101.1 $/ton. They are large when compared with commodity prices that ranged from 330 $/ton to 430€/ton over the last year (see Graph 8). In a context where soybean commodity prices were decreasing at the end of 2008 and in the beginning of 2009, these premiums created a major incentive for farmers to grow non-GM soybeans.
1.2.2.2 Increase in the production costs of GM soybeans
Farmers or sector specialists often quote the increase in the cost of Roundup Ready seeds as an influential rationale for the soybean growers’ decision. The average cost of GM seeds per acre has indeed more than doubled since the beginning of the decade (Graph 13), and this is a source of concern for the American Farm Bureau Federation: “farmers in general are concerned about the increasing price of biotech seed, reflective of the growing tech fees assigned by life science companies who hold the patents on gene splicing technology.”32
29
Assumptions: Land, Tillage, and Machinery costs are equal across all systems. Seed prices based on published Comparables. Planted acre Requires 1 seed unit (50) Pounds. Glyphosate at $10 per trip. Flexstar, Select, First Rate for in season NON-GMO applications. Application Costs are the same for both systems
30 Most of this information was collected through personal communications with non-GM soybean traders. 31
See for instance the IP programs of Rabbe Grain Co., an international Grain exporter: Identity Preserved Non-GMO Soybean Program 2009 Crop (http://www.rabbegrain.com/index.cfm?show=10&mid=63&pid=2) or IP Commodity Non-GMO Soybean Program 2009 Crop
(http://www.rabbegrain.com/index.cfm?show=10&mid=63&pid=3) 32
After years of global increases, the rise was even sharper between 2008 and 2009 and this year; in 2009 some “farmers [were] buying good traditional (non-GMO) soybean seed for $17 per bag when Roundup Ready seed was going for $35 per bag”.33
According to a recent Monsanto press release, the price of seed in 2010 will be 128 $/ha (52$/acre) for RR soybean and 183$/ha (74$/acre) for the new Roundup Ready 2 Yield soybeans.34
But data shows that non-GM seed prices have also increased significantly (Graph 13), and even more than GM seed prices in the last two years.35 GM seed price increases have therefore not been the major factor in farmers' choices, certainly less than the price premiums paid for non-GM beans and the increase in the cost of herbicides uses.
Graph 13: Trends in seed & pesticide costs in the production costs of soybean in the U.S. (Source: USDA (NASS and ERS) from Bonny, 2009).
The relative competitiveness of Roundup Ready seeds versus non-GM was also hindered by the recent increase in the price of glyphosate herbicides (Graph 13). After several years of decline because of the emergence of generic versions, and stabilization in recent years, the price of glyphosate rose in 2009.
As reported by Gill Gullickson, from AgricultureOnline: “generic glyphosate prices recently increased $12 per gallon, and brand name Roundup by Monsanto in February increased in price by 30%. In some areas, farmers report they pay double for glyphosate what they did a year ago.” The journalist interviewed Jim Zimmer, vice president of Monsanto's branded business, on this issue. According to him, prices are rising because “from a glyphosate standpoint, global demand is accelerating faster than global supply.”
To explain this situation, Jim Zimmer reports that Chinese production plants of glyphosate, which manufacture much of the herbicide for the U.S. market, are running at full
(http://www.michfb.com/files/policy/backgrounders/Biotech%20Versus%20Conventional%20Seed.pdf)
33 Linn Clarkson, president of Clarkson Grain, a buyer of non-GMO soybeans in: Lynn Grooms, 1st of April 2009, Non-Biotech Soybean Seed: Is there enough?, Corn and Soybean Digest
(http://cornandsoybeandigest.com/soybeans/0401-nonbiotech-soybean-seed/)
34http://www.bloomberg.com/apps/news?pid=20601103&sid=aLW8VZBkP3PA
35 Between 2007 and 2009 non-GM soybean seed prices have increased by 64% and GM soybean seed prices by 34% (Source: USDA/NASS).
capacity. Some factories are also closing because of new environmental regulations and there is a shortage of raw materials like phosphorus.
The demand for glyphosate is increasing in Brazil and Argentina because of the development of conservation tillage. "Any time there is conservation tillage, there is a higher use of glyphosate," says Zimmer.36
The cost of using Roundup Ready soybeans is also increasing because of the development of glyphosate-resistant weeds (Graph 14). The high increase in glyphosate use in the U.S. linked to the spread of Roundup Ready varieties “has led to the appearance of weeds resistant to this herbicide. Glyphosate resistant weeds have already appeared in the U.S. in different states (nine weeds at the end of 2008), as well as elsewhere in the world (sixteen weeds in total at the end of 2008)”.37 (Bonny, 2008, p.9)
Farmers therefore have to use more glyphosate and other herbicides to control the resistant weeds. It is more costly and farmers lose part of the agro-economic advantages provided by RR varieties.38
Graph 14: Resistant to glyphosate herbicide worldwide: Glycines curve, in blue (Source: Dr Ian Heap, http://Weedscience.com)
1.2.3 Reduction in distribution channels and problems of production planning
As the number of farmers deciding to plant non-GM soybeans suddenly increased in 2009, the demand for non-GM seeds also increased and some seed sellers sold out these varieties.
John Suber, who runs Ebberts Field Seeds in western Ohio, said for instance to a journalist that “his company usually has booked all its seed orders by January but he was surprised when he sold out of non genetically modified soybean seed early”.39 Jim Orf, a plant breeder from a state university, has collected the same kind of testimony in Minnesota where
36
Gullickson Gil, What's behind glyphosate and Roundup price hikes?, AgricultureOnline, 27/02/2008 (http://www.agriculture.com/ag/story.jhtml?storyid=/templatedata/ag/story/data/1204134767122.xml)
37 To get more information on the species of weeds and their locations:
http://www.weedscience.org/Summary/UspeciesMOA.asp?lstMOAID=12
38 On this issue of weed resistance see for instance Bonny (2009), or the Special issue of the Pest Management Science review about “Glyphosate-Resistant Weeds and Crops” (Volume 64 Issue 4 , Pages 317 - 496 (April 2008))
39
all seed dealers he has talked with “said that they had sold out conventional cultivars.”40 Pioneer has not sold out its non-GM seeds but was close.41
The characteristics of seed production explain these shortages. Production must be planned at least one year before selling and at the beginning of 2008, after years of growing demand for GM seeds, seed producers did not foresee that the demand for non-GM seeds would significantly increase in 2009. Moreover, soybean seeds are very fragile and may not be stored easily, which makes it difficult to adapt soybean seed supply to sudden demand changes by use of seed stocks.
In forecast of a new demand increase next year, some seed producers of non-GM seeds decided to multiply their production by two or three.42 The situation may therefore be back to normal in 2010, unless problems emerge in seed distribution. 43
This situation in seed production explains the shortage of non-GM seeds reported in spring 2009.
1.2.4 Difficulties for U.S. farmers to find non-GM soybean seeds
Because of this seed production (and maybe distribution) planning, non-GM seed availability on the market decreased for U.S. farmers in 2009. But it seems that this situation really began in 2008, the first year of the (slight) increase in non-GM acreage (see above).
In summer 2008, the Non-GMO and Organic Report, a newsletter on organic and non-GMO issues, ran “Finding non-non-GMO soybean seed becoming more difficult” as the headline of an article in which Jim Skiff, the president of the U.S. Soy company, reported a shortage of non-GM soybean seeds.
But the issue of the availability of non-GM soybean seeds in the U.S. market heightened significantly in 2009. The Morning Sun, a newspaper from Kansas, noted on January 19, 2009 that “there have been some questions about the availability of conventional non-GM soybean varieties”.44.
This problem was reported a few months later, in April, by two articles published in the Corn & Soybean Digest. In the first one, Lynn Groom interviewed “Scott Shriver, who farms 1,800 acres near Jefferson, Iowa”. He said that he “has not had problems getting non-biotech seed in the past. But, supplies are getting tighter each year.” The journalist specialized in agricultural issues also interviewed “Allen Williams, who farms about 1,300 acres near Cerro Gordo, Illinois” and who “was unable to find organic seed this year”.45 The second article related the same kind of situation in Ohio.46
However, the situation might not have been the same in all U.S. States. William Schapaugh, Professor in the Department of Agronomy, Kansas State University, and a specialist in soybean breeding and genetics, notes that “farmers did have to work to source non-GM seeds”, but he believes that “if they made the effort, they should have been able to
40 Personal communication
41 Personal communication with a Pioneer executive 42
WCPN radio, May 28 2009, http://www.wcpn.org/WCPN/news/26357/ or Corn and Soybean Digest, 14th of April 2009, Interest in Non-biotech soybeans growing ( http://cornandsoybeandigest.com/soybeans/0414-non-biotech-soybean-interest/ )
43 Indeed, the view has been expressed that the distribution of conventional seeds is also decreasing because “independent seed dealers have affiliated with large companies” who would prohibit them to sell such seeds. (Organic and non-gmo report, July 2008, http://www.non-gmoreport.com/articles/jul08/non-gmo_soybean_seed.php); an analysis that would need confirmation by further investigation.
44 The Morning Sun (Kansas, USA), 17th of January 2009, “Conventional soybean varieties”
(http://www.morningsun.net/columns/x497796000/NEWS-IN-AGRICULTURE)
45 Lynn Grooms, 1st of April 2009, Non-Biotech Soybean Seed: Is there enough?, Corn and Soybean Digest (http://cornandsoybeandigest.com/soybeans/0401-nonbiotech-soybean-seed/)
46 Corn and Soybean Digest, 14th of April 2009, Interest in Non-biotech soybeans growing (http://cornandsoybeandigest.com/soybeans/0414-non-biotech-soybean-interest/index.html)
find seed in the region of a productive public or private conventional variety adapted to their area.”47
Real seed shortage certainly depended on states, but as seen before tensions appeared in the non-GM seed market in spring 2009. According to the information and data gathered they are more a problem of quantity, due to insufficient production of these seeds, than a problem of global availability of diversified and competitive non-GM seeds, an issue that is dealt with in the next section.
1.3 Brazil: the world’s leading producer of non-GM soybeans
With a production of 61 million tons in 2008 (Graph 15), Brazil was the second largest soy producer in the world, and forecasts predict that it will be the first one by 2012. Soy dominates the Brazilian agro-business (KIIHL, CALVO, 2006). In 2006, approximately 50% of total Brazilian agrochemical sales went to soy culture. The soy industry generated revenues of US$ 18 billion in 2008 (ABIOVE, 2009). That same year the major destinations for Brazilian soy were the EU-27 (European Union), which imported 44%, Eastern Asia with 38%, Southeast Asia with 6% and other European countries, the Middle East and North Africa, with 2% each. Between 1997 and 2008, the average soy contribution to overall Brazilian exports was around 9%. (SECEX/MDIC, 2009)
0 10 20 30 40 50 60 70 1 9 8 5 1 9 8 6 1 9 8 7 1 9 8 8 1 9 8 9 1 9 9 0 1 9 9 1 1 9 9 2 1 9 9 3 1 9 9 4 1 9 9 5 1 9 9 6 1 9 9 7 1 9 9 8 1 9 9 9 2 0 0 0 2 0 0 1 2 0 0 2 2 0 0 3 2 0 0 4 2 0 0 5 2 0 0 6 2 0 0 7 2 0 0 8 M il li o n m e tr ic t o n s
Graph 15 : Brazilian soybean production (millions metric tons) (Source: USDA)
The production is mainly located in five southern and central states: Mato Grosso, Parana, Rio Grande do Sul, Goias and Mato Grosso do Sul (Map 2).
47 William Schapaugh (2009). Professor at the Department of Agronomy, Kansas State University. Personal communication.
Map 2 : Average soybean production by state between 2001 and 2005 (Source: USDA)
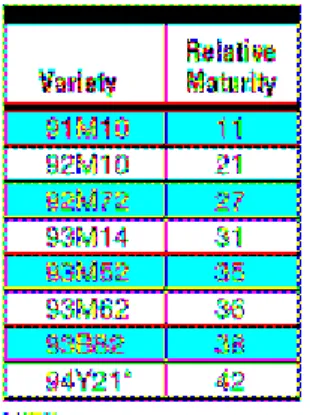
According to Alliprandini (2009), “the traditional Brazilian approach of classifying [soybean] varietiesas early, medium, and late, by region, is gradually being replacedas more and more private companies entering the commercial soybean market are using the North America system used by their parent companies”. In this system, soybean varieties used in Brazil range from maturity group V to X (Map 3).
Map 3 - The distribution of relative maturity groups (RM) for soybean cultivars in Brazil - and localization of trials for stability analyses, 2002–2003 and 2003–2004 seasons. (From Alliprandini, 2009,
p.803)
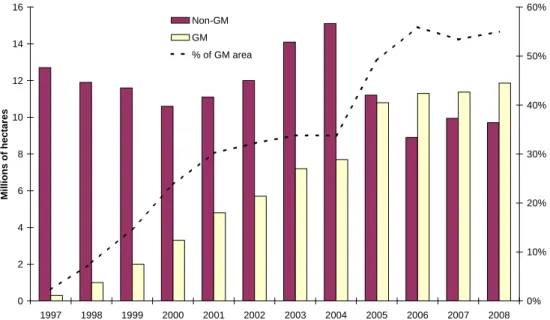
In the aftermath of permission for trade in GMOs in Brazil in 2003, the soy industry extended itself to at least two different segments: 1) conventional soy and 2) GM (genetically-modified) soy. The share of area planted with GM varieties has been quite stable around 55% since 2006 (Graph 16).
0 2 4 6 8 10 12 14 16 1997 1998 1999 2000 2001 2002 2003 2004 2005 2006 2007 2008 M il li o n s o f h e c ta re s 0% 10% 20% 30% 40% 50% 60% Non-GM GM % of GM area
Graph 16 : GM and non-GM soybean planted area in Brazil, in hectares (Sources: CONAB,
www.soystats.com (ISAAA) )
Table 4 shows production areas and data on productivity for GM and non-GM soybean for the years 2007/2008 and 2008/2009. For these two harvests, areas planted with GM and non-GM soy have remained basically the same, although in Brazil the average productivity has been greater for non-GM soy than for the GM variety during this period.
Field Crop Area Productivity
2007/2008 2008/2009 2007/2008 2008/2009 x1000 ha % x1000 ha % kg/ha Productivity differences GMO/NGMO (%) kg/ha Productivity differences GMO/NGMO (%) Total 21.313,10 100% 21.563,10 100% 2.816,00 - 2.696,10 - GMO 11.935,34 56% 11.859,71 55% 2.765,30 0,96 2.633,72 0,95 NGMO 9.377,76 44% 9.703,40 45% 2.880,52 2.772,34
Table 4 - Brazilian GM and non-GM soybean field crop area, productivity in 2007/2008 and 2008/2009 harvest (Source: CONAB, 2009).
According to the CONAB (The National Company for Food and supply) the national share of the area planted with non-GM soybeans reached 45% of the total soybean area in 2009 (Table 4), but the situation is different between Brazilian states (Map 4).
Map 4 - Percentage of conventional soy/percentage of genetically-modified soy across Brazil (Source:
VEJA Edition 2125 / 12 August 2009)
Cert-ID (a third party certification company) also confirms a larger availability of non-GM soybeans: “the cartel's claim that Brazil can't supply GM-free soy feed is particularly outrageous. Despite the economic crisis, Brazil's production of non-GMO soybeans is booming, from 0.4 million tons in 2000 to the 8.85 million tons that were audited and available for certified crushing and shipment to Europe, part of the 2009 harvest which took place from February through May. Moreover, the recent trend of increased GM soy planting has petered out, and may reverse in the 2009-2010 season as farmers find that the disadvantages of planting GM soy outweigh its benefits”.
This year (2009), roughly 26 million tons of non-GM soy (i.e. 45 to 50% of Brazil's total soy harvest of 57.3m tonnes) was non-GM. Although lack of demand led most of this non-GM soy to be sold without segregation and traceability, some 10 million tons were produced within IP systems, certified GM-free below a detection limit of 0.01%, and were available for purchase by European buyers. Furthermore, 6.3 million tons of this were additionally certified via the ProTerra standard as both non-GM and sustainable, and were
sold and shipped as such.”48
According to the ABRASEM (Brazilian Association of Plants and Seeds), the soy seed market in Brazil deals yearly with close to 1.5 billion in Brazilian currency (813 million USD), for volumes of 20 million sacks of 40 kg each. Genetically modified seeds make up 60% of this total, equivalent to 900 million in Brazilian currency (488 million USD49). Two percent royalties are charged per sack of GM soy.50
48http://www.cert-id.eu/ProTerra.php
49
Monthly average exchange rate of august 2009 (1.84431 Brazilian Reals to 1 USD)
1.4 Argentina: Small-scale production of non-GM soybean
Argentina is the world’s third-biggest producer of soybean and the biggest exporter of soybean meal and oil (USDA, February 2008). Soybean growing has been principally developed since the 1990s (Graph 17) and soybean is now the most exported product of the Argentinean economy and a major contributor to government incomes.
0 5 10 15 20 25 30 35 40 45 50 1 9 6 9 / 7 0 1 9 7 1 / 7 2 1 9 7 3 / 7 4 1 9 7 5 / 7 6 1 9 7 8 / 7 9 1 9 8 0 / 8 1 1 9 8 2 / 8 3 1 9 8 4 / 8 5 1 9 8 6 / 8 7 1 9 8 8 / 8 9 1 9 9 0 / 9 1 1 9 9 2 / 9 3 1 9 9 4 / 9 5 1 9 9 6 / 9 7 1 9 9 8 / 9 9 2 0 0 0 / 0 1 2 0 0 2 / 0 3 2 0 0 4 / 0 5 2 0 0 6 / 0 7 M il li o n s o f to n s 0 2 4 6 8 10 12 14 16 18 M il li o n s o f h e c ta re s
Annual Soybean Production (in Tons) Annual Surface of Soybean Harvested (in Ha)
Graph 17: Argentinean soybean production (Source: SAGPyA)
Production is mainly located in the regions of Cordoba, Santa Fe and Buenos Aires (Graph 18), and the diversity of climate conditions allows the use of soybeans from maturity groups II to IX (INTA).
Graph 18: Geographical distribution of Argentinean soybean production (Source: USDA51, SAGPyA52)
The development of soybean production since the end of the 1990s has been based mainly on glyphosate-resistant GM soybeans. Non-GM soybean production in Argentina has
51http://www.usda.gov/oce/weather/pubs/Other/MWCACP/Graphs/Argentina/ArgentinaSoybean.pdf 52
only represented about 1% of total soybean production in the country for several years (Graph 4 and Graph 19). 0 2 4 6 8 10 12 14 16 18 20 1997 1998 1999 2000 2001 2002 2003 2004 2005 2006 2007 2008 M il li o n s o f H e c ta re s GM non-GM
Graph 19: GM and non-GM planted hectares of soybean in Argentina (Source: Soystats (ISAAA), ArgenBio)
Most of these non-GM soybeans are produced for food use, for local consumption or exportation. A very tiny organic production also exists, and represents less than 10,000 ha, i.e. less than 0.1% of total soybean production.53 The Argentinean government gives for instance some support to this production through its program PROFEDER (Federal Program of Rural Development), in the city of Comandante Andresito, near the Brazilian border, where a cooperative of farmers created in 2004 produced 270 tons of organic soybean in 2008. Their production is increasing and is sold through Brazil to Switzerland, England and Germany.54
Due to this low non-GM soybean production, there is virtually no supply of recent non-GM seed varieties. The producers interviewed use seeds that they saved from the previous harvest, from non-GM varieties that were released more than 10 years ago, either the Kumen variety (soybean for human use) released in 2005, or varieties from Brazil.
53 Source: SENASA, http://www.senasa.gov.ar/contenido.php?to=n&in=786&io=2946 54
2 Soybean plant breeding and availability of non-GM
soybean seeds
This section presents Intellectual Property Rights for plant breeders as well as soybean seed industries structures in the U.S., Argentina and Brazil. It details which companies and public actors perform non-GM soybean breeding programs and provide non-GM varieties.
2.1 Intellectual Property Rights for plant breeders in Argentina,
Brazil and the U.S.
The nature and scope of Intellectual Property Rights (IPRs) on plant varieties have a major influence on plant breeding activity. This section gives a rapid overview of these IPRs in Argentina, Brazil and USA.
Patents, plant breeder rights, and the UPOV convention
IPRs “give the creator the right to prevent others from making unauthorized use of their property for a limited period.” The main IP rights used to protect plant varieties are patents and plant breeders' rights (PBRs). A patent is “an exclusive right awarded to an inventor to prevent others from making, selling, distributing, importing or using their invention, without license or authorization, for a fixed period of time.” PBRs “are granted to breeders of new, distinct, uniform and stable plant varieties. They normally offer protection for at least fifteen years (counted from granting). Most countries have exceptions for farmers to save and replant seeds, and for the use of protected materials for further breeding.”55
The convention of the International Union for the Protection of New Varieties of Plants (UPOV) guarantees reciprocity between signatories on protection of new varieties. It was adopted in Paris in 1961 and revised in 1972, 1978 and 1991, with different provisions (Table 5).
Table 5: Comparison of main provisions concerning Plant Breeders’ Rights in UPOV 1978, 1971 (Source: Fuck et al., 2008)
All three countries have specific laws on plant variety protection and have signed the UPOV convention.
55
USA
The U.S. adopted the last UPOV Act (1991) in 1994, after amendments to the Plant Variety Protection Act (PVPA) adopted in 1970, which granted breeders “a Certificate of Protection that gave them exclusive rights to market a new variety for 18 years from the date of issuance. These exclusive rights were subject to two exemptions: (i) a research exemption, which allows the use of the seed to develop new varieties; and (ii) a farmer’s exemption, which allows a farmer whose primary occupation is growing crops for sale to save seed from a protected variety to plant on the farmer’s land, and to sell from that seed to another farmer whose primary occupation also is to grow crops.” The 1994 amendments extend the length of protection from 18 to 20 years from the date of issuance of the certificate. They also “prohibit farmers from selling saved seed of protected varieties without the permission of the variety owner” and introduce an entitlement to protection for “essentially derived” plant varieties. 56 In other words, if the parent variety is granted plant breeders’ rights under the UPOV Convention, then the owner of the parent variety has rights over varieties that are essentially derived from it.57
Of the three countries under study, only the U.S. authorizes patents on plant varieties. Patenting plants (GM or non-GM) has been possible in the U.S. since the Diamond vs Chakrabarty Supreme Court ruling in 1980, which extended patent rights to genetically engineered microorganisms, and a series of subsequent rulings by the Patent and Trademark Office.58
Plant breeders may therefore protect their varieties by both PVP certificates and patents. The U.S. legal framework also provides the opportunity of intellectual protection by trade secret rights.59
BRAZIL
Brazil adhered to the 1978 UPOV Act in 1997 and integrated some elements of the 1991 Act (including that the breeder exemption does not apply to “essentially derived” varieties) through the Plant Variety Protection Law, which came into force in 1997. Breeders may also use the Brazilian legislation on industrial property; however, this legislation excludes patents for plants.60 (see section 2.3.1 for more details)
ARGENTINA
Argentina's first laws on plant protection were adopted during the 1970s,61 “although enforcement began only in the late 1980s as a result of action by wheat breeders, and later, by soy breeders. […] Argentina’s seed law provides for two kinds of plant variety registration, via the National Registry of Cultivars (RNC) and the National Registry of Cultivar Property (RNPC).” Argentina joined the UPOV and adhered to the 1978 Act of the UPOV Convention
56 Fernandez-Cornejo (2004, pp.18-22). For details on the U.S. Plant Variety Protection Act and its recent amendment, also see Evenson (2000).
57 More precisely, “Although this has never been tested in the courts, the American Seed Trade Association and UPOV subcommittees are working to more clearly define when a variety is essentially derived. For example, the percentage of the genetics that must be shared to qualify as an essentially derived variety seems to depend on the crop” (Strachan, p. 88).
58
“The Patent and Trademark Office’s board of appeals and Interferences widened the scope of patent protection for genetically engineered organisms by including plants and nonhuman animals. These rulings extend IPR to a wide range of new biotechnology products in the form of utility patents awarded under the Patent Act. Products protected under the rulings include seeds, plants, plant parts, genes, traits, and biotechnology processes” (Fernandez-Cornejo, 2004, p.21).
59 Evenson (2000, p.12). 60 Fuck & al, 2008, p.227. 61
in 1994 but with a longer protection period than the 1978 Act. 62 Patent protection for plants is not possible in Argentina.
The IPR of plant breeders in Argentina and Brazil have, however, been challenged in recent years by the development of a large-scale parallel black market.63
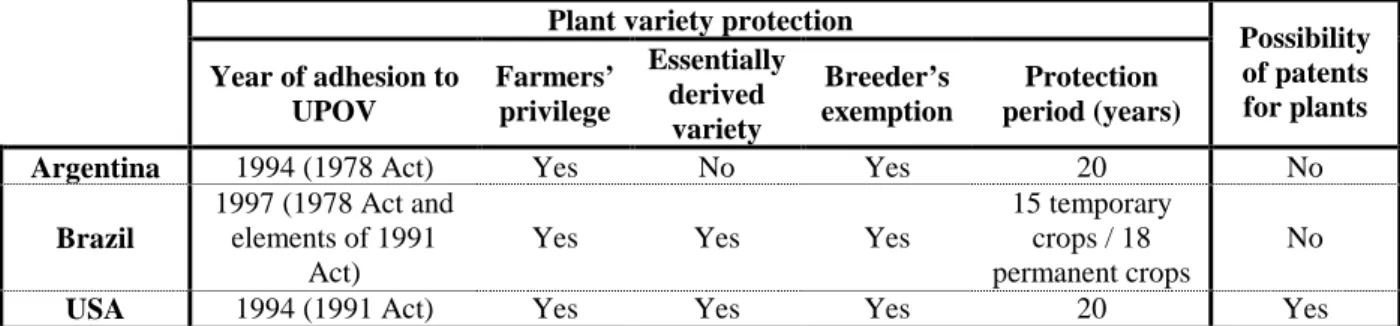
Table 6 below summarizes the main characteristics of plant variety protection in the three countries.
Plant variety protection Year of adhesion to UPOV Farmers’ privilege Essentially derived variety Breeder’s exemption Protection period (years) Possibility of patents for plants
Argentina 1994 (1978 Act) Yes No Yes 20 No
Brazil
1997 (1978 Act and elements of 1991
Act)
Yes Yes Yes
15 temporary crops / 18 permanent crops
No
USA 1994 (1991 Act) Yes Yes Yes 20 Yes
Table 6: Comparison of plant variety protection systems in Argentina, Brazil and USA (Source: Fuck et al. (2008), Fernandez-Cornejo (2004))
2.2 Non-GM breeding and seeds in the U.S.
Due to the recent shortage of non-GM seeds (see section 1.2.4), the availability of competitive non-GM varieties, in terms of phenotypic diversity, has emerged as a topic of interest in the soybean farmer community. For instance, a document from the American Farm Bureau Federation asserted in May 2009 that “the availability of alternative varieties of conventional seed with up-to-date germplasm has been greatly reduced”. This assertion is partly founded on the observation that fewer breeders are breeding non-GM soybeans.
The objective of this section is to examine whether available data on non-GM soybean breeders and on non-GM varieties currently available to farmers corroborate this asserted decrease in non-GM breeding activity.
As the seed industry has substantially changed these last two decades due to mergers and acquisitions and because no recent synthetic data is available on the structure of soybean seed industry, the first part of this sub-section will be dedicated to an analysis of the concentration of the soybean seed industry. The decrease in the number of firms breeding non-GM soybeans could indeed be a logical consequence of the numerous mergers and acquisitions that occurred on the sector. Few data are available on market shares in the soybean seed industry, and such data is not necessarily a good proxy for research and development activities. Therefore, the concentration of the sector will be mainly assessed through Intellectual Property Rights on soybean varieties (variety certificates and patents). As patent data also give information on germplasm ownership, these data will be also useful for the prospective analysis developed in the next chapter about the future of non-GM soybean development.
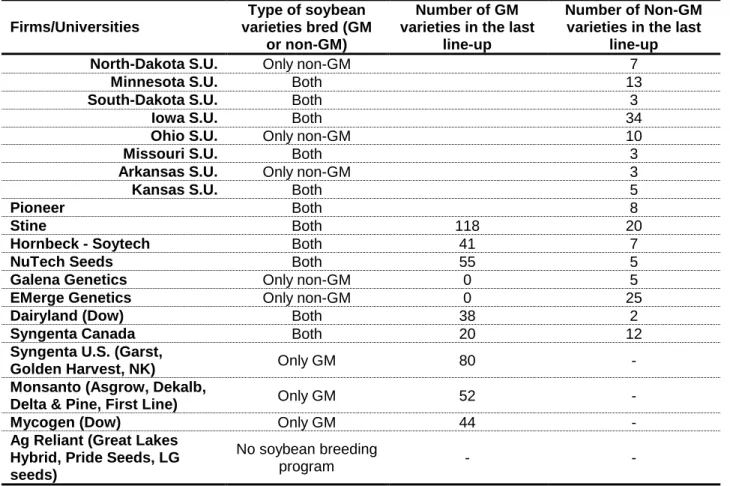
The second part of this sub-section will be dedicated to an assessment of the main companies and universities still breeding non-GM soybean varieties for farmers. The analysis of their line-up will then be used to give an overview of the non-GM varieties currently available to farmers.
62 Fuck & al, 2008, p.228.
63
2.2.1 Market concentration
During the Organization for Competitive Market’s annual conference64 held on August 7, 2009, in Saint Louis, Missouri, Deputy Assistant Attorney General Phil Weiser announced that “the Antitrust Division [was] planning to look, in cooperation with the USDA, into the state of competition in agriculture markets”. He added that they “understand that there are concerns regarding the levels of concentration in the seed industry--particularly for corn and soybeans. In studying this market, [they] will evaluate the emerging industry structure, explore whether new entrants are able to introduce innovations, and examine any practices that potentially threaten competition.”65
Concerns about high concentration in the soybean industry may be understood by examining mergers and acquisitions in the sector as well as concentration in the soybean seed market, in soybean breeding activity and in germplasm ownership (see below).
2.2.1.1 Mergers and acquisitions (M&A) in the soybean seed industry
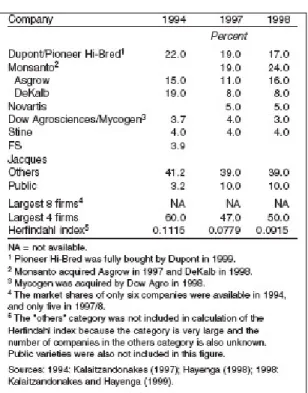
Widespread literature exists about the seed industry and its concentration process. Jorge Fernandez-Cornejo (2006, pp 32-35), in the most complete study to date of the U.S. seed market, traces the evolution of the major seed companies. Similar information can also be found in the AgBioForum special issue “Innovation and dynamic efficiency in agricultural biotechnology”66 (Volume 8, number 2 &3, 2005) and particularly in the article by Pray, Oehmke and Naseem (Graph 20). The Canadian non-profit group ETC67 also published in 2005 detailed information on subsidiaries and acquisitions of the main seed companies.68
Graph 20: Number of M&A events by crop and total of five crops, 1988-2002 (From Pray et al., 2005)
But the most visual presentation of this process of concentration is certainly provided by Phil Howard, assistant professor at the Michigan University, who built a Network Animation of Changes in the seed industry between 1996 and 2008. A Quick Time animation
64 “The Organization for Competitive Markets is a national, non-profit public policy research organization headquartered in Lincoln, Nebraska. OCM believes America must work together, across all commodities, toward the common purpose of returning its food and agricultural sector to true supply and demand-based competition. Antitrust, competition and fair trade are important areas of interest to OCM.” (About OCM,
www.competitivemarkets.com/index.php) 65
http://www.usdoj.gov/atr/public/speeches/248858.htm 66http://www.agbioforum.org/v8n23/index.htm
67 ETC group, September/October 2005, Global seed concentration, Communiqué.
http://www.etcgroup.org/upload/publication/pdf_file/48 68
of this work is available on his website,69 showing the evolution of the seed industry between 1996 and 2009 (Graph 21).
Graph 21: Seed Industry structure in 1996 and in 2009. Pharmaceutical/chemical companies are in red,
seed companies in blue (Source: Phil Howard, http://www.msu.edu/~howardp/)
Another diagram by Phil Howard depicts the seed industry in detail, with the names of all companies, leaders or subsidiaries.
Graph 22: Seed industry structure (Source: Phil Howard, http://www.msu.edu/~howardp/)
69
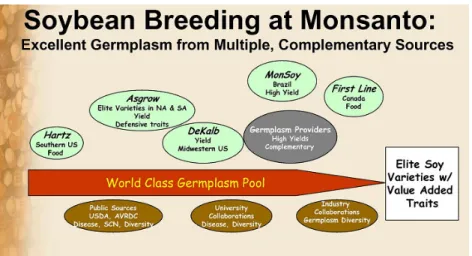
This concentration has been initiated and led by chemical and pharmaceutical companies and affects the whole seed production supply chain, from biotechnology research activities to the food or feed industry. Focusing on the horizontal concentration of the soybean breeding industry, the widest scope of mergers and acquisitions has been achieved by Monsanto.70
The first seed company acquired by Monsanto was Jacob Hartz Seed Co., bought in 1982 and known for its soybean seeds71. After the invention of the Roundup Ready traits in 1993, Monsanto acquired Asgrow agronomics, the U.S. leader in soybean breeding, in 1997. The company also bought Dekalb Genetics in 1998, a leader in the seed industry which in 1988 was selling more than 5% of U.S. soybean seeds (Fernandez-Cornejo, 2004), and combined their breeding programs.72
After having acquired a majority stake in First Line Seeds in 1998, Monsanto completed its purchase of the Canadian soybean seed company in 2004,73 complementing its germplasm resources with early maturity groups.
In 2006, Monsanto bought Delta and Pine Land, a company that “has long been recognized as a leader in developing and marketing soybean varieties that provide strong performance for Southern farmers”. The company from St Louis announced in 2008 that “Delta and Pine Land’s soybean varieties [were] being transitioned to Monsanto’s Asgrow soybean brand”, meaning an integration process of the breeding activities of the two firms .74 This recent acquisition is not included in Figure 1 below, in which Monsanto outlines its soybean breeding resources.
Figure 1: Monsanto’s soybean breeding and germplasm resources (source: Monsanto,
http://www.monsanto.com/pdf/investors/2006/07-31-06b.pdf)
DuPont acquired Pioneer Hi-Bred in 1997 (20% of the company at that date) and 1999 (the remaining 80%). Pioneer Hi-Bred had been an important actor on the soybean seed market in the U.S. since its 1973 acquisition of Peterson seeds (Fernandez-Cornejo, 2004, p. 33).
70 For a broad overview of Monsanto’s acquisitions, see:
http://www.competitivemarkets.com/index2.php?option=com_docman&task=doc_view&gid=5&Itemid=32 71
http://www.monsanto.com/who_we_are/history.asp
72 Agrimarketing, September 2006, The Monsanto Miracle (http://www.agrimarketing.com/show_story.php?id=43340)
73http://claria13.securesites.net/News/releases/2004/february/7827.htm 74