HAL Id: hal-01356849
https://hal.inria.fr/hal-01356849
Submitted on 17 Sep 2016
HAL is a multi-disciplinary open access
archive for the deposit and dissemination of
sci-entific research documents, whether they are
pub-lished or not. The documents may come from
teaching and research institutions in France or
abroad, or from public or private research centers.
L’archive ouverte pluridisciplinaire HAL, est
destinée au dépôt et à la diffusion de documents
scientifiques de niveau recherche, publiés ou non,
émanant des établissements d’enseignement et de
recherche français ou étrangers, des laboratoires
publics ou privés.
Automatic Non-functional Testing of Code Generators
Families
Mohamed Boussaa, Olivier Barais, Benoit Baudry, Gerson Sunyé
To cite this version:
Mohamed Boussaa, Olivier Barais, Benoit Baudry, Gerson Sunyé. Automatic Non-functional Testing
of Code Generators Families. 15th International Conference on Generative Programming: Concepts
& Experiences (GPCE 2016), Oct 2016, Amsterdam, Netherlands. pp.11. �hal-01356849�
Automatic Non-functional Testing of Code Generators Families
Mohamed Boussaa
Olivier Barais
Benoit Baudry
Diverse team INRIA, Rennes, France {mohamed.boussaa, olivier.barais,
benoit.baudry}@inria.fr
Gerson Suny´e
AtlanMod team INRIA, Nantes, France [email protected]
Abstract
The intensive use of generative programming techniques pro-vides an elegant engineering solution to deal with the het-erogeneity of platforms and technological stacks. The use of domain-specific languages for example, leads to the creation of numerous code generators that automatically translate high-level system specifications into multi-target executable code. Producing correct and efficient code generator is complex and error-prone. Although software designers provide generally high-level test suites to verify the functional outcome of gener-ated code, it remains challenging and tedious to verify the be-havior of produced code in terms of non-functional properties. This paper describes a practical approach based on a runtime monitoring infrastructure to automatically check the potential inefficient code generators. This infrastructure, based on sys-tem containers as execution platforms, allows code-generator developers to evaluate the generated code performance. We evaluate our approach by analyzing the performance of Haxe, a popular high-level programming language that involves a set of cross-platform code generators. Experimental results show that our approach is able to detect some performance inconsis-tencies that reveal real issues in Haxe code generators. Categories and Subject Descriptors D.3.4 [Programming Languages]: Processors compilers, code generation
General Terms Generative Programming, Testing, Compo-nents
Keywords code quality, non-functional properties, code gen-erator, testing
1.
Introduction
The intensive use of generative programming techniques has become a common practice for software development to tame the runtime platform heterogeneity that exists in several do-mains such as mobile or Internet of Things development. Gen-erative programming techniques reduce the development and
maintenance effort, allowing the development at a higher-level of abstraction through the use of Domain-Specific Languages (DSLs) [1] for example. Code generators are then necessar-ily needed to transform specifications/models represented in a graphical/textual language to general-purpose programming languages such as C, Java, C++, PHP, JavaScript, etc. In turn, generated code is transformed into machine code (binaries) us-ing a set of specific compilers.
However, code generators are known to be difficult to un-derstand since they involve a set of complex and heteroge-neous technologies which make the activities of design, imple-mentation, and testing very hard and time-consuming [6, 8]. Code generators have to respect different requirements which preserve software reliability and quality. In fact, faulty code generators can generate defective software artifacts which range from uncompilable or semantically dysfunctional code that causes serious damage to the generated software; to non-functional bugs which lead to poor-quality code that can affect system reliability and performance (e. g., high resource usage, high execution time, etc.).
In order to check the correctness of the code generation process, developers often define (at design time) a set of test cases that verify the functional behavior of generated code. After code generation, test suites are executed within each tar-get platform. This may lead to either a correct behavior (i. e., expected output) or incorrect one (i. e., failures, errors). On the other hand, testing the non-functional properties of code generators remains a challenging and time-consuming task be-cause developers have to analyze and verify the non-functional behavior of generated code for different target platforms using platform-specific tools [3, 7]. Currently, there is a lack of au-tomatic solutions that check the non-functional issues such as the properties related to the resource consumption of generated code (Memory or CPU consumption).
In this paper, we propose a practical approach based on a runtime monitoring infrastructure to automatically check the potential inefficient code generators. This infrastructure, based on system containers as execution platforms, allows code-generator developers to evaluate the generated code per-formance. We evaluate our approach by analyzing the non-functional properties of Haxe code generators. Haxe is a
pop-ular high-level programming language1 that involves a set of
cross-platform code generators able to generate code to differ-ent target platforms. Our experimdiffer-ental results show that our approach is able to detect performance inconsistencies that re-veal real issues in Haxe code generators.
The contributions of this paper are the following:
•We propose a fully automated micro-service infrastruc-ture to ensure the deployment and monitoring of generated code. This paper focuses on the relationship between run-time execution of generated code and resource consump-tion profiles (memory usage).
•We also report the results of an empirical study by evaluat-ing the non-functional properties of the Haxe code gener-ators. The obtained results provide evidence to support the claim that our proposed infrastructure is able to detect code generator issues.
The paper is organized as follows. Section 2 describes the motivations behind this work by discussing three examples of code generator families. Section 3 presents an overview of our approach to automatically perform non-functional tests. In par-ticular, we present our infrastructure for non-functional testing of code generators using micro-services. The evaluation and results of our experiments are discussed in Section 4. Finally, related work, concluding remarks, and future work are pro-vided in Sections 5 and 6.
2.
Motivation
2.1 Code Generator Families
This paper is based on the intuition that a code generator is often a member of a family of code generators.
Definition (Code generator family). We define a code gener-ator family as a set of code genergener-ators that takes as input the same language/model and generate code for different target platforms.
The availability of multiple generators with comparable functionality enables to apply the idea of differential test-ing [14] to detect code generator issues. As motivattest-ing exam-ples for this research, we can cite three approaches that inten-sively develop and use code generator families:
a. Haxe. Haxe2 [2] is an open source toolkit for
cross-platform development which compiles to a number of dif-ferent programming platforms, including JavaScript, Flash, PHP, C++, C#, and Java. Haxe involves many features: the Haxe language, multi-platform compilers, and different native libraries. The Haxe language is a high-level programming lan-guage which is strictly typed. This lanlan-guage supports both, functional and object-oriented programming paradigms. It has a common type hierarchy, making certain API available on every target platform. Moreover, Haxe comes with a set of code generators that translate manually-written code (in Haxe
11442 GitHub stars
2http://haxe.org/
language) to different target languages and platforms. This project is popular (more than 1440 stars on GitHub).
b. ThingML. ThingML3is a modeling language for
embed-ded and distributed systems [5]. The idea of ThingML is to develop a practical model-driven software engineering tool-chain which targets resource-constrained embedded systems such as low-power sensors and microcontroller-based devices. ThingML is developed as a domain-specific modeling lan-guage which includes concepts to describe both software com-ponents and communication protocols. The formalism used is a combination of architecture models, state machines and an imperative action language. The ThingML tool-set provides a code generator families to translate ThingML to C, Java and JavaScript. It includes a set of variants for the C and JavaScript code generators to target different embedded systems and their constraints. This project is still confidential, but it is a good candidate to represent the modeling community practices. c. TypeScript. TypeScript4is a typed superset of JavaScript
that compiles to plain JavaScript [19]. In fact, it does not com-pile to only one version of JavaScript. It can transform Type-Script to EcmaType-Script 3, 5 or 6. It can generate JavaType-Script that uses different system modules (’none’, ’commonjs’, ’amd’, ’system’, ’umd’, ’es6’, or ’es2015’)5. This project is popular
(more than 12 619 stars on GitHub).
2.2 Functional Correctness of a Code Generator Family A reliable and acceptable way to increase the confidence in the correctness of a code generator family is to validate and check the functionality of generated code, which is a common prac-tice for compiler validation and testing [11, 25, 26]. Therefore, developers try to check the syntactic and semantic correctness of the generated code by means of different techniques such as static analysis, test suites, etc., and ensure that the code is behaving correctly. Functionally testing a code generator fam-ily in this case would be simple. Since the generated programs have the same input program, the oracle can be defined as the comparison between the functional outputs of these programs which should be the same.
Based on the three sample projects presented above, we re-mark that all GitHub code repositories of the corresponding projects use unit tests to check the correctness of code genera-tors.
2.3 Performance Evaluation of a Code Generator Family Another important aspect of code generators testing is to test the non-functional properties of produced code. Code gener-ators have to respect different requirements to preserve soft-ware reliability and quality [4]. In this case, ensuring the code quality of generated code can require examining several non-functional properties such as code size, resource or energy
3http://thingml.org/
4https://www.typescriptlang.org/
5Each of this variation point can target different code generators (function
consumption, execution time, etc [17]. A non-efficient code generator might generate defective software artifacts (code smells) that violates common software engineering practices. Thus, poor-quality code can affect system reliability and per-formance (e.g., high resource usage, high execution time, etc.). Proving that the generated code is functionally correct is not enough to claim the effectiveness of the code generator un-der test. In looking at the three motivating examples, we can observe that ThingML and TypeScript do not provide any specific tests to check the consistency of code generators re-garding the memory or CPU usage properties. Haxe provides two test cases6 to benchmark the resulting generated code.
One serves to benchmark an example in which object allo-cations are deliberately (over) used to measure how memory access/GC mixes with numeric processing in different target languages. The second test evaluates the network speed across different target platforms.
2.4 Performance Issues of a Code Generator Family The potential issues that can reveal an inefficient code genera-tor can be resumed as following:
•the lack of use of a specific function that exists in the standard library of the target language that can speed or reduce the memory consumption of the resulting program.
•the lack of use of a specific type that exists in the stan-dard library of the target language that can speed or re-duce the memory consumption of the resulting program.
•the lack of use of a specific language feature in a target language that can speed or reduce the memory consump-tion of the resulting program.
The main difficulties with testing the non-functional prop-erties of code generators is that we cannot just observe the execution of produced code, but we have to observe and com-pare the execution of generated programs with equivalent im-plementations (i.e., in other languages). Even if there is no ex-plicit oracle to detect inconsistencies, we could benefit from the family of code generators to compare the behavior of several generated programs and detect singular resource con-sumption profiles that could reveal a code generator bug [10]. Our approach is a black-box testing technique and it does not provide detailed information about the source of the issues, as described above. Nevertheless, we rather provide a mechanism to detect these potential issues within a set of code generator families so that, these issues may be investigated and fixed af-terwards by code generators/software maintainers.
Next section discusses the common process used by devel-opers to automatically test the performance of generated code. We also illustrate how we can benefit from the code generators families to identify suspect singular behaviors.
6https://github.com/HaxeFoundation/haxe/tree/development/tests/benchs
3.
Approach Overview
3.1 Non-Functional Testing of a Code Generator Family: a Common Process
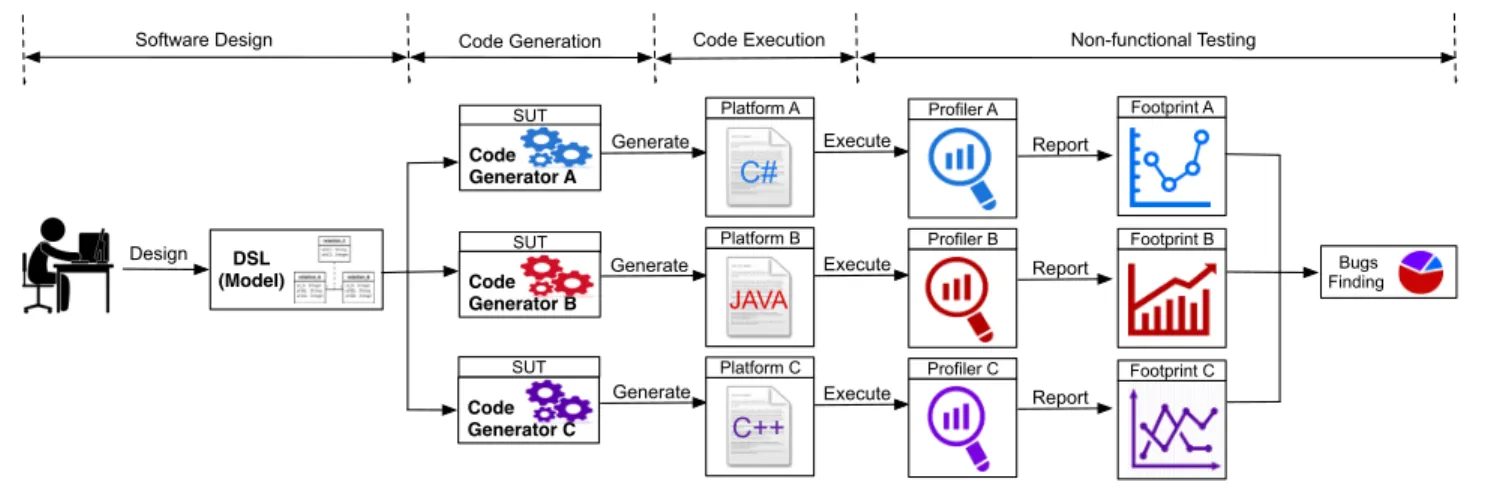
Figure 1 summarizes the classical steps that ensure the code generation and non-functional testing of produced code from design time to runtime. We distinguish 4 major steps: the software design using high-level system specifications, code generation by means of code generators, code execution, and non-functional testing of generated code.
In the first step, software developers have to define, at de-sign time, the software’s behavior using a high-level abstract language (DSLs, models, program, etc). Afterwards, develop-ers can use platform-specific code generators to ease the soft-ware development and automatically generate code for dif-ferent languages and platforms. We depict, as an example in Figure 1, three code generators from the same family capa-ble to generate code to three software programming languages (JAVA, C# and C++). The first step is to generate code from the previously designed model. Afterwards, generated soft-ware artifacts (e.g., JAVA, C#, C++, etc.) are compiled, de-ployed and executed across different target platforms (e.g., Android, ARM/Linux, JVM, x86/Linux, etc.). Finally, to per-form the non-functional testing of generated code, developers have to collect, visualize and compare information about the performance and efficiency of running code across the differ-ent platforms. Therefore, they generally use several platform-specific profilers, trackers, instrumenting and monitoring tools in order to find some inconsistencies or bugs during code ex-ecution [3, 7]. Finding inconsistencies within code generators involves analyzing and inspecting the code and that, for each execution platform. For example, one way to handle that, is to analyze the memory footprint of software execution and find memory leaks [16]. Developers can then inspect the generated code and find some fragments of the code-base that have trig-gered this issue. Therefore, software testers generally use to report statistics about the performance of generated code in order to fix, refactor, and optimize the code generation cess. Compared to this classical testing approach, our pro-posed work seeks to automate the last three steps: generate code, execute it on top of different platforms, and find code generator issues.
3.2 An Infrastructure for Non-functional Testing Using System Containers
To assess the performance/non-functional properties of gen-erated code many system configurations (i.e., execution envi-ronments) must be considered. Running different applications (i.e., generated code) with different configurations on one sin-gle machine is complex. A sinsin-gle system has limited resources and this can lead to performance regressions. Moreover, each execution environment comes with a collection of appropriate tools such as compilers, code generators, debuggers, profilers, etc. Therefore, we need to deploy the test harness, i.e., the pro-duced binaries, on an elastic infrastructure that provide facili-ties to the code generator developers to ensure the deployment
Footprint C Footprint A DSL (Model) SUT SUT SUT Design Generate Generate Generate Code Generator A Code Generator B Code Generator C Execute Execute Execute C++ Platform C Platform B Platform A JAVA C# Profiler A Profiler B Profiler C Bugs Finding Report Report Report Footprint B Code Generation Code Execution Non-functional Testing Software Design
Figure 1. An overall overview of the different processes involved to ensure the code generation and non-functional testing of produced code from design time to runtime: the classical way
and monitoring of generated code in different environment set-tings. Consequently, our infrastructure provides support to au-tomatically:
1. Deploy the generated code, its dependencies and its execu-tion environments
2. Execute the produced binaries in an isolated environment 3. Monitor the execution
4. Gather performance metrics (CPU, Memory, etc.)
To ensure these four main steps, we rely on system contain-ers [21]. It is an operating system-level virtualization method for running multiple isolated Linux systems (containers) on a control host using a single Linux kernel. The Linux kernel provides the cgroups functionality that allows limitation and prioritization of resources (CPU, memory, block I/O, network, etc.) for each container without the need of starting any virtual machines [13]. These containers share the same OS and hard-ware as the hosting machine and it is very useful to use them in order to create new configurable and isolated instances to run. With container-based virtualization, we reduce the overhead associated with having each guest running a new installed op-erating system like using virtual machines. This approach can also improve the performance because there is just one operat-ing system takoperat-ing care of hardware calls.
The rest of this section details the technical choices we have made to synthesize this testing infrastructure.
3.3 Technical Implementation
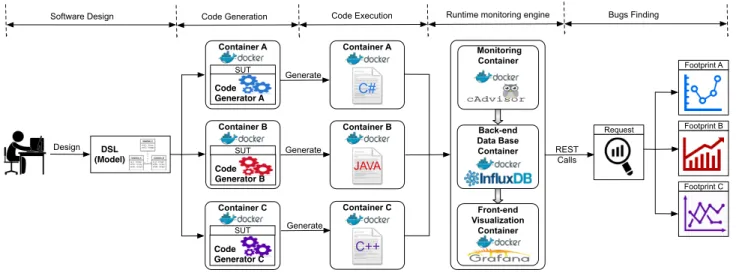
The overall overview of our proposed approach is shown in Figure 2. In the following subsections, we describe the deploy-ment and testing architecture using system containers. 3.3.1 System Containers as Execution Platforms
Before starting to monitor and test applications, we need to deploy the generated code on different components to ease containers provisioning and profiling. We aim to use Docker Linux containers to monitor the execution of different
gener-ated artifacts in terms of resource usage [15]. Docker7 is an
engine that automates the deployment of any application as a lightweight, portable, and self-sufficient container that runs virtually on a host machine. Using Docker, we can define pre-configured applications and servers to host as virtual images. We can also define the way the service should be deployed in the host machine using configuration files called Docker files. In fact, instead of configuring all code generators under test (GUTs) within the same host machine (as shown in Figure 1), our tool wrap each GUT within a container. To do so, we cre-ate a new configuration image for each GUT (i.e., the Docker image) where we install all the libraries, compilers, and depen-dencies needed to ensure the code generation and compilation. Thereby, the GUT produces code within multiple instances of the preconfigured Docker images (see code generation step in Figure 2). We use the public Docker registry8for saving, and
managing all our Docker images. We can then instantiate dif-ferent containers from these Docker images.
Next, each generated code is executed individually inside an isolated Linux container (see code execution step in Fig-ure 2). By doing so, we ensFig-ure that each executed program runs in isolation without being affected by the host machine or any other processes. Moreover, since a container is cheap to create, we are able to create new container instances as long as we have new programs to execute. Since each program ex-ecution requires a new container to be created, it is crucial to remove and kill containers that have finished their job to elim-inate the load on the system. We run the experiment on top of a private data-center that provide a bare-metal installation of docker and docker swarm. On a single machine, container-s/softwares are running sequentially and we pin p cores and n GB of memory for each container9. Once the execution is
done, resources reserved for the container are automatically re-leased to enable spawning next containers. Therefore, the host
7https://www.docker.com
8https://hub.docker.com/
Container C Container B Container A DSL (Model) SUT SUT SUT Design Generate Generate Generate Code Generator A Code Generator B Code Generator C
Code Generation Code Execution Runtime monitoring engine Software Design Container A C# Container B Container C Monitoring Container Back-end Data Base Container Front-end Visualization Container JAVA C++ Footprint C Footprint A REST Calls Footprint B Request Bugs Finding
Figure 2. A technical overview of the different processes involved to ensure the code generation and non-functional testing of produced code from design time to runtime.
machine will not suffer too much from performance trade-offs. In short, the main advantages of this approach are:
•The use of containers induces less performance overhead compared to using a full stack virtualization solution [22]. Indeed, instrumentation and monitoring tools for memory profiling can induce too much overhead.
•Thanks to the use of Dockerfiles, the proposed framework can be configured by software testers in order to define the GUT (e. g., code generator version, dependencies, etc.), the host IP and OS, the DSL design, the optimization options, etc. Thus, we can use the same configured Docker image to execute different instances of generated code. For hardware architecture, containers share the same platform architec-ture as the host machine (e.g., x86, x64, ARM, etc.).
•Docker uses Linux control groups (Cgroups) to group pro-cesses running in the container. This allows us to man-age the resources of a group of processes, which is very valuable. This approach increases the flexibility when we want to manage resources since we can manage every group individually. For example, if we would evaluate the non-functional requirements of generated code within a resource-constrained environment, we can request and limit resources within the execution container according to the needs.
•Although containers run in isolation, they can share data with the host machine and other running containers. Thus, non-functional data relative to resource consumption can be gathered and managed by other containers (i. e., for storage purpose, visualization)
3.3.2 Runtime Testing Components
In order to test our running applications within Docker con-tainers, we aim to use a set of Docker components to ease the extraction of resource usage information (see runtime moni-toring engine in Figure 2).
Monitoring Component This container provides an under-standing of the resource usage and performance character-istics of our running containers. Generally, Docker contain-ers rely on Cgroups file systems to expose a lot of metrics about accumulated CPU cycles, memory, block I/O usage, etc. Therefore, our monitoring component automates the extrac-tion of runtime performance metrics stored in Cgroups files. For example, we access live resource consumption of each container available at the Cgroups file system via stats found in ”/sys/fs/cgroup/cpu/docker/(longid)/” (for CPU consump-tion) and ”/sys/fs/cgroup/memory/docker/(longid)/” (for stats related to memory consumption). This component will auto-mate the process of service discovery and metrics aggregation for each new container. Thus, instead of gathering manually metrics located in Cgroups file systems, it extracts automati-cally the runtime resource usage statistics relative to the run-ning component (i.e., the generated code that is runrun-ning within a container). We note that resource usage information is col-lected in raw data. This process may induce a little overhead because it does very fine-grained accounting of resource us-age on running container. Fortunately, this may not affect the gathered performance values since we run only one version of generated code within each container. To ease the monitoring process, we integrate cAdvisor, a Container Advisor10. cAdvi-sor monitors service containers at runtime.
However, cAdvisor monitors and aggregates live data over only 60 seconds interval. Therefore, we need to record all data over time, from the beginning of the container’s creation, into a time-series database so that, we can run queries and define non-functional metrics from historical data. To make gathered data truly valuable for resource usage monitoring, we link our monitoring component to a back-end database component. Back-end Database Component This component represents a time-series database back-end. It is plugged with the
viously described monitoring component to save the non-functional data for long-term retention, analytics and visu-alization. During code execution, resource usage stats are continuously sent to this component. When a container is killed, we are able to access its relative resource usage met-rics through the database. We choose a time-series database because we are collecting time-series data that correspond to the resource utilization profiles of programs execution.
We use InfluxDB11, an open source distributed time-series
database as a back-end to record data. InfluxDB allows the user to execute SQL-like queries on the database. For example, the following query reports the maximum memory usage of container ”generated code v1” since its creation:
select max(memory usage)fromstats
wherecontainer name=’generated code v1 ’
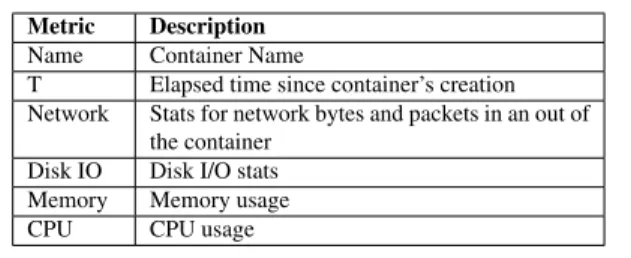
To give an idea about the data gathered by the monitoring component and stored in the time-series database, we describe in Table 1 these collected metrics:
Metric Description
Name Container Name
T Elapsed time since container’s creation
Network Stats for network bytes and packets in an out of the container
Disk IO Disk I/O stats
Memory Memory usage
CPU CPU usage
Table 1. Resource usage metrics recorded in InfluxDB
Apart from that, our framework provides also information about the size of generated binaries and the compilation time needed to produce code. For instance, resource usage statis-tics are collected and stored using these two components. It is relevant to show resource usage profiles of running programs overtime. To do so, we present a front-end visualization com-ponent for performance profiling.
Front-end Visualization Component Once we gather and store resource usage data, the next step is visualizing them. That is the role of the visualization component. It will be the endpoint component that we use to visualize the recorded data. Therefore, we provide a dashboard to run queries and view different profiles of resource consumption of running com-ponents through web UI. Thereby, we can compare visually the profiles of resource consumption among containers. More-over, we use this component to export the data currently being viewed into static CSV document. So, we can perform sta-tistical analysis on this data to detect inconsistencies or per-formance anomalies (see bugs finding step in Figure 2). As a visualization component, we use Grafana12, a time-series vi-sualization tool available for Docker.
11https://github.com/influxdata/influxdb
12https://github.com/grafana/grafana
4.
Evaluation
So far, we have presented an automated component-based framework for extracting the performance properties of gen-erated code. In this section, we evaluate the implementation of our approach by explaining the design of our empirical study and the different methods we used to assess the effectiveness of our approach. The experimental material is available for replication purposes13.
4.1 Experimental Setup
4.1.1 Code Generators Under Test: Haxe Compilers In order to test the applicability of our approach, we conduct experiments on a popular high-level programming language called Haxe and its code generators. Haxe comes with a set of compilers that translate manually-written code (in Haxe language) to different target languages and platforms.
The process of code transformation and generation can be described as following: Haxe compilers analyze the source code written in Haxe language. Then, the code is checked and parsed into a typed structure, resulting in a typed abstract syn-tax tree (AST). This AST is optimized and transformed af-terwards to produce source code for the target platform/lan-guage. Haxe offers the option of choosing which platform to target for each program using command-line options. More-over, some optimizations and debugging information can be enabled through command-line interface, but in our experi-ments, we did not turn on any further options.
4.1.2 Cross-platform Benchmark
One way to prove the effectiveness of our approach is to cre-ate benchmarks. Thus, we use the Haxe language and its code generators to build a cross-platform benchmark. The proposed benchmark is composed of a collection of cross-platform li-braries that can be compiled to different targets. In these ex-periments, we consider five Haxe GUTs: Java, JS, C++, CS, and PHP code generators. To select cross-platform libraries, we explore github and we use the Haxe library repository14.
So, we select seven libraries that provide a set of test suites with high code coverage scores.
In fact, each Haxe library comes with an API and a set of test suites. These tests, written in Haxe, represent a set of unit tests that covers the different functions of the API. The main task of these tests is to check the correct functional behavior of generated programs. To prepare our benchmark, we remove all the tests that fail to compile to our five targets (i.e., errors, crashes and failures) and we keep only test suites that are func-tionally correct in order to focus only on the non-functional properties. Moreover, we add manually new test cases to some libraries in order to extend the number of test suites. The num-ber of test suites depends on the numnum-ber of existing functions within the Haxe library. We use then these test suites to trans-form functional tests into stress tests. This can be useful to
13https://testingcodegenerators.wordpress.com/
study the impact of this load on the non-functional properties of generated code such as the performance and resource usage. For example, if one test suite consumes a lot of resources for a specific target, then this could be explained by the fact that the GUT has produced code that is very greedy in terms of resources. Thus, we run each test suite 1K times to get com-parable values in terms of resource usage. Table 2 describes the Haxe libraries that we have selected in this benchmark to evaluate our approach.
Library #TestSuites Description
Color 19 Color conversion from/to any color space
Core 51 Provides extensions to many types
Hxmath 6 A 2D/3D math library Format 4 Format library such as dates,
number formats
Promise 3 Library for lightweight promises and futures Culture 4 Localization library for Haxe
Math 3 Generation of random values Table 2. Description of selected benchmark libraries
4.1.3 Evaluation Metrics Used
We use to evaluate the efficiency of generated code using the following non-functional metrics:
-Memory usage: It corresponds to the maximum memory consumption of the running container under test. Memory usage is measured in MB
-Execution time: Program execution time is measured in seconds.
We recall that our tool is able to evaluate other non-functional properties of generated code such as code genera-tion time, compilagenera-tion time, code size, CPU usage. We choose to focus, in this experiment, on the performance (i.e., execu-tion time) and resource usage (i.e., memory usage).
4.1.4 Setting up Infrastructure Time-series Database Performance Data Software Tester Performance Analysis 3 Code compilation + generation Code Execution Data Volume
C++ JAVA C# CG Back-end DB Component Monitoring Component Front-end Component Dashboard :8080 :8083 :8086 Haxe Library + Test suites Target Language 1 2 4 5 6
Figure 3. Infrastructure settings for running experiments
To assess our approach, we configure our previously pro-posed container-based infrastructure in order to run experi-ments on the Haxe case study. Figure 3 shows a big picture of the testing and monitoring infrastructure considered in these experiments.
Benchmark TestSuite Std dev TestSuite Std dev TestSuite Std dev
TS1 0.55 TS8 0.24 TS15 0.73 TS2 0.29 TS9 0.22 TS16 0.12 TS3 0.34 TS10 0.10 TS17 0.31 TS4 2.51 TS11 0.17 TS18 0.34 TS5 1.53 TS12 0.28 TS19 120.61 TS6 43.50 TS13 0.33 Color TS7 0.50 TS14 1.88 TS1 0.35 TS18 0.16 TS35 1.30 TS2 0.07 TS19 0.60 TS36 1.13 TS3 0.30 TS20 5.79 TS37 2.02 TS4 27299.89 TS21 0.47 TS38 0.26 TS5 6.12 TS22 2.74 TS39 0.16 TS6 21.90 TS23 2.14 TS40 8.12 TS7 0.41 TS24 3.79 TS41 5.45 TS8 0.28 TS25 0.19 TS42 0.11 TS9 0.78 TS26 0.13 TS43 1.41 TS10 1.82 TS27 5.59 TS44 1.56 TS11 180.68 TS28 1.71 TS45 0.11 TS12 185.02 TS29 0.26 TS46 1.04 TS13 128.78 TS30 0.44 TS47 0.23 TS14 0.71 TS31 1.71 TS48 1.34 TS15 0.12 TS32 2.42 TS49 1.86 TS16 0.65 TS33 8.29 TS50 1.28 Core TS17 0.26 TS34 5.25 TS51 3.53 TS1 31.65 TS3 30.34 TS5 0.40 Hxmath TS2 4.27 TS4 0.25 TS6 0.87 TS1 0.28 TS3 95.36 TS4 1.49 Format TS2 64.94 Promise TS1 0.29 TS2 13.21 TS3 1.21 TS1 0.13 TS3 0.13 TS4 1.40 Culture TS2 0.10 Math TS1 642.85 TS2 28.32 TS3 24.40
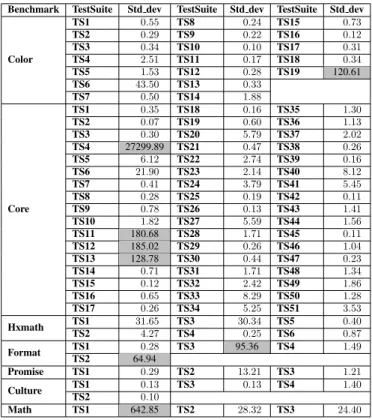
Table 3. The comparison results of running each test suite across five target languages: the metric used is the standard deviation between execution times
First, we create a new Docker image in where we install the Haxe code generators and compilers (through the configu-ration file ”Dockerfile”). Then a new instance of that image is created. It takes as an input the Haxe library we would to test and the list of test suites (step 1). It produces as an output the source code for specific software platforms. These files are saved in a shared repository. In Docker environment, this repository is called ”data volume”. A data volume is a specially-designated directory within containers that shares data with the host machine. Thus, generated binaries, in the shared volume, are automatically executed within the execu-tion container (Step 2). This execuexecu-tion container is as well an instance of a new Docker image in where we install all the required execution environments such as php interpreter, NodeJS, etc.
In the meantime, while running test suites inside the con-tainer, we collect runtime resource usage data using cAdvi-sor (step 3). The cAdvicAdvi-sor Docker image does not need any configuration on the host machine. We have just to run it on our host machine. It will have then access to the resource us-age and performance characteristics of all running containers. cAdvisor has been widely used in different projects such as
Benchmark TestSuite Std dev TestSuite Std dev TestSuite Std dev TS1 10.19 TS8 1.23 TS15 14.44 TS2 1.17 TS9 1.95 TS16 1.13 TS3 0.89 TS10 1.27 TS17 0.72 TS4 30.34 TS11 0.57 TS18 0.97 TS5 31.79 TS12 1.11 TS19 777.32 TS6 593.05 TS13 0.46 Color TS7 12.14 TS14 45.90 TS1 1.40 TS18 1.00 TS35 14.13 TS2 1.17 TS19 20.37 TS36 32.41 TS3 0.60 TS20 128.23 TS37 22.72 TS4 403.15 TS21 24.38 TS38 2.19 TS5 41.95 TS22 76.24 TS39 0.26 TS6 203.55 TS23 18.82 TS40 126.29 TS7 19.69 TS24 72.01 TS41 31.01 TS8 0.78 TS25 0.21 TS42 0.93 TS9 30.41 TS26 2.30 TS43 50.36 TS10 57.19 TS27 101.53 TS44 12.56 TS11 68.92 TS28 43.67 TS45 0.91 TS12 74.19 TS29 0.90 TS46 27.28 TS13 263.99 TS30 4.02 TS47 1.10 TS14 19.89 TS31 52.35 TS48 15.40 TS15 0.30 TS32 134.75 TS49 37.01 TS16 28.29 TS33 82.66 TS50 23.29 Core TS17 1.16 TS34 89.57 TS51 1.28 TS1 444.18 TS3 425.65 TS5 17.69 Hxmath TS2 154.80 TS4 0.96 TS6 46.13 TS1 0.74 TS3 255.36 TS4 8.40 Format TS2 106.87 Promise TS1 0.30 TS2 58.76 TS3 20.04 TS1 1.28 TS3 0.58 TS4 15.69 Culture TS2 4.51 Math TS1 1041.53 TS2 234.93 TS3 281.12
Table 4. The comparison results of running each test suite across five target languages: the metric used is the standard deviation between memory consumptions
Heapster15and Google Cloud Platform16. Afterwards, we con-figure our InfluxDB back-end container in order to record the collected data into a new time-series database (step 4).
Next, we run Grafana and we link it to InfluxDB. Grafana can request data from the database. We recall that InfluxDB also provides a web UI to query the database and show graphs (step 5). But, Grafana lets us display live results over time in much pretty looking graphs. Same as InfluxDB, we use SQL queries to extract non-functional metrics from the database for visualization and analysis (step 6). In our experiment, we are gathering the maximum memory usage values without presenting the graphs of resource usage profiles.
To obtain comparable and reproducible results, we use the same hardware across all experiments: a farm of AMD A10-7700K APU Radeon(TM) R7 Graphics processor with 4 CPU cores (2.0 GHz), running Linux with a 64 bit kernel and 16 GB of system memory. We reserve one core and 4 GB of memory for each running container.
4.2 Experimental Results
4.2.1 Evaluation Using the Standard Deviation
We now conduct experiments based on the new created bench-mark. The goal of running these experiments is to observe and compare the behavior of generated code in order to detect code
15https://github.com/kubernetes/heapster
16https://cloud.google.com/
generator inconsistencies. Since we are comparing equivalent implementations of the same program written in different lan-guages, we assume that the memory usage and execution time should be more or less the same with a small variation for each test suite. Obviously, we are expecting to get a variation between different executions because we are comparing the execution time and memory usage of test suites that are writ-ten in heterogeneous languages and executed using different technologies (e.g., interpreters for PHP, JVM for JAVA, etc.). Therefore, we use, as a quality metric, the standard deviation to quantify the amount of variation among execution traces (i.e., memory usage or execution time) and that, for the five target languages. We recall that the formula of standard devia-tion is the square root of the variance. Thus, we are calculating this variance as the squared differences from the mean. Our data values in our experiment represent the obtained values in five languages. So, for each test suite we are taking the mean of these five values in order to calculate the variance. A low standard deviation of a test suite execution, indicates that the data points (execution time or memory usage data) tend to be close to the mean which we consider as an acceptable behav-ior. On the other hand, a high standard deviation indicates that one or more data points are spread out over a wider range of values which can be more likely interpreted as a code genera-tor inconsistency.
In Table 3, we report the comparison results of running the benchmark in terms of execution speed. At the first glance, we can clearly see that all standard deviations are mostly close to 0 - 8 interval. However, we remark in the same table, that there are some variation points where the deviation is relatively high. We count 8 test suites where the deviation is higher than 60 (highlighted in gray). We choose this value (i.e., standard deviation = 60) as a threshold to designate the points where the variation is extremely high. Thus, we consider values higher than 60 as a potential possibility where a non-functional bug could occur. These variations can be explained by the fact that the execution speed of one or more test suites varies consid-erably from one language to another. This argues the idea that the code generator has produced a suspect code behavior for one or more target language, which led to a high performance variation. We provide later better explanation in order to detect the faulty code generators.
Similarly, Table 4 resumes the comparison results of test suites execution regarding memory usage. The variation in this experiment are more important than previous results. This can be argued by the fact that the memory utilization and alloca-tion patterns are different for each language. Nevertheless, we can recognize some points where the variation is extremely high. Thus, we choose a threshold value equal to 400 and we highlighted, in gray, the points that exceed this value. Thus, we detect 6 test suites where the variation is extremely high. One of the reasons that caused this variation may occur when the test suite executes some parts of the code (in a specific language) that are so greedy in terms of resources. This may not be the case when the variation is lower than 10 for
exam-JS JAVA C++ CS PHP
Time(s) Factor Time(s) Factor Time(s) Factor Time(s) Factor Time(s) Factor
Color TS19 4.52 x 1.0 8.61 x 1.9 10.73 x 2.4 14.99 x 3.3 279.27 x61.8 Core TS4 665.78 x 1.0 416.85 x 0.6 699.11 x 1.1 1161.29 x 1.7 61 777.21 x92.8 Core TS11 4.27 x 1.0 1.80 x 0.4 1.57 x 0.4 5.71 x 1.3 407.33 x95.4 Core TS12 4.71 x 1.0 2.06 x 0.4 1.60 x 0.3 5.36 x 1.1 417.14 x88.6 Core TS13 6.26 x 1.0 5.91 x 0.9 11.04 x 1.8 14.14 x 2.3 297.21 x47.5 Format TS2 2.31 x 1.0 2.10 x 0.9 1.81 x 0.8 6.08 x 2.6 148.24 x64.1 Format TS3 5.40 x 1.0 5.03 x 0.9 7.67 x 1.4 12.38 x 2.3 220.76 x40.9 Math TS1 3.01 x 1.0 12.51 x 4.2 16.30 x 5.4 14.14 x 4.7 1448.90 x481.7
Table 5. Raw data values of test suites that led to the highest variation in terms of execution time
JS JAVA C++ CS PHP
Memory(Mb) Factor Memory(Mb) Factor Memory(Mb) Factor Memory(Mb) Factor Memory(Mb) Factor Color TS6 900.70 x 1.0 1362.55 x 1.5 2275.49 x 2.5 1283.31 x 1.4 758.79 x 0.8 Color TS19 253.01 x 1.0 819.92 x 3.2 923.99 x 3.7 327.61 x 1.3 2189.86 x 8.7 Core TS4 303.09 x 1.0 768.22 x 2.5 618.42 x 2 235.75 x 0.8 1237.15 x 4.1 Hxmath TS1 104.00 x 1.0 335.50 x 3.2 296.43 x 2.9 156.41 x 1.5 1192.98 x11.5 Hxmath TS3 111.68 x 1.0 389.73 x 3.5 273.12 x 2.4 136.49 x 1.2 1146.05 x10.3 Math TS1 493.66 x 1.0 831.44 x 1.7 1492.97 x 3 806.33 x 1.6 3088.15 x 6.3
Table 6. Raw data values of test suites that led to the highest variation in terms of memory usage ple. We assume then, that faulty code generators, in identified
points, represent a threat for software quality since the gener-ated code has shown symptoms of poor-quality design. 4.2.2 Analysis
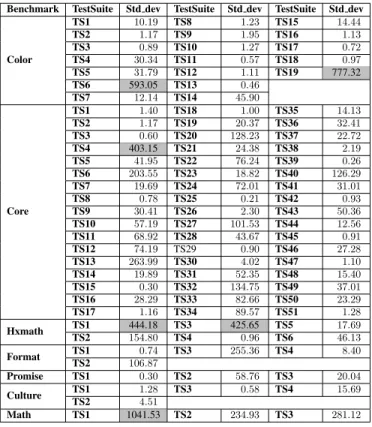
Now that we have observed the non-functional behavior of test suites execution in different languages, we can analyze the extreme points we have detected in previous tables to observe in greater depth the source of such deviation. For that reason, we present in Table 5 and 6 the raw data values of these extreme test suites in terms of execution time and memory usage.
Table 5 shows the execution time of each test suite in a specific target language. We also provide factors of execution times among test suites running in different languages by tak-ing as a baseline the JS version. We can clearly see that the PHP code has a singular behavior regarding the performance with a factor ranging from x40.9 for test suite 3 in bench-mark Format (Format TS3) to x481.7 for Math TS1. We re-mark also that running Core TS4 takes 61777 seconds (almost 17 hours) compared to a 416 seconds (around 6 minutes) in JAVA which is a very large gap. The highest factor detected for other languages ranges from x0.3 to x5.4 which is not neg-ligible but it represents a small deviation compared to PHP version. While it is true that we are comparing different ver-sions of generated code, it was expected to get some variations while running test cases in terms of execution time. However, in the case of PHP code generator, it is far to be a simple vari-ation but it is more likely to be a code generator inconsistency that led to such performance regression.
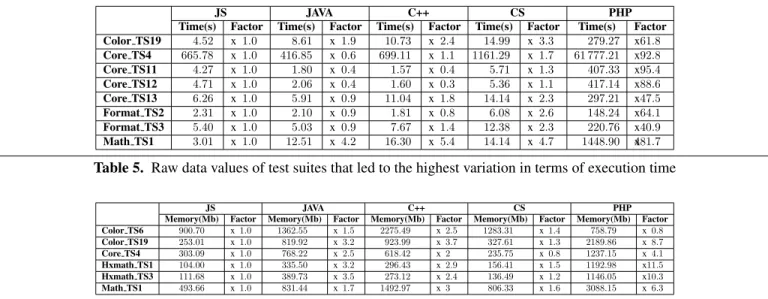
Meanwhile, we gathered information about the points that led to the highest standard deviation in terms of memory us-age. Table 6 shows these results. Again, we can identify a sin-gular behavior of the PHP code regarding the memory usage for the five last test suites with a factor ranging from x4.1 to x11.5 compared to the JS version. For other test suites
versions, the factor varies from x0.8 to x3.7. However, for Color TS6, C# version consumes higher memory than other languages and even higher than PHP (x2.5 more than JS). These results prove that the PHP code generator is not always effective and it constitutes a performance threat for the gen-erated code. This inconsistency need to be fixed later by code generator creators in order to enhance the code quality of gen-erated code (PHP code for example). Since we are proposing a black-box testing approach, our solution is not able to pro-vide more precise and detailed information about the part of code that has caused these performance issue, which is one of the limitations of this testing infrastructure. Thus, to un-derstand this particular singular performance of the PHP code when applying the test suite core TS4 for example, we looked (manually) into the PHP code corresponding to this test suite. In fact, we observe the intensive use of ”arrays” in most of the functions under test. Arrays are known to be slow in PHP and PHP library has introduced much more advanced func-tions such as array f ill and specialized abstract types such as ”SplFixedArray”17to overcome this limitation. So, by chang-ing just these two parts in the generated code, we improve the PHP code speed with a factor x5 which is very valuable.
In short, the lack of use of specific types, in native PHP standard library, by the PHP code generator such as SplFixedAr-rayshows a real impact on the non-functional behavior of gen-erated code. In contrast, selecting carefully the adequate types and functions to generate code can lead to performance im-provement. We can observe the same kind of error in the C++ program during one test suite execution (Color TS6) which consumes too much memory. The types used in the code gen-erator are not the best ones.
4.3 Threats to Validity
We resume, in the following paragraphs, external and internal threats that can be raised:
External validityrefers to the generalizability of our find-ings. In this study, we perform experiments on Haxe and on a set of test suite selected from Github and from the Haxe community. For instance, we have no guarantee that these li-braries cover all the Haxe language features neither than all the Haxe standard libraries. Consequently, we cannot guarantee that our approach is able to find all the code generators issues unless we develop a more comprehensive test suite. Moreover, the threshold defined to detect the singular performance be-havior has a huge impact on the precision and recall of the proposed approach. Experiments should be replicated to other case studies to confirm our findings and try to understand the best heuristic to detect the code generator issues regarding per-formance (i.e., automatically calculate the threshold values)
Internal validityis concerned with the use of a container-based approach. Even if it exists emulators such as Qemu18 that allow to reflect the behavior of heterogeneous hardware, the chosen infrastructure has not been evaluated to test gen-erated code that target heterogeneous hardware machines. In addition, even though system containers are known to be lightweight and less resource-intensive compared to full-stack virtualization, we would validate the reliability of our ap-proach by comparing it with a non-virtualized apap-proach in order to see the impact of using containers on the accuracy of the results.
5.
Related Work
Previous work on non-functional testing of code generators fo-cuses on comparing, as oracle, the non-functional properties of hand-written code to automatically generated code [20, 23]. As an example, Strekelj et al. [24] implemented a simple 2D game in both the Haxe programming language and the native environment and evaluated the difference in performance be-tween the two versions of code. They showed that the gen-erated code through Haxe has better performance than hand-written code. In compiler testing, Yang et al. [28] use to find compiler issues based on differential testing technique. It con-sists on comparing the output of different variants of the same C program. To do so, they apply standard compiler optimiza-tions to generate variants and compare the functional output of these programs. Compared to our approach, we are apply-ing the same differential testapply-ing technique, but we are usapply-ing it to compare the non-functional properties of the same input program executed within different software platforms.
Cross-platform mobile development has been also part of the non-functional testing goals since many code generators are increasingly used in industry for automatic cross-platform development. In [9, 18], authors compare the performance of a set of cross-platform code generators and presented the most efficient tools.
The container-based infrastructure has been also applied to the software testing, especially in the cloud [12]. Sun et al. [27] present a tool to test, optimize, and automate cloud resource allocation decisions to meet QoS goals for web applications.
18https://goo.gl/SxKG1e
Their infrastructure relies on Docker to gather information about the resource usage of deployed web servers.
Most of the previous works on code generators testing focus on checking the correct functional behavior of generated code. Stuermer et al. [25] present a systematic test approach for model-based code generators. They investigate the impact of optimization rules for model-based code generation by com-paring the output of the code execution with the output of the model execution. If these outputs are equivalent, it is assumed that the code generator works as expected. They evaluate the effectiveness of their approach by means of optimizations per-formed by the TargetLink code generator. They have used Simulink as a simulation environment of models. In [11], au-thors presented a testing approach of the Genesys code genera-tor framework which tests the translation performed by a code generator from a semantic perspective rather than just check-ing for syntactic correctness of the generation result. Basically, Genesys realizes back-to-back testing by executing both the source model as well as the generated code on top of different target platforms. Both executions produce traces and execution footprints which are then compared.
Compared to our proposal, none of the previous works has provided an automatic approach for testing and monitoring the generated code in terms of non-functional properties.
6.
Conclusion and Future Work
In this paper we have described a new approach for testing and monitoring the code generators families using a container-based infrastructure. We used a set of micro-services in order to provide a fine-grained understanding of resource consump-tion. To validate our approach, we evaluate a popular family of code generators: HAXE. The evaluation results show that we can find real issues in existing code generators. In particular, we show that we could find two kinds of errors: the lack of use of a specific function and an abstract type that exist in the standard library of the target language which can reduce the memory usage/execution time of the resulting program.
As a current work, we are discussing with the Haxe com-munity to submit a patch with the first findings. We are also conducting the same evaluation for two other code generators families: ThingML and TypeScript. As a future work, we are going to improve our understanding on the threshold which can provide a best precision for detecting performance issues in code generators. In this paper, we detected inconsistencies related to the execution speed and memory usage. In the future, we seek, using the same testing infrastructure, to detect more code generator inconsistencies related to other non-functional metrics such CPU consumption, etc.
Acknowledgment
This work was funded by the European Union Seventh Frame-work Program (FP7/2007-2013) under grant agreement n611337, HEADS project (www.heads-project.eu)
References
[1] M. Brambilla, J. Cabot, and M. Wimmer. Model-driven soft-ware engineering in practice. Synthesis Lectures on Softsoft-ware Engineering, 1(1):1–182, 2012.
[2] B. Dasnois. HaXe 2 Beginner’s Guide. Packt Publishing Ltd, 2011.
[3] N. Delgado, A. Q. Gates, and S. Roach. A taxonomy and catalog of runtime software-fault monitoring tools. IEEE Transactions on software Engineering, 30(12):859–872, 2004.
[4] M. Demertzi, M. Annavaram, and M. Hall. Analyzing the effects of compiler optimizations on application reliability. In Workload Characterization (IISWC), 2011 IEEE International Symposium on, pages 184–193. IEEE, 2011.
[5] F. Fleurey, B. Morin, A. Solberg, and O. Barais. Mde to manage communications with and between resource-constrained sys-tems. In International Conference on Model Driven Engineering Languages and Systems, pages 349–363. Springer, 2011. [6] R. France and B. Rumpe. Model-driven development of
com-plex software: A research roadmap. In 2007 Future of Software Engineering, pages 37–54. IEEE Computer Society, 2007. [7] V. Guana and E. Stroulia. Chaintracker, a model-transformation
trace analysis tool for code-generation environments. In ICMT, pages 146–153. Springer, 2014.
[8] V. Guana and E. Stroulia. How do developers solve software-engineering tasks on model-based code generators? an empir-ical study design. In First International Workshop on Human Factors in Modeling (HuFaMo 2015). CEUR-WS, pages 33–38, 2015.
[9] G. Hartmann, G. Stead, and A. DeGani. Cross-platform mobile development. Mobile Learning Environment, Cambridge, pages 1–18, 2011.
[10] R. Hundt. Loop recognition in c++/java/go/scala. In Proceed-ings of Scala Days 2011, June 2011.
[11] S. J¨orges and B. Steffen. Back-to-back testing of model-based code generators. In International Symposium On Leveraging Applications of Formal Methods, Verification and Validation, pages 425–444. Springer, 2014.
[12] L. Li, T. Tang, and W. Chou. A rest service framework for fine-grained resource management in container-based cloud. In 2015 IEEE 8th International Conference on Cloud Computing, pages 645–652. IEEE, 2015.
[13] R. Luo, W. Ye, and S. Zhang. Towards a deployment system for cloud applications.
[14] W. M. McKeeman. Differential testing for software. Digital Technical Journal, 10(1):100–107, 1998.
[15] D. Merkel. Docker: lightweight linux containers for consis-tent development and deployment. Linux Journal, 2014(239):
2, 2014.
[16] N. Nethercote and J. Seward. Valgrind: a framework for heavy-weight dynamic binary instrumentation. In ACM Sigplan no-tices, volume 42, pages 89–100. ACM, 2007.
[17] Z. Pan and R. Eigenmann. Fast and effective orchestration of compiler optimizations for automatic performance tuning. In International Symposium on Code Generation and Optimization (CGO’06), pages 12–pp. IEEE, 2006.
[18] A. Pazirandeh and E. Vorobyeva. Evaluation of cross-platform tools for mobile development. 2015.
[19] A. Rastogi, N. Swamy, C. Fournet, G. Bierman, and P. Vekris. Safe & efficient gradual typing for typescript. In ACM SIGPLAN Notices, volume 50, pages 167–180. ACM, 2015.
[20] J. Richard-Foy, O. Barais, and J.-M. J´ez´equel. Efficient high-level abstractions for web programming. In ACM SIGPLAN Notices, volume 49, pages 53–60. ACM, 2013.
[21] S. Soltesz, H. P¨otzl, M. E. Fiuczynski, A. Bavier, and L. Peter-son. Container-based operating system virtualization: a scalable, high-performance alternative to hypervisors. In ACM SIGOPS Operating Systems Review, volume 41, pages 275–287. ACM, 2007.
[22] C. C. Spoiala, A. Calinciuc, C. O. Turcu, and C. Filote. Perfor-mance comparison of a webrtc server on docker versus virtual machine. In 2016 International Conference on Development and Application Systems (DAS), pages 295–298. IEEE, 2016. [23] S. Stepasyuk and Y. Paunov. Evaluating the haxe programming
language-performance comparison between haxe and platform-specific languages. 2015.
[24] D. ˇStrekelj, H. Leventi´c, and I. Gali´c. Performance overhead of haxe programming language for cross-platform game develop-ment. International Journal of Electrical and Computer Engi-neering Systems, 6(1):9–13, 2015.
[25] I. Stuermer, M. Conrad, H. Doerr, and P. Pepper. Systematic testing of model-based code generators. IEEE Transactions on Software Engineering, 33(9):622, 2007.
[26] I. St¨urmer, D. Weinberg, and M. Conrad. Overview of existing safeguarding techniques for automatically generated code. In ACM SIGSOFT Software Engineering Notes, volume 30, pages 1–6. ACM, 2005.
[27] Y. Sun, J. White, S. Eade, and D. C. Schmidt. Roar: A qos-oriented modeling framework for automated cloud resource al-location and optimization. Journal of Systems and Software, 116:146–161, 2016.
[28] X. Yang, Y. Chen, E. Eide, and J. Regehr. Finding and under-standing bugs in c compilers. In ACM SIGPLAN Notices, vol-ume 46, pages 283–294. ACM, 2011.