A circuit mechanism for differentiating
positive and negative associations
The MIT Faculty has made this article openly available.
Please share
how this access benefits you. Your story matters.
Citation
Namburi, Praneeth, Anna Beyeler, Suzuko Yorozu, Gwendolyn G.
Calhoon, Sarah A. Halbert, Romy Wichmann, Stephanie S. Holden,
et al. “A Circuit Mechanism for Differentiating Positive and Negative
Associations.” Nature 520, no. 7549 (April 30, 2015): 675–78.
As Published
http://dx.doi.org/10.1038/nature14366
Publisher
Nature Publishing Group
Version
Author's final manuscript
Citable link
http://hdl.handle.net/1721.1/102520
Terms of Use
Article is made available in accordance with the publisher's
policy and may be subject to US copyright law. Please refer to the
publisher's site for terms of use.
A Circuit Mechanism for Differentiating Positive and Negative
Associations
Praneeth Namburi1,2,*, Anna Beyeler1,*, Suzuko Yorozu6, Gwendolyn G. Calhoon1, Sarah A. Halbert1,5, Romy Wichmann1, Stephanie S. Holden1,3, Kim L. Mertens1,4, Melodi Anahtar1,3, Ada C. Felix-Ortiz1,2, Ian R. Wickersham7, Jesse M. Gray6, and Kay M. Tye1,8
1The Picower Institute for Learning and Memory, Department of Brain and Cognitive Sciences, Massachusetts Institute of Technology, Cambridge, MA 02139, USA 2Neuroscience Graduate Program, Massachusetts Institute of Technology, Cambridge, MA 02139, USA 3Undergraduate Program in Neuroscience, Massachusetts Institute of Technology, Cambridge, MA 02139, USA 4Master’s Program in Biomedical Sciences, University of Amsterdam, Amsterdam, The
Netherlands 5Undergraduate Program in Neuroscience, Wellesley College, Wellesley, MA 02481, USA 6Department of Genetics, Harvard Medical School, 77 Avenue Louis Pasteur, NRB 356, Boston, MA 02115, USA 7McGovern Institute for Brain Research, Massachusetts Institute of Technology, Cambridge, MA 02139, USA
Abstract
The ability to differentiate stimuli predicting positive or negative outcomes is critical for survival, and perturbations of emotional processing underlie many psychiatric disease states. Synaptic plasticity in the basolateral amygdala complex (BLA) mediates the acquisition of associative memories, both positive1,2 and negative3–7. Different populations of BLA neurons may encode fearful or rewarding associations8–10, but the identifying features of these populations and the synaptic mechanisms of differentiating positive and negative emotional valence have remained an enigma. Here, we show that BLA neurons projecting to the nucleus accumbens (NAc projectors) or the centromedial amygdala (CeM projectors) underwent opposing synaptic changes following fear or reward conditioning. We found that photostimulation of NAc projectors supports positive reinforcement while photostimulation of CeM projectors mediates negative reinforcement. Photoinhibition of CeM projectors impaired fear conditioning and enhanced reward conditioning. We then characterized these functionally-distinct neuronal populations by comparing their
Users may view, print, copy, and download text and data-mine the content in such documents, for the purposes of academic research, subject always to the full Conditions of use:http://www.nature.com/authors/editorial_policies/license.html#terms
8To Whom Correspondence Should be Addressed: Kay M. Tye, PhD, Picower Institute for Learning and Memory, Department of
Brain and Cognitive Sciences, 77 Massachusetts Ave, Bldg-Rm 46-6263, Massachusetts Institute of Technology, Cambridge, MA 01239. [email protected].
*These authors contributed equally
AUTHOR CONTRIBUTIONS
K.M.T. supervised all experiments. P.N., A.B. and K.M.T. designed the experiments. P.N., A.B., G.G.C., S.Y., R.W., S.S.H., M. A., S.A.H., and K.L.M. collected data. P.N., S.S.H., A.F-O. and K.L.M. reconstructed neurons. P.N. wrote all MATLAB scripts. S.Y. and J.G. contributed to RNA-Seq and q-PCR experiments and analyses. P.N., A.B. and G.G.C. analyzed all other data sets. I.R.W.
HHS Public Access
Author manuscript
Nature. Author manuscript; available in PMC 2015 October 30.
Published in final edited form as:
Nature. 2015 April 30; 520(7549): 675–678. doi:10.1038/nature14366.
Author Manuscript
Author Manuscript
Author Manuscript
electrophysiological, morphological and genetic features. We provide a mechanistic explanation for the representation of positive and negative associations within the amygdala.
The BLA, including lateral and basal nuclei of the amygdala11, receives sensory information from multiple modalities12–14, and encodes motivationally significant stimuli15–17. Partially non-overlapping populations of BLA neurons encode cues associated with appetitive or aversive outcomes8,9. The acquisition of the association between a neutral stimulus and an aversive outcome such as a foot shock has been shown to induce long term potentiation (LTP) of synapses onto lateral amygdala neurons3,4, mediated by postsynaptic increases in
α-amino-3-hydroxy-5-methyl-4-isoxazolepropionic acid receptor (AMPAR)-mediated
currents5,18 in a N-methyl-D-aspartate receptor (NMDAR)-dependent manner19,20. Similarly, increases in glutamatergic synaptic strength of inputs providing sensory information to BLA neurons are necessary for the formation of a stimulus-reward
association1. Yet the similarity in neural encoding and synaptic changes induced by learning a positive or negative association and the contrasting nature of the ensuing outputs (reward-seeking or fear-related behaviors) presents an ostensible paradox: How is it possible that potentiation of synapses onto neurons in the BLA can underlie learned associations that led to such different behavioral responses?
One hypothesis is that BLA neurons project to many downstream regions, including the canonical circuits for reward and fear14, and the neurons that project to different targets undergo distinct synaptic changes with positive or negative associative learning. For example, BLA projections to the NAc have been implicated in reward-related
behaviors16,21,22, while BLA projections to the CeM have been linked to the expression of conditioned fear23–25. However, the unique synaptic changes onto projection-identified BLA neurons have never been explored.
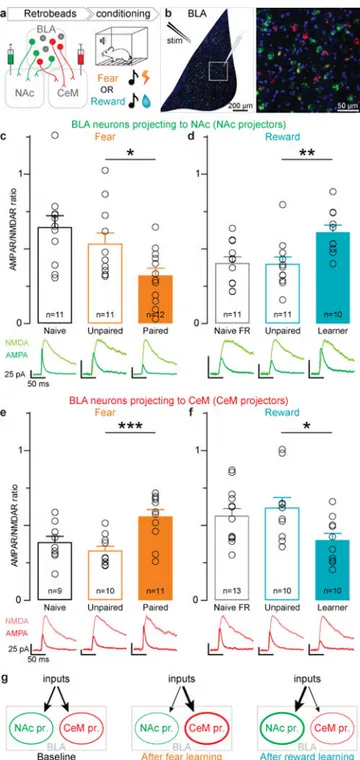
To test this, we selected the NAc and CeM as candidate target regions and examined the synaptic changes onto either NAc-projecting BLA neurons (NAc projectors) or CeM-projecting BLA neurons (CeM projectors) following fear conditioning or reward conditioning (Fig. 1). To identify the projection target of BLA neurons, we injected retrogradely-traveling fluorescent beads (retrobeads) into either the NAc or CeM to label BLA neurons sending axon terminals to these regions (Fig. 1a; Extended Data Fig. 1). After retrobead migration upstream to BLA cell bodies, we trained mice in fear or reward conditioning paradigms wherein a tone was paired with either a foot shock or sucrose delivery. Mice in reward conditioning groups were food restricted 1 day before the conditioning session to increase motivation to seek sucrose (Extended Data Fig. 1). AMPAR/NMDAR ratio, a proxy for glutamatergic synaptic strength, increases after either fear or reward conditioning in the BLA1,2,5,18. We used matched experimental parameters across groups in an acute slice preparation stimulating axons arriving via the internal capsule and performing whole-cell patch-clamp recordings in retrobead-identified NAc projectors and CeM projectors, which we observed to be topographically intermingled (Fig. 1b; Extended Data Fig. 2).
We found that in NAc projectors, fear conditioning decreased AMPAR/NMDAR ratio relative to controls exposed to the same number of tones and shocks, but where the tones
Author Manuscript
Author Manuscript
Author Manuscript
and shocks were unpaired (Fig. 1c). Conversely, following the acquisition of the association between a tone and sucrose delivery, NAc projectors showed an increase in AMPAR/ NMDAR ratio relative to unpaired controls that were also food restricted and received the same number of tones and volume of sucrose (Fig. 1d). Importantly, we also included naïve and food restricted naïve groups (Fig. 1 c–f) as food restriction itself could alter AMPAR/ NMDAR ratio (Extended Data Fig. 3).
In contrast, CeM projectors from the paired group showed an increase in AMPAR/NMDAR ratio following fear conditioning, relative to unpaired controls (Fig. 1e). Following reward conditioning, CeM projectors from mice that learned the tone-sucrose association showed a decrease in AMPAR/NMDAR ratio relative to unpaired controls (Fig. 1f). In addition to AMPAR/NMDAR ratios, we also examined paired-pulse ratio, and did not detect any differences between groups (Extended Data Fig. 3), suggesting a postsynaptic mechanism of plasticity.
These results support a model wherein NAc and CeM projectors undergo opposing changes in synaptic strength following fear and reward learning, such that relative synaptic strengths onto CeM projectors increase following fear conditioning and decrease following reward learning. Conversely, relative synaptic strengths onto NAc projectors decrease following fear conditioning and increase following reward learning (Fig. 1g). However, these findings raised several new questions. First, is there a causal relationship between the activity of BLA neurons projecting to the NAc and reward-related behaviors, and between the activity of CeM projectors and fearful or aversive behaviors? Second, what defining features of NAc and CeM projectors might endow them with their opposing functions?
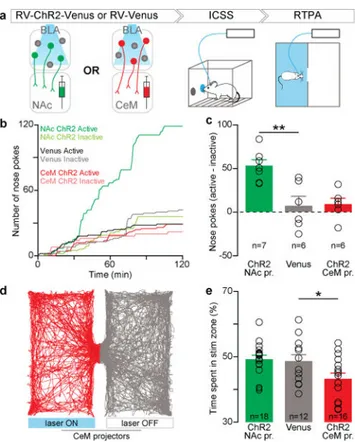
To test whether there was a causal relationship between populations of projection-identified BLA neurons on behavior, we first used a retrogradely-infectious rabies viral (RV) vector26 to express channelrhodopsin-2 (ChR2) fused to a fluorescent reporter (Venus), or a control virus carrying Venus alone (RV-Venus) in BLA neurons projecting to either the NAc or the CeM (Fig. 2a).
Following verification of functional ChR2 expression and retrograde transport from either the NAc or CeM back to the BLA (Extended Data Fig. 7), we tested animals receiving injections of RV-ChR2-Venus or RV-Venus into either the NAc or CeM and implantation of an optical fiber over the BLA on an intracranial self-stimulation (ICSS) task (Extended Data Fig. 4). Consistent with previous reports that photostimulation of BLA axons in the NAc produced ICSS21, we observed ICSS upon photostimulation of BLA cell bodies projecting to NAc (Fig. 2b,c). Given that we could not elicit robust nose poke responses for CeM projector photostimulation, we next tested CeM projectors in a real-time place aversion assay (RTPA), where an animal freely-explored two chambers, one in which the mouse received photostimulation of CeM projectors. Photostimulation of CeM projectors caused robust avoidance of the light-paired side (Fig. 2d,e). Consistent with our data and previous studies, we demonstrated a causal relationship between NAc projectors and positive reinforcement and CeM projectors and negative reinforcement (avoidance).
Author Manuscript
Author Manuscript
Author Manuscript
We went on to probe the necessity of NAc or CeM projectors in mediating reward or fear conditioning. The acquisition of fear19 and reward1 associations are mediated by an
NMDAR-dependent LTP mechanism thought to require simultaneous glutamate release and postsynaptic depolarization. Thus, we tested whether projection-specific hyperpolarization during the US presentation could impair learning in a valence-specific manner.
To this end, we bilaterally infused an adeno-associated viral vector (AAV5) carrying halorhodopsin (NpHR) fused to an enhanced yellow fluorescent protein (eYFP), or a no-opsin control (eYFP), in a cre-dependent manner (double-floxed inverted open reading frame; DIO) into the BLA (Extended Data Fig. 5). We then bilaterally infused a
retrogradely-traveling canine adenovirus (CAV) carrying cre-recombinase into either the NAc or CeM (Fig. 3a). We illuminated the BLA with yellow light only during the unconditioned stimulus (US), i.e. during shock or sucrose consumption. Indeed,
photoinhibition of CeM projectors during the US impaired conditioned freezing (Fig. 3b, Extended Data Fig. 6) and enhanced conditioned reward-seeking (Fig. 3c).
Next, because there was no topographical separation between NAc and CeM projectors (Fig. 1b), which are both glutamatergic11,21,27,28, we searched for distinguishing characteristics of these functionally-distinct neuronal populations. As the BLA is known to have some heterogeneity in electrophysiological and morphological characteristics11,29, we compared these features between NAc and CeM projectors. While we did not observe differences in action potential half-width (Fig. 4a,b), threshold to spike (Fig. 4c,d), nor intrinsic
excitability (Fig. 4e,f), we did observe a significant difference in action potential accommodation (Fig. 4g and Extended Data Fig. 7). To investigate the morphological features of these functionally-distinct populations, we reconstructed projection-identified BLA neurons. We observed greater distal dendritic branching in CeM projectors (Fig. 4h,i), though NAc projectors and CeM projectors contained both pyramidal and stellate cells (Fig. 4i inset; Extended Data Fig. 8).
Finally, we compared the transcriptomes of BLA neurons projecting to the NAc or CeM (Fig. 4j; Extended Data Fig. 9). Following retrobead injections into the NAc or CeM, we dissociated labeled neurons and performed RNA-Seq (Fig. 4j). RNA-Seq revealed relatively few candidate genes expressed differentially between NAc and CeM projectors, consistent with the idea that these two populations are closely related (Fig. 4k; Extended Data Fig. 9). However, these differentially expressed candidate genes may underpin the mechanisms that contribute to the wiring of these distinct populations through development and/or rapidly biasing gain modulation of synaptic transmission during valence-specific learning. Taken together, NAc and CeM projectors are populations of BLA neurons that undergo opposing synaptic changes following fear or reward conditioning, optogenetic manipulation of NAc and CeM projectors reveal causal relationships with valence-specific behaviors, and we identify distinguishing electrophysiological, morphological and gene expression characteristics to facilitate further investigation. Our study suggests that the indelible nature of valence-encoding observed in amygdala neurons10 is mediated by connectivity, and the topographical intermingling of these populations may serve to facilitate interaction30. In
Author Manuscript
Author Manuscript
Author Manuscript
conclusion, the BLA is a site of divergence for circuits mediating positive and negative emotional or motivational valence.
METHODS
Animals and Stereotaxic Surgery
Adult wild-type male C57BL/6 mice (109 mice), aged 6–12 weeks (8.3 ± 1.5 weeks; Jackson Laboratory, Bar Harbor, ME, or Charles River Laboratories, Wilmington, MA for RNA-Seq) were used for experiments. Following surgery, animals were maintained with a reverse 12 hours light/dark cycle with ad libitum food and water. All procedures of handling animals were in accordance with the guidelines from NIH, and with approval of the MIT Institutional Animal Care and Use Committee. All surgeries were conducted under aseptic conditions using a digital small animal stereotaxic instrument (David Kopf Instruments, Tujunga, CA).
Mice were anaesthetized with isoflurane (5 % for induction, 1.5–2.0 % afterward) in the stereotaxic frame for the entire surgery and their body temperature was maintained with a heating pad. In order to label basolateral amygdala (BLA) neurons projecting to the nucleus accumbens (NAc), about 70 nl of red or green retrobeads (RetroBeads™, Lumafluor Inc.) were injected into NAc at stereotaxic coordinates from bregma: +1.4 mm anteroposterior (AP), ±0.87 mm mediolateral (ML) and −4.7 mm dorsoventral (DV). In order to label BLA neurons projecting to the medial part of the central amygdala (CeM), 50 nL of retrobeads (different color from NAc injection) was injected in the contralateral CeM (−0.75 mm AP, ±2.35 mm ML and −5.08 mm DV). To test the causal role of BLA neurons projecting to NAc (NAC pr.) or to CeM (CeM pr.) in reward and aversive behaviors, we injected a retrogradely travelling rabies virus carrying channelrhodopsin2-Venus fusion protein (RV-4ChopV(B19G)) or Venus31,32 (Fig. 2, Extended Data Fig. 4) into NAc (250 nl) or CeM (180 nl). These virus constructs are referred as RV-ChR2-Venus and RV-Venus in the manuscript. All animals receiving fluorophore control injection were pooled into one control group. Injections were performed using glass micropipettes (1–5 μl; Drummond Scientific, Broomall, PA) pulled with a puller (Narishige PC-10, East Meadow, NY) mounted on 10 μL microsyringe (Hamilton Microliter 701, Hamilton co., Reno, NV) to deliver the retrobeads at the rate of 2 nL/s or virus at a rate of 0.5 to 1 nL/s, using a microsyringe pump (UMP3; WPI, Sarasota, FL) and controller (Micro4; WPI, Sarasota, FL). After completion of the injection, the pipette was raised 100 μm and left for an additional 10 minutes to allow diffusion of the retrobeads or the virus at the injection site and then slowly withdrawn. In a separate group of experiments (Fig. 3), adeno-associated virus serotype 5 (AAV5) carrying halorhodopsin 3.0 fused to eYFP in a double-floxed open inverted reading frame under the control of EF1α promoter (AAV5-EF1α-DIO-eNpHR3.0-eYFP) or a
corresponding fluorophore control (AAV5-EF1α-DIO-eYFP) was injected bilaterally into the BLA (400 nl in each hemisphere) at stereotaxic coordinates from bregma: −1.60 mm AP, ±3.35 mm ML and −4.90 mm DV. Concurrently, canine adenovirus 2 (CAV2) carrying cre-recombinase (or a mixture of CAV2-cre and herpes simplex virus carrying cre cre-recombinase and the fluorescent reporter mCherry under the control of EF1α promoter) was injected into the NAc (300 nl in each hemisphere) or CeM (150 nl in each hemisphere) at the same
Author Manuscript
Author Manuscript
Author Manuscript
coordinates described above. We summarize this strategy with the designation “cre-DIO.” All animals receiving fluorophore control injection were pooled into one control group. In order to deliver light to the BLA, a 300 μm optic fiber (0.37 numerical aperture, NA) glued to a 1.25 mm ferrule was implanted above the BLA (−1.64 mm AP, ±3.35 mm ML and −4.25 mm DV). One layer of adhesive cement (C&B metabond; Parkell, Edgewood, NY) followed by cranioplastic cement (Dental cement; Stoelting, Wood Dale, IL) was used to secure the fiber ferrule to the skull and 20 min later, the incision was sutured. Blue light (20 mW) was delivered using a 473 nm laser and yellow light (10 mW) was delivered using a 589/593 nm laser.
After injections and implants, the skin incision was sutured. After surgery, body temperature was maintained using a heat lamp until the animal fully recovered from anesthesia.
Behavioral experiments followed by ex vivo electrophysiological recordings were conducted approximately two weeks following surgery. Behavioral experiments requiring expression via rabies virus were conducted 4–5 days after surgery (Fig. 2). Behavioral experiments requiring viral expression via the Cre-DIO strategy were conducted 3 months after surgery (Fig. 3).
Pavlovian conditioning
Fear conditioning—The mice were conditioned using behavioral hardware boxes (MedAssociate, St Albans, VT) placed in custom made sound attenuating chambers. Each box contained a modular test cage with an electrifiable floor grid and a speaker. On the day of conditioning, all animals were exposed to two sessions of 30 minutes separated by 20 minutes in the home cage (Extended Data Fig. 1e). During the first session, mice in the unpaired group received 6 tone presentations, while mice in the paired group received no cues. During the second session, mice of the unpaired group received 6 foot shocks whereas mice of the paired group received 6 tones, each co-terminating with a shock (paired fear). During each session, a period of acclimation lasting 200 s preceded the presentation of the first tone or foot shock. The CS consisted of a 2 kHz, 80 dB pure tone lasting 20 s. The US consisted of scrambled 1.5 mA foot shock lasting 2 s. During paired conditioning, CS and US were co-terminating. Cue presentations were separated by 70 to 130 s. Following conditioning, mice were returned to their home cages for ~24 hours until preparation of brain slices (Extended Data Fig. 1e). Video of the mice were acquired during the second session for the paired group and both sessions for the unpaired group, to allow freezing quantification during the tone (an infrared LED was switched on during the period of the tone).
Measurement of fear behavior—Percentage time freezing during CS presentation (Extended Data Fig. 1f) was quantified by manual scoring with the help of custom written software in MATLAB. For each of the 6 trials, a segment of the video containing 20 s of the tone and the 20 s preceding the tone was extracted frame by frame and exported into MATLAB. Two additional segments of the same duration were extracted starting at randomly chosen points in the video. The sequence of these 8 trials was then randomized and presented to a human scorer who was blind to the trial number. The scores were then
re-Author Manuscript
Author Manuscript
Author Manuscript
assembled and the percentage of freezing during the CS was calculated. Frame numbers of the video containing the tone were confirmed by generating a heat map of the intensity of the pixels containing the infrared LED.
Reward conditioning—Twenty hours after food restriction, the mice were conditioned in sound-proof boxes (MedAssociates, St Albans, VT). Each box contained a modular test cage assembled with a sucrose delivery port, a speaker and a house light placed under the sucrose port. The CS consisted of a compound light-tone cue, ended by a beam break, 400 ms after port entry detection. If the mouse did not enter the port, the tone lasted for 30 s. The tone was a 5 kHz, 80 dB pure tone. For the paired group, a small volume (15 μL) of a sucrose solution (30 %) was delivered into the port 1 s after CS onset, only if the mouse had entered the port after the onset of the previous CS, to prevent sucrose accumulation. For the unpaired group, no sucrose was delivered to the port. The inter-trial interval (ITI) of the CS presentations was chosen randomly from a list at runtime and was 143 ± 40 s for the first 20 CS presentations and 108 ± 32 s for the 100 subsequent CS presentations. The conditioning session was terminated after 120 sucrose deliveries and lasted for about 4 hours.
Performance of the mouse was assessed during the second half of a conditioning session. After the training session, the unpaired mice received the same amount of sucrose as the paired mouse (in their home cage 15 μL*120 = 1.8 mL, Extended Data Fig. 1e). In the paired group, if the mice did not claim all the sucrose, the remaining volume was made available to the mouse in its home cage after the conditioning session. After 20 minutes in their home cages, all the animals had ad libitum food until the electrophysiology experiment. Learning Criterion for reward learning—A mouse was considered to have acquired the task (and classified as a Learner) if the number of port entries from +1 s to +8 s relative to CS onset (black line, Extended Data Fig. 1g) was significantly higher than the number of port entries from −1 s to −8 s relative to CS onset (grey line, Extended Data Fig. 1g). Statistical significance was tested using a one-sided Wilcoxon rank-sum test (MATLAB) and the threshold for learning was set at P < 0.001.
Conditioning for photoinhibition experiments—In these experiments, the same animals experienced reward conditioning followed by fear conditioning after 1–4 weeks. Pure tones of 2 and 10 kHz were used as conditioning stimuli in these two paradigms; the use of these two tones was counterbalanced across animals. Animals were tethered using a dual commutator for light delivery. During fear conditioning, yellow light was delivered from one second before shock onset until one second after shock termination (shock intensity = 0.5 mA). During reward learning, yellow light was delivered for 7.5 seconds immediately following a port entry during CS (tone) presentation.
Ex vivo electrophysiology
Brain tissue preparation—About two weeks after retrobead injections in NAc and CeM, 79 mice were anesthetized with 90 mg/kg pentobarbital sodium and perfused transcardially with 10 mL of modified artificial cerebrospinal fluid (ACSF) at ~4°C saturated with 95% O2 and 5% CO2, containing (in mM): 75 sucrose, 87 NaCl, 2.5 KCl, 1.3 NaH2PO4, 7 MgCl2, 0.5 CaCl2, 25 NaHCO3 and 5 ascorbic acid (pH 7.25–7.4, 327 ± 3 mOsm). The brain was
Author Manuscript
Author Manuscript
Author Manuscript
then extracted and glued (Roti coll 1; Carh Roth GmbH, Karlsruhe, Germany) on the platform of a semiautomatic vibrating blade microtome (VT1200; Leica, Buffalo Grove, IL). The platform was then placed in the slicing chamber containing modified ACSF at 4°C. Coronal sections of 300 μm containing the NAc, CeM, or BLA were collected in a holding chamber filled with ACSF saturated with 95% O2 and 5% CO2, containing (in mM): 126 NaCl, 2.5 KCl, 1.25 NaH2PO4, 1.0 MgCl2, 2.4 CaCl2, 26.0 NaHCO3, 10 glucose (pH 7.25–7.4, 298 ± 2 mOsm). Recordings were started 1 h after slicing and the temperature was maintained at approximately 31°C both in the holding chamber and during the recordings. All retrobead injection sites were checked and imaged with a camera (Hamatsu,
Bridgewater, NJ) attached to the microscope (BX51; Olympus, Center Valley, PA, Extended Data Fig 1). The slice images were reported on the mouse brain atlas (Paxinos and Watson) and the center of the injection was taken at the brightest point of the fluorescence. Part of the retrobead injections had dorsoventral leaks. In this case, the center of the injection was taken on the brightest fluorescent point in the target structure (Extended Data Fig. 1). If the injection site was outside NAc or CeM, respective projectors of this injection were not recorded in the BLA. In addition, all the CeM injections were overlaid on the mouse atlas. CeM projector recordings collected from animals with injection sites that had leaks into CeC and/or CeL were discarded.
Whole-cell patch-clamp recording—Recordings were made from visually identified neurons containing retrobeads. Patched cells were filled with Alexa Fluor (AF) 350 and biocytin, visualized and superimposed with retrobead fluorescence to confirm whether the patched cell was retrobead positive.
For AMPAR/NMDAR ratio, brain slices containing the BLA were then placed in the recording chamber perfused with ACSF containing 100 μM of the ɣ-aminobutyric receptor A (GABAAR) antagonist picrotoxin (R&D systems, Minneapolis, MN). Picrotoxin was not used to assay passive membrane properties from NAc and CeM projecting BLA neurons. A bipolar stimulating electrode (~80 μm spacing between tips) was placed in the amygdala-striatal transition zone containing internal capsule fibers (Extended Data Fig. 2). Electric stimulation intensity was between 0.01 and 0.2 mA. For electrophysiological
characterization of NAc and CeM projectors (Fig. 3a–g) and confirmation of the health of rabies virus transduced cells (Extended Data Fig. 7), picrotoxin was not added to the ACSF. Voltage-clamp recordings were made using glass microelectrodes (4–6 MΩ) shaped with a horizontal puller (P-1000, Sutter, CA) and filled with a solution containing (in mM): 120 cesium methansulphonate, 20 HEPES, 0.4 EGTA, 2.8 NaCl, 5 tetraethylammonium chloride, 2.5 MgATP, 0.25 NaGTP, 8 biocytin and 2 Alexa Fluor 350 (pH 7.3, 283 mOsm). The cells were first clamped at −70mV to determine optimal intensity for the electric stimulation of the internal capsule. Current-clamp recordings to characterize
electrophysiological properties of NAc and CeM projectors we made using similar glass microelectrodes (4–6 MΩ) filled with a solution containing (in mM): 125 potassium gluconate, 20 HEPES, 10 NaCl, 3 MgATP, 8 biocytin and 2 Alexa Fluor 350 (pH 7.3; 283 mOsm).
Author Manuscript
Author Manuscript
Author Manuscript
Recorded signals were amplified using Multiclamp 700B amplifier (Molecular Devices, Sunnyvale, CA). Analog signals were digitized at 10 kHz using a Digidata 1440 and pClamp9 software (Molecular Devices, Sunnyvale, CA). ACSF and drugs were applied to the slice via a peristaltic pump (Minipuls3; Gilson, Middleton, WI) at 3 mL/min.
All recordings were performed blind to the performance of the animal, and a subset of the data were obtained blind to the behavioral conditioning group of the animal. We recorded the position of the cells within the BLA (Extended Data Fig. 2) and the placement of the stimulating electrode relative to the BLA. There was no observable difference in either of these parameters across slices obtained from animals in different behavioral conditioning groups.
In order to obtain the AMPAR/NMDAR ratio, the cell was first voltage clamped at +40 mV. Once we obtained a stable baseline EPSC amplitude in response to internal capsule fiber stimulation (compound AMPAR+NMDAR current), we bath applied the NMDAR antagonist AP5 (D-(−)-2amino-5-phosphonopentanoate, R&D systems, Minneapolis, MN) at a concentration of 50 μM. AMPAR EPSCs were recorded starting from 5 minutes after the action of AP5. NMDAR current was obtained by subtracting the average EPSC trace of the AMPAR current from the compound current. Each group in Fig. 1 included 9–13 neurons recorded from 6–9 mice.
Histology—The location of all recorded neurons was checked after the recording. Co-localization of AF 350 and retrobeads was confirmed at the end of the recording, and double-checked with confocal microscopy for the cells that were recovered with streptavidin staining. For each experiment, the slices containing a retrobead injection site (NAc and CeM) or a recorded neuron (BLA) were fixed overnight at 4°C in 4 % PFA, and then kept in PBS. Slices containing patched neurons were incubated for 2 hours in streptavidin-CF405 (2 mg/ml, dilution 1:500, Biotum, Hayward, CA), mounted on microscope slides with PVA-DABCO and imaged under the confocal microscope (Extended Data Fig. 3).
Data analysis—Off-line analysis of AMPAR/NMDAR ratios, paired pulsed ratios and electric properties was performed using Clampfit (Molecular Devices) and MATLAB software written by P.N. Membrane properties including access resistance of the cell was computed by a MATLAB implementation of the Q-method33. All custom written software is available upon request.
In vivo optogenetic behavior
Light delivery—For optical stimulation during behavioral assays (Fig. 2), a 473 nm (blue light) or 589/593 nm laser (yellow light) (OEM Laser Systems, Draper, UT) was connected to a patch cord with a pair of FC/PC connectors in each end (Doric, Québec, Canada). This patch cord was connected through a fiber-optic rotary joint (which allows free rotation of the fiber; Doric, Québec, Canada) with another patch cord with an FC/PC connector on one side and a ferrule connection on the other side (matching the size of the ferrule glued to the optic fiber implanted in the mouse). The optic fiber implanted in the mouse (300 μm diameter, 0.37 NA) was connected to the optic patch cord using ceramic mating sleeves (PFP,
Milpitas, CA). Blue light was delivered at 20 mW (~46.5 mW/mm2 at 0.5 mm from the fiber
Author Manuscript
Author Manuscript
Author Manuscript
tip) in 20 Hz, 5 ms light pulses. Yellow light was delivered at 10 mW, for 4 s during fear conditioning and 7.5 s during reward conditioning. Laser output was modulated with a Master 8 pulse stimulator (A.M.P.I., Jerusalem, Israel). Onset of laser pulses was determined by behavioral hardware (MedPC Associates, St Albans, VT).
Intracranial optical self-stimulation—4.5 d after surgery, mice were food-restricted overnight. Immediately before the start of each session, fiber optic implants were connected to a patch cord and the mouse was placed in conditioning chambers equipped with active and inactive nose-poke ports directly below two cue lights, as well as auditory stimulus generators and video cameras. Mice were given 2 self-stimulation sessions on 2 consecutive days (5.5 and 6.5 d after surgery) in which they could respond freely at either nose-poke port. On day 1 both nose-poke ports were baited with a crushed cereal treat to facilitate initial investigation. The start of each 2 h session was indicated by the illumination of both nose-poke ports and the onset of low-volume white noise to mask unrelated sounds. Each nose poke in the active port resulted in light stimulation of BLA projectors (60 pulses, 20 Hz, 5 ms pulse duration). Concurrently, the cue-light above the respective port was illuminated and a distinct one second tone was played for each nose poke (1 kHz and 1.5 kHz counterbalanced), providing a visual and auditory cue whenever a nose poke occurred. Active and inactive nose poke time stamps were recorded using Med-PC software and day 2 data were analyzed using MATLAB and Microsoft Excel.
Real time place aversion (RTPA)—The RTPA chamber was custom made of transparent plastic (50 × 53 cm) and divided into 2 equal compartments. One of them was assigned as the stimulated side (the side was counterbalanced between animals). At the start of the 1 h session, individual mice were placed in the non-stimulated side of the chamber. Every time the mouse crossed to the stimulated side of the chamber, 20 Hz (20 mW at the tip of the fiber, 5 ms pulse duration) laser stimulation was delivered until the mouse crossed back into the non stimulated side. Ethovision XT video tracking software (Noldus
Information Technologies, Wageningen, The Netherlands) was used to track the animal and control the onset and offset of light pulse trains. Data were subsequently analysed using MATLAB and Microsoft Excel software.
Histology—After optogenetic experiments, all mice were anesthetized with pentobarbital sodium, and transcardially perfused with ice-cold ringer’s solution followed by ice-cold 4% paraformaldehyde (PFA) in PBS (pH 7.3). Extracted brains were fixed in 4% PFA overnight and then equilibrated in 30% sucrose in PBS. 40 μm thick coronal sections were sliced using a sliding microtome (HM430; Thermo Fisher Scientific, Waltham, MA) and stored in PBS at 4°C until they were processed for histology. Sections were then incubated with a DNA specific fluorescent probe (DAPI: 4′,6-Diamidino-2-Phenylindole (1:50,000)) for 30 minutes and lastly washed with PBS-1X followed by mounting on microscope slides with PVA-DABCO.
Imaging
Confocal fluorescence images were acquired on an Olympus FV1000 confocal laser scanning microscope using a 10x/0.40NA for viral injections and fiber placements imaging
Author Manuscript
Author Manuscript
Author Manuscript
or a 40x/1.30NA or 60x/1.42NA oil immersion objectives for imaging streptavidin-CF405 stained neurons. Serial Z-stack images were acquired using the FluoView software (Olympus, Center Valley, PA) to confirm viral injections and fiber placements. The center of the viral injection was taken at the brightest fluorescent point in AP, ML, and DV axis. The tip of the fiber was determined by the ~50 μm thick gliosis generated by the fiber. Neurons recovered from the Streptavidin staining (~60% recorded in whole-cell) were imaged covering the whole dendritic and axonal arborization contained in the slice.
Neuron reconstructions—Imaris software (Bitplane Inc., South Windsor, CT) was used to reconstruct neurons from z-stacks of confocal images and perform Sholl analysis34. Since we are performing reconstructions on neurons filled by patching, we chose to focus solely on dendritic branching patterns and did not examine parameters such as the volume of the soma since this measure might be compromised by experimental procedures. Overlaying the atlas on pictures of brain slices revealed that the distances depicted in the atlas are about 90% smaller than physical distances in brain slices. For example, if the length of brain region X is 900 μm in the atlas, then the real distance measured in our brain sections was about 1000 μm. Therefore, to depict the reconstructed neurons (Fig. 4h,i; Extended Data Fig. 8), we multiplied physical distances by a factor of 0.9.
RNA sequencing (RNA-Seq)
Manual cell sorting and RNA sequencing—Manual sorting of fluorescent cells were carried out as described in Hempel et al35. Briefly, adult C57BL6 male mice (~ 8 weeks old C57BL/6NCrl for experiment-1, and ~8–10 weeks old C57BL/6J for experiment-2), which had been injected with fluorescently labeled retrograde beads into either NAc or CeM (~6 weeks at surgery) were decapitated under isoflurane anesthesia and their brain was quickly removed and transferred into the ice-cold oxygenated ACSF, containing 126 mM NaCl, 20 mM NaHCO3, 20 mM dextrose, 3 mM KCl, 1.25 mM NaH2PO4, 2 mM CaCl2, 2 mM MgCl2, 50 mM APV, 20 mM DNQX, 100 nM TTX. Acute 330 μm coronal brain slices were prepared and incubated in a protease (1.2 mg/mL protease E, Sigma-Aldrich) containing oxygenated ACSF for 50 min. After 15 min of washes in the ACSF, BLA tissue was microdissected using a pair of fine scissors under a fluorescent dissecting microscope (Leica M165FC stereomicroscope). The dissected BLA tissue was then triturated in ACSF using a series of three Pasteur pipettes of decreasing tip diameters and the dissociated cells were transferred into a small petridish. With visual control under a fluorescent dissecting
microscope, red retrobeads-positive neurons were aspirated into a micropipette with a 30–50 μm tip diameter and transferred into a clean petridish. A total of 35–60 retrobead-positive neurons were pooled for each sample, which were immediately lysed in 50 μl of extraction buffer (PicoPure RNA isolation kit, Arcturus, Life Technologies) and total mRNA was subsequently isolated. cDNA was synthesized using Ovation RNA-Seq System V2 kit (Neugen). We obtained approximately 6μg of cDNA from 35–60 cells from each group. Then, the cDNA library was prepared using Ovation Ultralow DRMultiplex Systems (Nugen). Sequencing was conducted on an Illumina HiSeq2500 using single end 50 base pairs at the Biopolymer facility, Harvard Medical School (for experiment-1), and an illumina NextSeq 500 using single end 75 base pairs with high flow cell size at the FAS center for systems biology, Harvard University (for experiment-2). The total number of
Author Manuscript
Author Manuscript
Author Manuscript
reads that we obtained for each sample were approximately 34 million (for experiment-1) and 50 million (for experiment-2).
Analysis of RNA-seq data—Sequencing reads were mapped using Tophat version 2.0.10 (http://tophat.cbcb.umd.edu) against the Mus musculus UCSC version mm10 genome. After alignment, the read counts for each gene were extracted using HTseq ( http://www-huber.embl.de/users/anders/HTSeq/doc/overview.html) based on the mm10 Refseq gff file. Log2 fold differences were computed from each of two independent experiments using DEseq2. Candidate differentially expressed genes were required to be enriched in CeM or NAc projectors at a quantile fold-difference threshold of 0.01 (Fig. 4) or 0.02 (Extended Data Fig. 9) in each of two independent experiments (n=8, NAc; n=9, CeM total). To estimate false discovery rate (Extended Data Figure 9), we used two types of chance estimates. One of the chance estimates, “flip-flopped”, is taken from genes that passed the quantile thresholds but were enriched in opposite populations in the two experiments. Another chance estimate, “permuted”, is determined based on permuting fold differences across genes within each independent experiment (Extended Data Fig. 9). We estimated false discovery rate using the more conservative chance estimate, “flip-flopped” with the following formula: (number of genes on the “flip-flopped” list /number of genes on the differentially expressed genes). To view RNA-Seq data, our GEO accession number is GSE66345 and is accessible via http://www.ncbi.nlm.nih.gov/geo/query/acc.cgi? acc=GSE66345.
Statistical analysis
Statistical analyses were performed using commercial software (GraphPad Prism; GraphPad Software, Inc, La Jolla, CA). Within-subject comparisons were made using paired tests. Group differences were detected using either one-way analysis of variance (ANOVAs) or with two-way ANOVAs, both followed by Bonferroni post-hoc tests. Corrections for multiple comparisons were made when appropriate. Since normality tests have little power to detect non-gaussian distributions with small data sets, we did not explicitly test for the normality of our data sets. We used the Grubbs’ test to detect and remove outliers from our data. Single-variable differences were detected with two-tailed paired or unpaired (as noted) Student t-test. For all results, significance threshold was placed at α = 0.05 (represented by
*, P<0.01 = **, P<0.001 = ***), and corrections for multiple comparisons were reflected in the P-value rather than in the α. All data are shown as mean ± standard error to the mean (s.e.m.). To assess learning during reward task, we used a one-sided Wilcoxon rank-sum test (MATLAB) and set the threshold for learning at P < 0.001. Result sheets of statistical tests from GraphPad software detailing (wherever applicable) estimates of variance within each group, confidence intervals, effectiveness of pairing (in case of paired t-tests), comparison of variances across groups, etc. are available on request.
Sample size
Target number of samples in each group were determined based on numbers reported in published studies. In the photoinhibition experiment, since the viral incubation time was long, we factored in the skill of the surgeon to determine the number of surgeries to be performed. Our target number of animals in each group was 12. The experimenter
Author Manuscript
Author Manuscript
Author Manuscript
performing surgeries was known to hit the targets used (NAc, CeM, BLA) with a probability of 0.9. Since there were 6 targets in each brain (3 in each hemisphere – 2 injections and one optical fiber), the probability of a successful surgery would be approximately (0.9)6 ~ 0.5. We therefore performed about 24 surgeries in each group. All sample sizes mentioned in figures represent biological replicates. All animals receiving fluorophore control injection were pooled into one control group (Fig. 2 and Fig. 3). In the Venus group from Fig. 2c, there were 6 animals each with injections in NAc and CeM. In the Venus group from Fig. 2d, there were 4 animals with injection in NAc and 2 animals with injection in CeM. In the eYFP group from Fig. 3b, there were 10 animals with injections in NAc and 6 animals with injections in CeM. In the eYFP group from Fig. 3d, there were 9 animals with injections in NAc and 5 animals with injections in CeM.
Replication
Results from AMPAR/NMDAR ratio experiments were replicated once with a different experimenter and the final numbers reported in the paper are pooled across both repetitions of the experiment (Fig. 1). Photostimulation and photoinhibition experiments (Fig. 2, 3) were not replicated. The RNA-Seq experiment was also replicated once (Fig. 4). Randomization
All surgical and behavioral manipulations performed on each animal were determined randomly. All randomization was performed by an experimenter, and no explicit randomization algorithm was used. For animals used in photostimulation and
photoinhibition experiments, the virus used in each animal (ChR2/Venus or NpHR/eYFP) and injection site (NAc/CeM) were determined randomly and the stereotaxic apparatus used for surgery was counterbalanced across groups. For surgeries with unilateral injections and/or fiber placements, the hemisphere used for injections was determined randomly during the time of the surgery. Surgeries were performed on animals caged in groups of 4 or 5 animals. Animals from each cage were allocated to at least two behavioral groups. All animals used in ex vivo electrophysiology experiments were isolated at least one day prior to behavioral conditioning.
Exclusion criteria
Ex-vivo electrophysiology—Data were excluded based on pre-determined histological and electrophysiological criteria, established during pilot experiments. The injection site was determined as the most ventral point where fluorescence was brightest, and data from cells where the corresponding retrobead injection was outside the target region (NAc or CeM) were excluded (Extended Data Fig. 1a–d). Each recorded cell was confirmed to be a projector by overlaying the fluorescence from retrobeads with the fluorescence from Alexa Fluor dye contained in the pipette. Each cell was also confirmed to be in the BLA by visualizing with DIC microscopy under a 4x objective. We did a secondary confirmation under the confocal microscope for cells that were recovered from streptavidin staining. Cells in which evoked responses were polysynaptic (multiple peaks in the evoked current) were discarded. Data from cells whose access resistance was greater than 40 MOhm or cells that died during recording were also excluded.
Author Manuscript
Author Manuscript
Author Manuscript
Animals used in photostimulation and photoinhibition experiments—Data from animals used in photostimulation and photoinhibition experiments (Fig. 2, 3) were excluded based on histological and performance criteria established during pilot experiments.
Histological criteria included injection sites and optical fiber placement (Extended Data Fig. 4, 5). Only animals with injection sites in the region of interest (NAc or CeM) were
included. For animals with RV injection in CeM, atlas outlines were overlaid manually over a confocal image of the BLA containing the damage caused by the tip of the optic fiber. Light cones based on numerical aperture of the optic fiber (NA 0.37, ~15 degree half angle) were then drawn below the optic fiber and animals in which light cones encompassed central amygdala were excluded from further analysis. For the optical self-stimulation experiment, data from animals that did not respond at least 40 times (sum of nose pokes in active and inactive ports) over the two hour period were excluded from further analysis. For
photoinhibition experiments, the amount of expression in each hemisphere of the BLA was rated on a scale of 0-5 based on fluorescence intensity by an experimenter blind to the behavioral performance of the animal. These ratings were gathered in an excel sheet, read by a MATLAB script and only data from animals with fluorescence ratings greater than 4 in each hemisphere were included for further analysis.
Author Manuscript
Author Manuscript
Author Manuscript
Extended Data
Extended Data Figure 1. Histological verification of retrobead injection sites and behavioral quantification of fear and reward conditioning for mice used in Figure 1
a, Representative differential interference contrast (DIC) image of a 300 μm thick coronal
slice containing the center of the retrobead injection in NAc. The white circle is over the most ventral point at which fluorescence is brightest and corresponds to the filled green circle in (b). b, Location of all retrobead injection sites (green circles) in the NAc for all mice used in Fig. 1. Each atlas schematic represents 1.5 mm × 1.5 mm region of the atlas and the corresponding antero-posterior (AP) stereotaxic coordinate relative to Bregma is
Author Manuscript
Author Manuscript
Author Manuscript
indicated below c, Representative DIC image of a 300 μm thick coronal slice containing the center of the retrobead injection in CeM.d, Retrobead injection sites in CeM (red circles) for all mice used in Fig. 1. e, Experimental design for AMPAR/NMDAR ratios from Figure 1. Either red or green retrobeads were injected in the NAc and the other color in the
contralateral CeM. Two weeks after injection, the retrobeads had travelled back to the cell bodies of the BLA neurons projecting NAc and CeM. Animals were conditioned one day prior to ex-vivo whole cells patch clamp recordings. Each mouse received one of 6 conditioning protocols, 3 protocols categorized under Fear conditioning and 3 protocols categorized under Reward conditioning. Fear conditioning protocols: (i) Naïve: Animals were naïve to the operant chamber. (ii) Unpaired: Animals were exposed to the conditioning chamber in 2 sessions. Animals received 6 tones in the first session and they received 6 foot shocks in the second session. Animals were returned to their home cage for 20 minutes between the two sessions. (iii) Paired: Animals were exposed to operant chamber in two sessions. Animals did not receive any tone or shock stimuli in the first session, and received shocks co-terminating with tones in the second session. Animals were returned to their home cage for 20 minutes between the two sessions. Protocols for Unpaired and Paired fear groups were adapted from Clem and Huganir (2010)18. Reward conditioning protocols: (i) Naïve Food Restricted (FR): Animals naïve to the operant chamber were food restricted two days prior to ex vivo experiments and had free access to food for one day before ex vivo
experiments. We used this group to control for changes in synaptic strength caused by food restriction which was necessary in reward conditioning groups to expedite task acquisition, adapted from rats as in Tye et al., 2008 and 20101,2. (ii) Unpaired: Animals received tones in the operant chamber, returned to their home cage for 20 minutes after which they had free access to 1.8 mL of sucrose, followed by free access to food until ex vivo experiments. (iii) Paired: Sucrose was delivered into a port 1 s after the onset of a tone, and the tone was terminated 400 ms after the animal entered the port to claim sucrose. The tone lasted for a maximum length of 30 s. If there was sucrose in the port during the onset of a tone (indicated by the absence of a port entry after the previous tone), then no sucrose was delivered in that trial. Mice could receive up to 120 sucrose deliveries and the conditioning session lasted about 4 hours after which they had free access to food until ex vivo
experiments. Behavioral performance from the second half of the conditioning session was used to assess performance and mice that met learning criterion (see Methods) were categorized in the Learner group and the rest of the mice were categorized in the Non learner group. One day after conditioning, BLA neurons identified as either NAc or CeM projectors (retrobead positive) were recorded in whole-cell patch-clamp in ex vivo brain slices. Ex vivo data from both NAc and CeM projectors were collected from the following 7 groups: (1) Naïve, (2) Unpaired and (3) Paired after fear conditioning, (4) Naïve FR, (5) Unpaired, (6) Non learner and (7) Learner groups after reward conditioning. Data from groups (1)–(5) and (7) are shown in Fig. 1 and Extended Data Fig. 1,2,3. Data from group (6) is shown only in Extended Data Fig. 3. f, Time course of percentage freezing for the Paired fear group. Percentage freezing was estimated during the shock-predictive tone (excluding the 2 last seconds, where the foot shock was delivered). g, Average normalized histogram of port entries relative to the onset of the tone predicting sucrose delivery for mice that learned the CS-US association (Learners, n=11) and mice that did not (Non learners, n=17; see Extended Data Fig. 3). Mice in the Paired reward conditioning group were
Author Manuscript
Author Manuscript
Author Manuscript
deemed Learners if the number of port entries in the post-CS period (1 to 8 s relative to CS onset, black line) were determined as significantly higher than the number of port entries in the pre-CS period (−8 to −1 s relative to CS onset, grey line) using a one-sided Wilcoxon Rank Sum Test (P < 0.001).
Extended Data Figure 2. Location of BLA projectors recorded and analyzed for each experimental group of Figure 1
Top, Representative DIC image showing the location of the stimulation electrode around a bundle of fibers of the internal capsule and a neuron recorded in the BLA (at the tip of the
Author Manuscript
Author Manuscript
Author Manuscript
micropipette). The location of the recorded cell is indicated by an orange open circle. Scale bar reflects 200 μm. Bottom, Atlas schematics (1.5 mm × 1.5 mm) showing BLA at various antero-posterior (AP) positions relative to Bregma. Each circle represents the location of a neuron from which AMPDAR/NMDAR ratio was acquired (Figure 1). NAc projector locations are summarized in rows 1 and 2 and CeM projector locations are summarized in rows 3 and 4. Color of the circle represents the conditioning group of the animal from which AMPDAR/NMDAR ratio was acquired.
Extended Data Figure 3. Paired Pulse Ratio and AMPAR/NMDAR ratio in non-learners and food restricted naïve animals
a, Confocal image of a representative retrobead positive neuron recorded in BLA after
injection of retrobeads into NAc. This cell was recorded in an ex vivo slice, filled with biocytin and stained with streptavidin-CF405, pseudocolored white. b, In NAc projectors, the ratio of EPSC amplitude in response to paired-pulse stimulation (50 ms inter-pulse interval) of internal capsule inputs to the BLA was not related to experimental conditions of fear (one-way ANOVA, F2,44=0.5209, P=0.5978). c, Paired-pulse ratio of EPSC amplitude was not related to experimental condition of reward (one-way ANOVA, F3,61=0.5868, P=0.6261). d, AMPAR/NMDAR ratio of internal capsule inputs onto NAc projectors in mice with unpaired tone and sucrose presentations (Unpaired) and mice that did not learn the cue-reward association (Non-learner). Both groups of mice received the same amount of total sucrose. e, AMPAR/NMDAR ratio onto NAc projectors is significantly decreased by food restriction in naïve mice (unpaired t-test, t20=2.626, *P=0.0162). f, Confocal image of a representative retrobead positive neuron recorded in BLA after retrobead injection in CeM.
g, Paired-pulse ratio of EPSC amplitude onto CeM projectors is not related to experimental
conditions of fear (one-way ANOVA, F2,29=0.9040, P=0.4169). h, Paired-pulse ratio of EPSC amplitude is not related to experimental conditions of reward (one-way ANOVA, F3,41=0.9770, P=0.4129). i, AMPAR/NMDAR ratio onto CeM projectors is similar in
Author Manuscript
Author Manuscript
Author Manuscript
unpaired reward and paired reward non learner mice. j, AMPAR/NMDAR ratio of internal capsule inputs onto CeM projectors is significantly increased by food restriction in naïve mice (unpaired t-test t20=2.526, *P=0.0201).
Extended Data Figure 4. Histological verification of viral injection site and fiber placement for photostimulation experiments used in Figure 2
a, Center of the rabies virus injection in NAc for the animals tested in intra-cranial
self-stimulation (ICSS) and real time place aversion (RTPA) paradigms (Figure 2a–e). Rabies virus (RV)-ChR2-Venus injections are denoted with green circles, and RV-Venus injections
Author Manuscript
Author Manuscript
Author Manuscript
are indicated with gray squares. b, Representative confocal image of viral expression in a mouse 6 days after RV-ChR2-Venus injection in NAc. Right panel: zoom on the brightest fluorescence point (white circle), corresponding to the filled green circle in (a). c, Center of RV-ChR2-Venus (red diamonds) and RV-Venus (gray squares) injections in CeM of animals analyzed in Figure 2. d, Example of viral expression six days after RV-ChR2-Venus injection in CeM. Right panel: zoom on the brightest fluorescence point (white circle), corresponding to the filled red diamond in (c). e, Optical fiber tip placements over BLA of animals with ChR2-Venus injected in NAc (green circles), CeM (red diamonds), or RV-Venus in NAc or CeM (gray squares). Horizontal lines represent the thickness of the implanted fiber (300 μm). f, Representative confocal image showing optical fiber tip from a RV-ChR2-Venus injection in NAc, corresponding to the filled green circle in (e). Region in the white rectangle is magnified in the right panel and shows RV expressing NAc projectors.
g, Representative optic fiber placement for RV-ChR2-Venus injection in CeM,
corresponding to the filled diamond in (e). Right panel: Zoom on the BLA, containing RV expressing CeM projectors. Atlas schematic in (a), (c), and (e) represent 1.5 mm × 1.5 mm of the brain and the corresponding antero-posterior (AP) coordinates relative to Bregma are specified below. Scale bars in (b), (d), (f) and (g) correspond to 500 μm.
Author Manuscript
Author Manuscript
Author Manuscript
Extended Data Figure 5. Histological verification of viral injection site and fiber placement for photoinhibition experiments used in Figure 3
a, Center of canine adenovirus (CAV)-cre injection into bilateral NAc of mice with AAV5 -EF1α-DIO-NpHR-eYFP (green circles) or AAV5-EF1α-DIO-eYFP (gray squares) injected bilaterally into the BLA. This approach allows for selective expression of NpHR-eYFP / eYFP, in NAc projecting BLA neurons. b, Representative confocal image of the CAV-cre injection site in NAc. c, Center of CAV-cre injection into CeM from both hemispheres of mice with AAV5-EF1α-DIO-NpHR-eYFP (red diamonds) or AAV5-EF1α-DIO-eYFP (gray squares) injected bilaterally into BLA. In these animals, CeM projecting BLA neurons
Author Manuscript
Author Manuscript
Author Manuscript
express NpHR-eYFP or eYFP, respectively. d, Confocal image of a representative CeM injection and NpHR-eYFP expressing cells bodies in the BLA. e, Optical fiber tip placements over BLA from both hemispheres in animals injected with AAV5 -EF1α-DIO-NpHR-eYFP in BLA and CAV-cre in NAc (green circles) or CeM (red diamonds), or AAV5-EF1α-DIO-eYFP in BLA and CAV-cre in NAc/CeM (gray squares). Horizontal lines represent thickness of the implanted fiber (300 μm). f, Representative confocal images of optic fiber placements over BLA from both hemispheres of an animal injected with CAV-cre in NAc and AAV5-EF1α-DIO-NpHR-eYFP in BLA. Note NpHR-eYFP-expressing NAc projectors in the BLA. Each atlas diagram and confocal image in (a-f) represents an area of 1.5 mm × 1.5 mm; antero-posterior stereotaxic coordinates relative to Bregma are specified to the left of each image.
Extended Data Figure 6. Tone-evoked freezing behavior following inhibition of CeM or NAc projectors during auditory fear conditioning
a, Experimental design: Mice were trained in an auditory fear conditioning paradigm, during
which NAc or CeM projectors were selectively inhibited using a dual virus recombination approach (Figure 3). On the day following conditioning, mice were exposed to 8
presentations of the CS alone. They were tethered to a patch cable but no light was delivered. b, Time course of percentage freezing in mice expressing NpHR in NAc projectors (green circles), CeM projectors (red diamonds), or expressing eYFP in NAc or CeM projectors (gray squares) was quantified for each trial. c, There was no significant difference in freezing behavior in response to the CS among the three groups of mice on test day (1-way ANOVA, F2,38=2.010, P=0.1488).
Author Manuscript
Author Manuscript
Author Manuscript
Extended Data Figure 7. Membrane properties of retrobead positive NAc/CeM projecting BLA neurons and rabies virus expressing BLA neurons
a, Access resistance, membrane resistance, and membrane capacitance were estimated from
the current response of the cell to a 4 mV square voltage pulse using the Q-method (Novák and Zahradník, 2006). Access and membrane resistance as well as the membrane
capacitance and membrane potential were not significantly different between the 2 populations (unpaired t-tests: t20=0.788, P=0.4400; t20=1.599, P=0.1256; t20=1.847, P=0.0796; and t20=0.2521, P=0.8038, respectively). The decay time constant was
Author Manuscript
Author Manuscript
Author Manuscript
significantly smaller in CeM projectors (unpaired t-test, t20=2.532, *P=0.0198). The holding current corresponds to the current injected to clamp the cell at −70 mV. This value was not significantly different between NAc and CeM projectors (unpaired t-test, t20=1.046, P=0.3079). b, Confocal image of a BLA-NAc projectors expressing ChR2-eYFP transduced by rabies virus (RV) and recorded ex vivo in whole-cell patch-clamp. The cell was filled with biocytin during recording and stained with Sterptavidin-CF405 (in gray). c, Current response to a 1 second blue light pulse in a cell expressing RV, 5 days after injection. d, Five days after viral injection, RV-expressing cells were able to reliably follow 20 Hz light stimulation (5 ms pulses, top trace), as well as to 20 Hz depolarizing current steps (middle trace). RV-expressing cells also showed spontaneous post-synaptic excitatory and inhibitory currents (EPSC and IPSC) when clamped at −70mV (bottom trace, 0 pA holding for this cell). e, Current/Voltage (I/V) curves are similar in retrobead (RB, gray circles, n=5 cells) and RV expressing cells (black circles, n=3 cells). f, Average action potential for 11 RB positive BLA-NAc projectors (gray) and 6 BLA-NAc projectors expressing RV. g, Membrane properties of RB vs. RV expressing neurons. None of them were significantly altered in RV expressing neurons (unpaired t-tests: access resistance: t15=1.299, P=0.2135, membrane resistance: t15=2.057, P=0.0575, membrane capacitance: t15=1.215, P=0.2430, decay time constant: t15=1.677, P=0.1143, action potential threshold: t15=0.0756, P=0.9407, holding current: t15=1.002, P=0.3314).
Author Manuscript
Author Manuscript
Author Manuscript
Extended Data Figure 8. Morphological reconstructions of individual BLA neurons projecting to NAc or CeM
Morphological reconstructions of all neurons used for Sholl analysis performed by Imaris software (Fig. 4k). Classification of each neuron as pyramidal or stellate is indicated in the top left corner of each reconstructed neuron (triangle or star, respectively). Each atlas schematic represents 1.5 mm × 1.5 mm area and the corresponding antero-posterior stereotaxic coordinates (relative to Bregma) are shown below.
Author Manuscript
Author Manuscript
Author Manuscript
Extended Data Figure 9. RNA-Seq identification of candidate genes differentially expressed in NAc and CeM projecting BLA neurons
a, Candidate differentially expressed genes were required to be enriched in only one group
(either CeM or NAc projectors) in two independent experiments (NAc projectors collected from n=8 mice; CeM projectors collected from n=9 mice, total) at the indicated quantile fold change threshold (light blue column). One of the chance estimates (“flip-flopped”) is taken from genes that passed the quantile thresholds but were enriched in the opposite groups in the two experiments. Another chance estimate (“permuted”) is determined based on an analysis in which fold differences for each gene were permuted across genes within each of
Author Manuscript
Author Manuscript
Author Manuscript
the two experiments before determining differential expression. A 0.02 quantile threshold was chosen to identify candidate differentially expressed genes (light blue columns) in order to balance specificity and sensitivity, resulting in an estimated false discovery rate of 41.5%: [expected by chance (flip-flopped)]/Differentially expressed genes (see Extended Data Fig. 9c for candidate gene list). In Fig. 4k, a 0.01 quantile threshold was chosen to identify a more conservative list of differentially expressed candidate genes at a lower false discovery rate of 26.2%. b, Distribution of differentially expressed genes between NAc and CeM projectors from RNA-Seq experiments 1 and 2. Light blue shaded areas represent the 2nd and 98th percentiles of the distributions. c, RNA-Seq heatmap showing normalized expression levels of differentially expressed genes in NAc and CeM projecting BLA neurons. Differentially expressed genes were required to be enriched in either NAc or CeM projectors in two independent experiments (samples used in experiment 1 are indicated in black text below the heatmap; experiment 2 samples are indicated in blue text) at a 0.02 quantile threshold (Extended Data Fig. 9a). Each RNA-Seq library was prepared from 35–60 manually sorted retrobead-labeled cells taken from the BLA.
Acknowledgments
We thank C. Wildes, G. Glober, R. Luck, and G.F. Conyers, for technical assistance. We thank the entire Tye Laboratory, B. Okaty, U. Eser, J. di Iulio and A. Pfenning for helpful discussion. K.M.T. is a New York Stem Cell Foundation – Robertson Investigator and a Whitehead Career Development Chair. This work was supported by funds from NIMH (R01-MH102441-01), NIDDK (DP2-DK-102256-01), the JPB Foundation (PIIF and PNDRF), NARSAD, Klingenstein, Whitehall and Sloan Foundations (K.M.T.). Additionally, SY and JG were supported by NIMH (R01-MH101528-01), PN was supported by Singleton, Leventhal and Whitaker fellowships, and AB was supported by a fellowship from the Swiss National Science Foundation. R.W. was supported by post-doctoral fellowships from the Simons Center and Rubicon. I.R.W. was supported by seed grants from the McGovern Institute for Brain Research, the Picower Institute for Learning and Memory, the MIT Department of Brain and Cognitive Sciences, and the Simons Center for the Social Brain, as well as by BRAIN Initiative awards from NIMH, NEI, and NINDS (U01-MH106018 and U01-NS090473) and NSF (IOS-1451202).
References
1. Tye KM, Stuber GD, De Ridder B, Bonci A, Janak PH. Rapid strengthening of thalamo-amygdala synapses mediates cue–reward learning. Nature. 2008; 453:1253–1257. [PubMed: 18469802] 2. Tye KM, et al. Methylphenidate facilitates learning-induced amygdala plasticity. Nat Neurosci.
2010; 13:475–481. [PubMed: 20208527]
3. McKernan MG, Shinnick-Gallagher P. Fear conditioning induces a lasting potentiation of synaptic currents in vitro. Nature. 1997; 390:607–611. [PubMed: 9403689]
4. Rogan MT, Stäubli UV, LeDoux JE. Fear conditioning induces associative long-term potentiation in the amygdala. Nature. 1997; 390:604–607. [PubMed: 9403688]
5. Rumpel S, LeDoux J, Zador A, Malinow R. Postsynaptic Receptor Trafficking Underlying a Form of Associative Learning. Science. 2005; 308:83–88. [PubMed: 15746389]
6. Maren S. Synaptic mechanisms of associative memory in the amygdala. Neuron. 2005; 47:783–786. [PubMed: 16157273]
7. Han JH, et al. Selective Erasure of a Fear Memory. Science. 2009; 323:1492–1496. [PubMed: 19286560]
8. Paton JJ, Belova MA, Morrison SE, Salzman CD. The primate amygdala represents the positive and negative value of visual stimuli during learning. Nature. 2006; 439:865–870. [PubMed: 16482160] 9. Shabel SJ, Janak PH. Substantial similarity in amygdala neuronal activity during conditioned
appetitive and aversive emotional arousal. Proc Natl Acad Sci. 2009; 106:15031–15036. [PubMed: 19706473]
Author Manuscript
Author Manuscript
Author Manuscript
10. Redondo RL, et al. Bidirectional switch of the valence associated with a hippocampal contextual memory engram. Nature. 2014; 513:426–430. [PubMed: 25162525]
11. Sah P, Faber ESL, Lopez De Armentia M, Power J. The Amygdaloid Complex: Anatomy and Physiology. Physiol Rev. 2003; 83:803–834. [PubMed: 12843409]
12. Romanski LM, Clugnet MC, Bordi F, LeDoux JE. Somatosensory and auditory convergence in the lateral nucleus of the amygdala. Behav Neurosci. 1993; 107:444–450. [PubMed: 8329134] 13. Fontanini A, Grossman SE, Figueroa JA, Katz DB. Distinct Subtypes of Basolateral Amygdala
Taste Neurons Reflect Palatability and Reward. J Neurosci. 2009; 29:2486–2495. [PubMed: 19244523]
14. Pitkänen A. Connectivity of the rat amygdaloid complex. Amygdala Funct Anal. 2000; 2:31–115. 15. Davis M. The Role of the Amygdala in Fear and Anxiety. Annu Rev Neurosci. 1992; 15:353–375.
[PubMed: 1575447]
16. Cardinal RN, Parkinson JA, Hall J, Everitt BJ. Emotion and motivation: the role of the amygdala, ventral striatum, and prefrontal cortex. Neurosci Biobehav Rev. 2002; 26:321–352. [PubMed: 12034134]
17. Uwano T, Nishijo H, Ono T, Tamura R. Neuronal responsiveness to various sensory stimuli, and associative learning in the rat amygdala. Neuroscience. 1995; 68:339–361. [PubMed: 7477945] 18. Clem RL, Huganir RL. Calcium-Permeable AMPA Receptor Dynamics Mediate Fear Memory
Erasure. Science. 2010; 330:1108–1112. [PubMed: 21030604]
19. Miserendino MJD, Sananes CB, Melia KR, Davis M. Blocking of acquisition but not expression of conditioned fear-potentiated startle by NMDA antagonists in the amygdala. Nature. 1990; 345:716–718. [PubMed: 1972778]
20. Fanselow MS, LeDoux JE, et al. Why we think plasticity underlying Pavlovian fear conditioning occurs in the basolateral amygdala. Neuron. 1999; 23:229. [PubMed: 10399930]
21. Stuber GD, et al. Excitatory transmission from the amygdala to nucleus accumbens facilitates reward seeking. Nature. 2011; 475:377–380. [PubMed: 21716290]
22. Ambroggi F, Ishikawa A, Fields HL, Nicola SM. Basolateral amygdala neurons facilitate reward-seeking behavior by exciting nucleus accumbens neurons. Neuron. 2008; 59:648–661. [PubMed: 18760700]
23. Jimenez SA, Maren S. Nuclear disconnection within the amygdala reveals a direct pathway to fear. Learn Mem. 2009; 16:766–768. [PubMed: 19933881]
24. Haubensak W, et al. Genetic dissection of an amygdala microcircuit that gates conditioned fear. Nature. 2010; 468:270–276. [PubMed: 21068836]
25. Ciocchi S, et al. Encoding of conditioned fear in central amygdala inhibitory circuits. Nature. 2010; 468:277–282. [PubMed: 21068837]
26. Wickersham IR, et al. Monosynaptic restriction of transsynaptic tracing from single, genetically targeted neurons. Neuron. 2007; 53:639–647. [PubMed: 17329205]
27. Paré D, Smith Y, Paré JF. Intra-amygdaloid projections of the basolateral and basomedial nuclei in the cat: Phaseolus vulgaris-leucoagglutinin anterograde tracing at the light and electron
microscopic level. Neuroscience. 1995; 69:567–583. [PubMed: 8552250]
28. Tye KM, et al. Amygdala circuitry mediating reversible and bidirectional control of anxiety. Nature. 2011; 471:358–362. [PubMed: 21389985]
29. Washburn MS, Moises HC. Electrophysiological and morphological properties of rat basolateral amygdaloid neurons in vitro. J Neurosci Off J Soc Neurosci. 1992; 12:4066–4079.
30. Janak PH, Tye KM. From circuits to behaviour in the amygdala. Nature. 2015; 517:284–292. [PubMed: 25592533]
31. Kiritani T, Wickersham IR, Seung HS, Shepherd GMG. Hierarchical connectivity and connection-specific dynamics in the corticospinal-corticostriatal microcircuit in mouse motor cortex. J Neurosci Off J Soc Neurosci. 2012; 32:4992–5001.
32. Wickersham IR, Sullivan HA, Seung HS. Production of glycoprotein-deleted rabies viruses for monosynaptic tracing and high-level gene expression in neurons. Nat Protoc. 2010; 5:595–606. [PubMed: 20203674]