HAL Id: hal-01803214
https://hal.inria.fr/hal-01803214
Submitted on 30 May 2018HAL is a multi-disciplinary open access
archive for the deposit and dissemination of sci-entific research documents, whether they are pub-lished or not. The documents may come from teaching and research institutions in France or abroad, or from public or private research centers.
L’archive ouverte pluridisciplinaire HAL, est destinée au dépôt et à la diffusion de documents scientifiques de niveau recherche, publiés ou non, émanant des établissements d’enseignement et de recherche français ou étrangers, des laboratoires publics ou privés.
Performance evaluation of ”Internet-of-Bikes” IoB-DTN
routing protocol and IoB-Long range
Yosra Zguira, Hervé Rivano
To cite this version:
Yosra Zguira, Hervé Rivano. Performance evaluation of ”Internet-of-Bikes” IoB-DTN routing protocol and IoB-Long range. [Research Report] Institut national des sciences appliquées de Lyon. 2018, pp.1-9. �hal-01803214�
Performance evaluation of "Internet-of-Bikes" IoB-DTN
routing protocol and IoB-Long range
1
Introduction
Intelligent Transport Systems (ITS) are an essential part of the global world. They play a sub-stantial role to face for many matters like traffic jamming, unhealthy life, air pollution, etc. They have been designed to sense, collect and communicate data. Public bike sharing system has been considered as an urban transportation system that can collect data from mobile devices. In [11], we introduced "Internet-of-Bikes" DTN routing protocol based on the Delay Tolerant Network (DTN) paradigm being applied to mobile network IoT devices running a data collection application on bike sharing system based sensor network. It is inspired by DTN flooding protocols which diffuse multiple copies of a packet in order to increase its probability to reach the destination [10]. In par-ticular, it is inspired by Binary Spray and Wait protocol that limits the number of copies sprayed in the network. It is interesting to note that the copies of a packet stored in a buffer are virtual. We increment a counter, thus each packet occupies one slot in a buffer. It is worth to point out that the buffer management policy is an important parameter for IoB-DTN protocol. It decides which packet should be kept and which one should be discarded if the buffer is full. We simulated four buffer management policies in [11], and our results showed that GPP policy offers the best performances in terms of loss rate and delivery delay since it gives priority to generated packets. In this report, the number of copies is set to 8 and GPP is applied as the buffer management policy. In this research report, we give a detailed performance evaluation of the multi-hop "Internet-of-Bikes" DTN routing protocol adapted for an IoT-like applications running on bike sharing system based sensor network. First, we evaluate the IoB-DTN routing protocol by varying the transmission power values of sensors. Performances are evaluated in terms of delivery delay, delivery rate, energy cost and throughput. Second, we compare the performances of IoB-DTN routing protocol and a low-power wide-area network (LPWAN) technology, LoRa/LoRaWAN in terms of throughput and energy consumption. In long range technology, only bike to bike station communication is performed. The components used in such technology operate at a lower cost and are very energy efficient than traditional mobile networks. They can send and receive messages of very small size, over very long ranges (from 5km to 40km).
2
Simulated scenario
In our scenario, each bicycle embeds a sensor and a 802.11p communication device. Bicycles generate data every second, store it in their buffers and then transfer it to its neighbors depending on the duty cycle used. They exchange data until they reach a sink. All bicycle stations are equipped with base stations, that are connected to the Internet, and act as a fixed sinks. Each neighbor is in communication range with a base station, it forwards all data stored in its buffer.
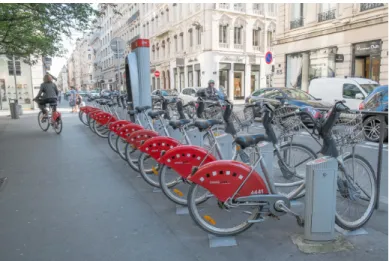
In our work, we analyze the IoB-DTN proposed protocol in the city of Lyon. It is situated in east-central France, in the Auvergne-Rhône-Alpes region. Lyon is one of the first cities in the world that tested the self-service bicycles called Vélo’v [1]. It provides more than 4000 bikes and they are available 24/7. Each citizen takes his bike as close to his starting point and returns it as close to his point of arrival. Figure 1 depicts one of the bicycle station in the city center.
The Vélo’v stations data are described in the platform "Data Grand Lyon" [2]. It is charac-terized by reference information (name, address, number of nodes, etc.) and real-time information indicating the availability of bicycles or places. These data are integrated with the map of Lyon from OpenStreetMap [3]. Our results was simulated in the central area of the city as indicated in figure 2. These data are imported to SUMO which is an open source road traffic simulation package
Figure 1: Vélo’v bicycle sharing system in Lyon
[7]. The urban mobility simulator allows to import and generate road networks, bike routes and obstacles. The Veins module framework [4] connects SUMO to the discrete event simulator OM-NeT++ [5] via a TCP socket. The vehicular network simulation includes a real model of 802.11p and radio propagation.
Table 1 summarizes the simulation configuration used for our scenario. We simulate four cases as shown in Table 3 by varying the buffer size and the duty cycle. We simulate ten scenarios by varying the paths of bikes in each scenario.
Number of bike stations 49 Number of bikes 51
Packet generation time Every second Communication model 802.11p Simulation time 30 minutes
Table 1: Simulation parameters Buffer size Duty cycle
Case 1 250 50
Case 2 250 150
Case 3 500 50
Case 4 500 150
Table 2: simulated cases
3
Evaluation of IoB by varying the transmission power
In this part, we evaluate the IoB-DTN routing protocol on the energy by varying the transmission power. We appraise four transmission power values: 1mW, 5mW, 10mW and 20mW.
First, we evaluate the average distances for each transmission power value as shown in Figure 3. We notice that by increasing the transmission power, the communication range in each case raises.
Figure 2: City area of Lyon
Figure 3: Average distances Figure 4: Average delivery rate
As expected, the average delivery rate increases by ranging the communication range as ex-pected in Figure 4. In such case, each node will encounter more neighbor nodes and more gateways. Figure 5 shows the average delivery delay of received packets. We notice that variation of the transmission power values does not impact on the delivery delay. Thus, it shows that the dynamics of bikes impacts more than the transmission power of sensors. While, the transmission range impacts the throughput as shown in Figure 6.
Figure 7 shows the average protocol cost of IoB-DTN routing protocol. It is calculated in terms
Figure 5: Average delivery delay Figure 6: Average throughput
of the average number of transmitted and received packets in all simulation scenarios, considering bike to bike and bike to bike station communications. We can see two columns for each case: the first column represents all the transmitted packets and the second one represents all the received packets. The first column has three fields: NPSN (number of packets sent to nodes), NASN (number of acknowledgments sent to nodes) and NPSG (number of packets sent to gateways). The second column has two fields: NPRN (number of packets and acknowledgments received by nodes) and NPRG (number of packets received by the gateways).
We notice that by ranging the transmission power of sensors, the average number of transmitted and received packets increases. This results is expected since nodes will encounter more neighbor nodes and more gateways which raises all the communication in the network. It is interesting to note that by using a higher duty cycle and a small buffer size offers a smaller protocol cost.
Figure 7: Average protocol cost of IoB
4
Evaluation of IoB-DTN and long range technology
In this section, we give a comparison between the multi-hop IoB-DTN routing protocol and a long range technology which is characterized by only bike to bike station communications. We consider
IoB-DTN with a radio propagation that gives around one kilometer as communication range, it is appointed IoB-Long range (IoB-LR).
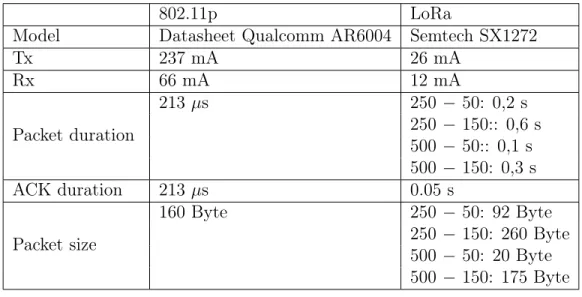
We assume that IoB-LR follows the Semtech SX1272 model [9] of LoRa technology since there is not a simulation model in Omnet++. In our theoretical results, we consider that IoB-DTN routing protocol follows he Datasheet Qualcomm AR6004 model [6]. The parameters used are presented in this table:
802.11p LoRa
Model Datasheet Qualcomm AR6004 Semtech SX1272
Tx 237 mA 26 mA Rx 66 mA 12 mA Packet duration 213 µs 250 − 50: 0,2 s 250 − 150:: 0,6 s 500 − 50:: 0,1 s 500 − 150: 0,3 s ACK duration 213 µs 0.05 s Packet size 160 Byte 250 − 50: 92 Byte 250 − 150: 260 Byte 500 − 50: 20 Byte 500 − 150: 175 Byte Table 3: Parameters used
The packet size values of Lora technology are calculated from results obtained by an operational LoRaWAN namely The Things Network [8]. We consider the payload size of IoB-LR using the spreading factor SF7 since it offers the higher values.
In our work, we are interested to evaluate the energy consumption as well as the throughput of IoB-DTN and IoB-LR. In order to appraise the energy consumption we assess the average transmission cost per bike and the average consumption background per bike.
Figure 8 shows the average transmission cost per bike that it is measured in mAh as follows: T C = [N P S ∗ T x ∗ DP ] + [N AR ∗ (T x + Rx) ∗ DA] + [N P R ∗ Rx ∗ DP ]
| {z }
f orIoB
(1)
TC: transmit cost (mAh) NPS: number of sent packets TX: transmit consumption DP: duration of a packet
NAR: number of received acknowledgment RX: receive consumption
DA: duration of an acknowledgment NPR: number of received packets
We note that IoB-LR has a higher consumption per bike since all bicycles will forward the data packets only to sinks. While, IoB-DTN protocol provides smaller consumption thanks to the bike to bike communications. In the same figure, we represent the average consumption background by applying the maximum theoretical duty cycle allowed in Europe which is 10%.
Figure 8: Average transmission cost per bike Figure 9: Average consumption background per bike
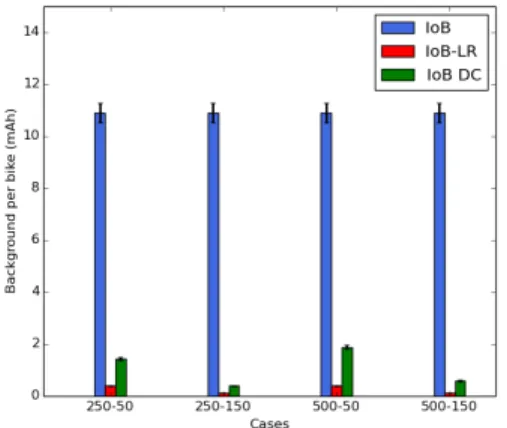
Figure 9 shows the average consumption background per bike which is the total consumption per bicycle in the network. It is computed as follows:
For IoB: BC =X(T a − T d) ∗ Rx (2) For IoB-LR: BC = Rx ∗ BW T DC ∗ X (T a − T d) (3) BC: background consumption Ta: arrival time
Td: departure time
BWT: beacon waiting time DC: duty cycle
We notice that IoB-DTN has a higher consumption background than IoB-LR since nodes are always in listening mode for beacons to forward data. While, in IoB-LR, the nodes enter in sleep mode and they wake up few seconds before transmitting the packets.
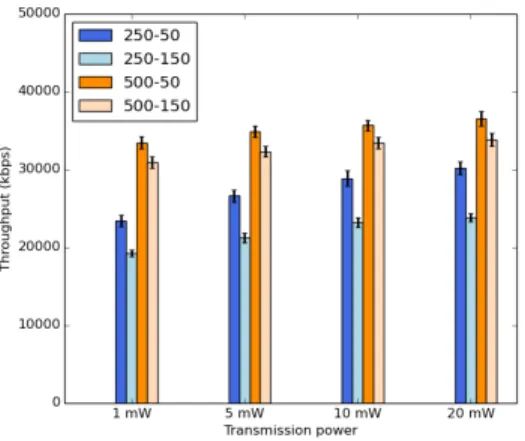
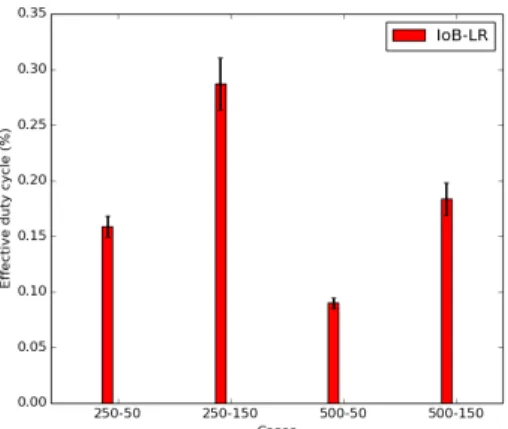
Figure 10 shows the throughput for both protocols. We notice that IoB-DTN performs better in terms of throughput when the duty cycle is small; while IoB-LR has better results when the duty cycle is higher. In the same Figure, we represent the throughput given for IoB-LR when respecting the maximum theoretical duty cycle 10% allowed by LoRa. In Figure 10, we also present the throughput of IoB-LR when respecting the real duty cycle. It represents the effective duty cycle of nodes, it is presented in Figure 11 and it is calculated as follows:
EDC = N P S ∗ Rt
P(T a − T d) (4)
EDC: effective duty cycle NPS: number of sent packets Rt: airtime represents in seconds
Figure 10: Average throughput Figure 11: Average effective duty cycle
We notice that, when respecting the maximum theoretical duty cycle allowed by LoRa tech-nology and the effective duty cycle, IoB-DTN has better throughput than IoB-LR in all cases.
5
Conclusion
In this report, we present a detailed performance evaluation of IoB-DTN routing protocol. We provide two performance assessments: evaluation of IoB-DTN by varying the transmission power values of sensors and evaluation of IoB-DTN and a long range technology, LoRa/LoRaWAN. First, our results show that by increasing the transmission power, the communication range raises which increases the delivery rate, throughput and the energy consumption. Second, our results show that the multi-hop IoB-DTN routing protocol offers better throughput than the long range IoB-LR protocol, while IoB-LR provides better energy consumption than a multi-hop technology thanks to the bike ti bike communications.
Bibliography
[1] https://velov.grandlyon.com/. [2] htps://data.grandlyon.com/. [3] https://www.openstreetmap.org. [4] http://veins.car2x.org/. [5] https://omnetpp.org/.[6] Qualcomm Technologies, AR6004 Single Chip 2X2 802.11 A/B/G/N MIMO MAC/BB/Radio, Data Sheet, Septembre 2016.
[7] Michael Behrisch, Laura Bieker, Jakob Erdmann, and Daniel Krajzewicz. Sumo–simulation of urban mobility: an overview. In Proceedings of SIMUL 2011, The Third International Conference on Advances in System Simulation. ThinkMind, 2011.
[8] Norbert Blenn and Fernando Kuipers. Lorawan in the wild: Measurements from the things network. arXiv preprint arXiv:1706.03086, 2017.
[9] Lluís Casals, Bernat Mir, Rafael Vidal, and Carles Gomez. Modeling the energy performance of lorawan. Sensors, 17(10):2364, 2017.
[10] Evan PC Jones and Paul AS Ward. Routing strategies for delay-tolerant networks. Submitted to ACM Computer Communication Review (CCR), 2006.
[11] Yosra Zguira, Hervé Rivano, and Aref Meddeb. Iob-dtn: A lightweight dtn protocol for mobile iot applications to smart bike sharing systems. In Wireless Days (WD), 2018, pages 131–136. IEEE, 2018.