HAL Id: tel-00987078
https://tel.archives-ouvertes.fr/tel-00987078
Submitted on 5 May 2014
HAL is a multi-disciplinary open access
archive for the deposit and dissemination of sci-entific research documents, whether they are pub-lished or not. The documents may come from teaching and research institutions in France or abroad, or from public or private research centers.
L’archive ouverte pluridisciplinaire HAL, est destinée au dépôt et à la diffusion de documents scientifiques de niveau recherche, publiés ou non, émanant des établissements d’enseignement et de recherche français ou étrangers, des laboratoires publics ou privés.
from Cassini-ultraviolet imaging spectrograph stellar
and solar occultations
Fernando Capalbo
To cite this version:
Fernando Capalbo. Titan’s upper atmosphere composition and temperature from Cassini-ultraviolet imaging spectrograph stellar and solar occultations. Earth Sciences. Université Paris-Est, 2013. English. �NNT : 2013PEST1101�. �tel-00987078�
Docteur de l’Universit´e Paris-Est
Sp´ecialit´e: Sciences de l’Univers et Environnement
par
Fernando Javier Capalbo
Ecole Doctorale : Sciences, Ing´enierie et Environnement
Composition et temp´erature de l’haute atmosph`ere de Titan
`a partir des occultations stellaires et solaires mesur´ees par
l’Spectrographe d’Imagerie Ultraviolet de Cassini
Th`ese soutenue le 26 novembre 2013 devant le jury compos´e de:
Courtin R´egis Rapporteur Pascal Rannou Rapporteur Emmanuel Lellouch Examinateur Antoine Jolly Examinateur Veronique Vuitton Examinateur Franc¸ois Raulin Examinateur
Roger Yelle Examinateur
from Cassini Ultraviolet Imaging Spectrograph stellar
and solar occultations
Fernando J. Capalbo fernando.capalbo@lisa.u-pec.fr
PhD Thesis:
University Paris Est, France
Supervisor: Professor Yves B´enilan yves.benilan@lisa.u-pec.fr
Defense Jury:
• Mr. R´egis Courtin, LESIA, Observatoire de Paris-Meudon. Reporter.
• Mr. Pascal Rannou, Groupe de Spectrom´etrie Mol´eculaire et Atmosph´erique, Univ. Reims. Reporter.
• Mr. Emmanuel Lellouch, LESIA, Observatoire de Paris-Meudon. Examiner.
• Mr. Antoine Jolly, Laboratoire Interuniversitaire des Syst`emes Atmosph´eriques. Examiner. • Mme. Veronique Vuitton, Institut de Plan´etologie et d’Astrophysique de Grenoble, Universit´e
Joseph Fourier. Examiner.
• Mr. Roger Yelle, University of Arizona. Examiner.
• Mr. Fran¸cois Raulin, Laboratoire Interuniversitaire des Syst`emes Atmosph´eriques. President of Jury.
• Mr. Yves B´enilan, Laboratoire Interuniversitaire des Syst`emes Atmosph´eriques. PhD supervisor.
Date of defense: November 2013. Manuscript version: February 2014.
The ultimate objective of the author of this work is to study nature and life. Without giving a definition of this last, controversial word, limiting the concept to that for which humans are an example will be enough for the purpose of this work. One of the motivations of this study is curiosity. However, the main motivation comes from the author’s personal belief that the understanding of life in a wider context than that given by the experiences we face everyday here on Earth, for example in the context of other celestial bodies, may radically change the concepts and attitudes of many people in our society. Of course any work is somehow related with nature and life, but a focus on a restricted subtopic is mandatory. One of these subtopics is the building blocks of what we know today as examples of life. Restricting the topic even more, the interests of this work are focused on basic organic compounds that may give rise to more complex, prebiotic molecules. In particular, the interest is focused on their identification, interrelation and their environmental conditions in the upper atmosphere of Titan. One could wonder: why Titan?, why the thermosphere and not the stratosphere or even the surface?. The answer to the first question is given in the Introduction. An ideal or logical development of motivation to perform this work would maybe imply a study of Titan’s surface and atmosphere, the state of knowledge about them and then, based on its importance, relevance, need and/or personal interest a decision that a study of the upper atmosphere in the VUV domain was necessary. But the truth is that, as in many other cases concerned with any other topic, there are other reasons which are rarely stated although unavoidably present. The particular interest/focus in the thermosphere and particularly in VUV observations was influenced by practical and worldly events of the author’s personal life. This changed a bit the order of things with respect to the ideal motivation development commented above (change which is normal), without diminishing the interest or the relevance of this topic; relevance which is going to be exposed mainly in the Introduction.
This final report describes the work done by the author as part of his doctorate in philosophy (PhD) course, as student and employee during 3 years at the University Paris Est. The work was developed in the Groupe de Physico-Chimie Organique Spatiale (GPCOS), at the Laboratoire Inter-Universitaire des Syst`emes Atmosph´eriques (LISA), and combined with teaching activities in the Universit´e Paris Est Cr´eteil (UPEC), in Cr´eteil, France.
The document describes the analysis of Titan’s thermospheric composition and temperature, de-rived from the analysis of data from the Ultraviolet Imaging Spectrograph (UVIS) on board the Cassini orbiter. It comprises also laboratory measurements of absorption cross sections of the benzene molecule.
The origin, distribution and evolution of organic molecules and life are the main subjects of a recent scientific field known as astrobiology. One interesting subtopic is the identification of organic com-pounds and the chemical and physical processes they are part of, in places other than Earth. One particularly interesting object from this point of view is Titan, Saturn’s largest moon and the only one in the Solar System known to have a thick N2/CH4, planet-like atmosphere. This atmosphere is long ago known to be rich in organic compounds of high interest for astrobiology. The NASA-ESA-ASI mission Cassini-Huygens, was designed to explore the Saturnian system, with particular interest in Titan. The instruments in Cassini provided large amounts of information about the atmosphere. Data from the Ion Neutral Mass Spectrometer (INMS) and the Cassini Plasma Spectrometer showed the existence of heavy organic neutrals (with up to 7 C atoms) and ions (bigger than 13000 Da) in the thermosphere. Observations along the mission showed a complex atmospheric variability depend-ing on many variables like solar activity or magnetospheric interactions, among others. The organic molecules in the atmosphere give rise to a complex chemistry that leads to the formation of organic aerosols in the lower stratospheric layers. These aerosols precipitate to the surface in Titan and con-tinue their chemical evolution. This is one of the characteristics that makes Titan interesting from an astrobiological perspective.
The Ultraviolet Imaging Spectrograph (UVIS) aboard Cassini is a valuable tool that allows study-ing composition, species distribution and temperatures in Titan’s upper atmosphere. It can detect molecules using their absorption features, in the region known as ignorosphere (500 - 950 km), be-tween the ranges covered by the Composite InfraRed Spectrometer (CIRS) and INMS. The detection is dependent on the absorption cross section of the molecules and aerosols, which are measured in laboratory or calculated from theory. This PhD project focuses on the study of the upper atmosphere of Titan from the analysis of Cassini-UVIS data and laboratory measurements of absorption cross sections.
A characterization of the UVIS instrument and observations was necessary. Data from the Far UltraViolet (FUV) and Extreme UltraViolet (EUV) channels of UVIS were analyzed and corrected for instrument effects. From the analysis of 8 solar occultations in EUV, N2 and CH4 number density profiles were derived with an inversion regularization method. Temperatures were obtained from the N2 profiles assuming an isothermal upper atmosphere. Stellar occultations in FUV were modeled and a density retrieval technique characterized. The possibility of detection for different molecules (some of them not detected by this technique before) was analyzed. Then, using a Levenberg-Marquardt minimization algorithm, column density profiles for different hydrocarbons and nitriles, and optical depth of aerosols were obtained from simulated data. The column densities and optical depth were inverted with a regularization method to obtain number density profiles for the molecules and extinc-tion profiles for the aerosols. The procedure was finally applied to 2 stellar occultaextinc-tions measured by UVIS. The species studied are CH4, C2H2, HCN, C2H4, C4H2, C6H6, HC3N, CH3, and aerosols. The profiles from the stellar and solar occultations were obtained for different times and locations. The temperatures derived were analyzed as a function of geographical and temporal variables—latitude,
longitude, date of observation, etc.—without a clear correlation with any of them, although a trend of decreasing temperature towards the poles could be observed. The globally averaged temperature obtained is (144 ± 2) K. Atmospheric variability was discussed on the light of these results.
Benzene (C6H6) is an important molecule detected in Titan’s atmosphere because it is thought to be intermediate between the gas and solid particle formation. Measurements of absorption in the ultraviolet by benzene gas, at temperatures covering the range from room temperature to 215 K, were performed in different international facilities. From them, benzene absorption cross sections were derived and analyzed in terms on the transitions observed. No significant variation with measurement temperature was observed. Implications of this results for the identification of benzene in Titan’s thermosphere by UVIS were discussed. The absorption cross sections were used in the derivation of C6H6 abundances in Titan’s thermosphere commented above.
In summary the analysis of UVIS observations presented contribute to the characterization of the upper atmosphere through N2 density profiles, thermospheric temperatures, density profiles of minor species and extinction profiles of aerosols. This observational data will help to constrain and contrast photochemical models. The abundance profiles and temperatures given for different geographical and temporal coordinates can be used to further study the atmospheric variability. As a whole, the results of this work are expected to help in the understanding of Titan’s upper atmospheric composition and dynamics. This knowledge, combined with information about Titan’s lower atmosphere and surface, will help to understand the evolution of organic molecules in this neighboring abiotic celestial body.
List of Figures ix
List of Tables xiii
1 Introduction 1
1.1 Titan’s atmosphere . . . 4
1.1.1 A short tale about an intriguing atmosphere . . . 4
1.1.2 General description - state of knowledge . . . 7
1.2 Cassini investigations . . . 14
1.3 Motivations and focus of the present work . . . 16
2 UVIS stellar and solar occultation data analysis 19 2.1 UVIS instrument and data . . . 20
2.1.1 UVIS instrument . . . 20
2.1.2 UVIS data . . . 21
2.1.3 Ancillary data . . . 22
2.2 Absorptive UV occultations . . . 23
2.2.1 Atmospheric composition from absorptive VUV stellar occultations . . . 25
2.2.2 First steps in occultation analysis . . . 29
2.2.3 Stellar vs. solar occultations . . . 31
2.3 Stellar occultations measured by UVIS FUV . . . 33
2.3.1 Introduction to stellar occultations measured in the FUV . . . 33
2.3.2 UVIS/FUV stellar occultation analysis . . . 34
2.4 Solar occultations measured by UVIS EUV . . . 37
2.4.1 Introduction to solar occultations measured in the EUV . . . 37
2.4.2 UVIS/EUV solar occultation analysis . . . 40
2.5 Temporal/spatial coverage of data . . . 50
2.6 Summary of chapter . . . 53
3 Retrieval methods 55 3.1 Column density retrieval, stellar occultations . . . 56
3.2 Column density retrieval, solar occultations . . . 58
3.3 Altitude range for column densities . . . 58
3.4 Number density and aerosol extinction retrieval . . . 60
3.5 Temperature calculations . . . 61
3.6 Simulations . . . 62
3.6.1 Choice of Species . . . 63
3.6.2 Simulation of UVIS data and column density retrieval . . . 65
3.6.3 Simulation of molecular number density and aerosol extinction retrieval . . . . 71
3.7 Summary of chapter . . . 71
4 Benzene ACS in the VUV, relevance for Titan 75 4.1 An Introduction to Benzene on Titan . . . 76
4.2 Introduction to benzene absorption cross sections . . . 79
4.3 Experimental measurements of benzene absorption cross section . . . 80
4.3.1 Absorption measurements with Synchrotron radiation, BESSY II facility . . . . 81
4.3.2 Absorption measurements with a deuterium lamp source, Meudon Observatory facility . . . 83
4.3.3 Absorption cross section derivation and uncertainties . . . 86
4.4 Absorption cross section results and interpretation . . . 88
4.4.1 Temperature variations . . . 92
4.5 Summary of chapter . . . 96
5 Atmospheric composition and variability 97 5.1 Column density and number density profiles . . . 98
5.1.1 Minor constituents abundance, from FUV stellar occultations . . . 98
5.1.2 Major constituents abundance, from FUV stellar and EUV solar occultations . 103 5.2 Temperature and variability . . . 108
5.3 Summary of chapter . . . 113
6 Conclusions and further work 117
Appendices 123
A Temperature calculations 125
B MPFIT, dependence of column density retrieval on initial guess 131
C MPFIT, uncertainties in column density retrieval 137
1.1 Titan’s upper atmosphere composition from different measurements and models. . . . 8
1.2 Complexification of Titan composition, from gas to aerosols (from Waite et al.,2007) . 9 1.3 The entire primary, equinox, and solstice phases of the Cassini mission. . . 14
2.1 Scheme of UVIS FUV/EUV channel. From Esposito et al.(2004) . . . 21
2.2 UVIS EUV/FUV channel characteristics. From Esposito et al.(2004). . . 21
2.3 Graphic representation of a PDS data cube with raw data counts from an observation. 22 2.4 General occultation analysis workflow chart. . . 25
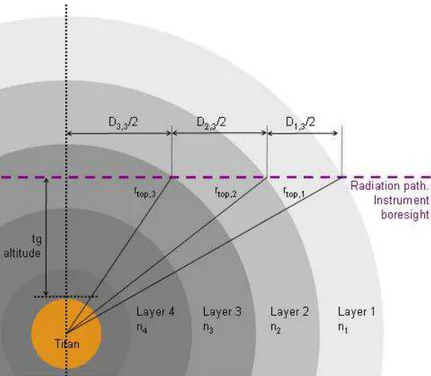
2.5 Schematics of the atmospheric layers created for the analysis. . . 27
2.6 Distances between the spacecraft and the center of Titan, and between the spacecraft and the tangent altitude point. . . 30
2.7 Workflow chart for stellar occultation analysis. . . 34
2.8 Star x and y position in the FOV of the UVIS/FUV low resolution slit, as a function of sample index (time), during the T53 flyby. . . 35
2.9 UVIS calibrated spectrum of star Alpha Eridanus. . . 36
2.10 Absorption cross sections used in the retrieval of atmospheric constituents performed from FUV observations and extinction cross sections for spherical aerosols. . . 37
2.11 Transmission as a function of altitude, measured with UVIS/FUV for the wavelength bins shown in the graph, during the T53 stellar occultation. . . 38
2.12 Transmission as a function wavelength for the tangent altitudes shown in the graph, measured with UVIS/FUV, during the T53 stellar occultation. . . 39
2.13 Workflow chart for solar occultation analysis. . . 40
2.14 Sun position and size in the squared FOV of the UVIS solar occultation port for occul-tations T58 and the egress leg of T62. . . 41
2.15 Background correction . . . 43
2.16 Background vs. altitude and vs. wavelength . . . 44
2.17 Wavelength calibration 630 ˚A . . . 45
2.18 Light curves, behavior above TOA . . . 46
2.19 T53 wavelength calibration coefficients, detector line 5 . . . 47
2.20 T53 solar spectrum and ACS . . . 48
2.21 T53, transmission vs. altitude . . . 49
2.22 Latitude and Longitude for all the observations analyzed. . . 52
2.23 Saturn Local Time and Titan Local Solar Time for the solar occultations analyzed. . . 53
3.1 Theoretical contribution to optical depth simulation at 800 km . . . 66
3.2 Number density profiles of the species used in the simulations . . . 67
3.3 Simulated spectra for stellar occultation in count units . . . 67
3.4 Simulated transmission vs. altitude and wavelength. . . 68 ix
3.5 Column densities retrieved from simulated data . . . 70
3.6 Number densities and aerosol extinction retrieved from simulated data . . . 72
4.1 Experimental setup used to measure benzene absorption cross section at BESSY II synchrotron facility. FromFerradaz et al. (2009) . . . 81
4.2 Absorption cross section from several filtered measurement series at 298 K, measured at 0.5 ˚A, with SR as a source. . . 83
4.3 Experimental setup used to measure benzene absorption cross section with a deuterium lamp as a source at the Meudon Observatory facility. . . 83
4.4 Absorption cross section form several filtered measurement series at 298 K, measured at 1 ˚A, with a deuterium lamp as a source. . . 87
4.5 Benzene absorption cross section derived from the experiments and analyses described in Section 4.3, at different temperatures and different resolutions. . . 89
4.6 Benzene absorption cross section measured with SR as a source, at 298 K and nominal 0.5 ˚A resolution. . . 92
4.7 Fractional change in absorption cross section, Pc,T, for some of the spectra in Table 4.3, in the region 1735 - 1820 ˚A. . . 94
4.8 Fractional change in absorption cross section, Pc,T, for the spectra measured at 250 K, for the region 1210 - 1650 ˚A. . . 95
4.9 Fractional change in absorption cross section, Pc,T, for the spectra measured at 250 K, zooming in one of the band system. . . 95
5.1 Column densities derived from a stellar occultation during flyby T41. . . 98
5.2 Column densities derived from a stellar occultation during flyby T53. . . 98
5.3 Number densities derived from a stellar occultation during flyby T41. Solid lines are profiles fromKoskinen et al.(2011). . . 99
5.4 Number densities derived from a stellar occultation during flyby T53. Solid lines are profiles fromKoskinen et al.(2011). . . 100
5.5 Aerosol extinction derived from stellar occultations during flybys T41 and T53. Solid lines are profiles from Koskinen et al.(2011). . . 101
5.6 Benzene number density profiles derived from stellar occultations during flybys T41 and T53. . . 102
5.7 Methane column density profiles derived from all stellar occultations and all solar oc-cultations analyzed in this work. . . 104
5.8 Nitrogen column density profiles derived from all the solar occultations analyzed in this work. . . 105
5.9 Methane number density profiles derived from all the stellar occultations and all the solar occultations analyzed in this work. . . 106
5.10 Nitrogen number density profiles derived from all the solar occultations analyzed in this work. . . 107
5.11 Nitrogen and methane number densities from stellar and solar occultations. . . 108
5.12 CH4 and N2 number densities. Comparison with other measurements. . . 109
5.13 Temperature for each flyby analyzed. . . 110
5.14 Temperature as a function of latitude from each flyby analyzed. . . 111
5.15 Temperature as a function of longitude, from each flyby analyzed. . . 112
5.16 Temperature as a function of Titan Local Solar Time, from each flyby analyzed. . . . 113
5.18 Temperature as a function of Saturn Local Time, from each flyby analyzed. . . 115 A.1 Example of simulated number densities to test the temperature calculation procedures. 127 A.2 Results from the Monte Carlo simulations, calculating temperature with method 1 (top),
method 2 (middle) and method 3 (bottom). . . 129 B.1 Retrieval matrices generated to evaluate the results of MPFIT running alone, with no
external iteration scheme. . . 134 B.2 Retrieval matrices generated to evaluate the results of MPFIT running wrapped with
an iteration scheme of 4 iterations. . . 135 C.1 Distribution of column densities obtained with the Monte Carlo simulations. . . 139 C.2 Comparison of standard deviation obtained in the Monte Carlo simulation with the
1.1 Titan characteristics. Most of the values are taken from Coustenis and Taylor (2008).
Third column is expressed in Earth units. . . 3
2.1 Stellar and solar occultation characteristics. . . 32
2.2 The absorption cross sections used in the retrieval of atmospheric constituents per-formed from FUV observations. . . 36
2.3 Wavelength bins used in the analysis of solar occultations. . . 49
2.4 Characteristics of stellar occultations analyzed. . . 50
2.5 Characteristics of solar occultations analyzed. . . 51
3.1 Characteristic absorption bins in the FUV for each species, used to determine altitude limits for a valid column density retrieval. . . 59
3.2 Analysis of detectability by UV absorption in Titan’s upper atmosphere for several species. . . 64
4.1 Characteristics of the 10 m spectrograph at Meudon Observatory. . . 84
4.2 Uncertainties corresponding to each spectra derived in this work and presented in Ta-ble 4.3. The limits of the wavelength regions indicated are approximative. . . 88
4.3 List of measured spectra. Spectra from the bibliography shown in Figure 4.6 are also included for reference. . . 88
5.1 Temporal and geographical characteristics for the set of measurements shown in Fig-ure 5.12. For INMS the latitude and longitude correspond to closest approach. . . 107
5.2 Global temperature derived averaging all temperatures obtained from the UVIS EUV solar occultations and temperatures for specific flybys. . . 108
B.1 Table showing the criteria used to interpret the ‘retrieval matrices’ and evaluate the response of MPFIT to different initial guesses. . . 132
Introduction
The origin, evolution and distribution of life in the universe, including Earth, are the focus of a research field known as astrobiology. This wide field of study requires an interdisciplinary approach to get a global picture and understand the interrelations of the complex processes involved. Any contribution to this field will focus on a sub-topic, studied from a particular point of view, framed by a particular discipline, but without disregarding the interrelations with the others. One of these subtopics is the ‘building blocks’ of what we know today as examples of life, organic molecules. It is believed that these carbon-containing molecules, taking part in increasingly complex organic chemistry, under particular conditions, can lead to matter that is alive. Organic molecules are the very basic constituents of living organisms here on Earth, where their presence and interactions can be readily studied. But a comprehensive study of the role of this molecules in the development of life cannot be limited to Earth or a present state. These molecules are distributed across the universe, under different environments, changing in different time scales, without the influence of human activity. In spite of their relevance to the origin of life, our knowledge about the distribution, interactions and the conditions this molecules are subject to in extraterrestrial environments is limited. Increasing this knowledge is the objective of this work. To help us to get a wider picture of nature and make a modest contribution to astrobiology that, together with the results from other studies and disciplines, could shed light over the processes that led to life here on Earth.
Among the organic molecules of interest for astrobiology there are those that take place in prebiotic chemistry. This is an organic chemistry (chemistry involving organic molecules) in liquid water that produces what can be called prebiotic molecules (e.g. sugar, amino acid, and nitrogenous base), sensible to form compounds of biological interests (Raulin,2005,b). Organic molecules include volatiles like hydrogen cyanide (HCN), formaldehyde (HCHO), cyanoacetylene (HC3N) and their oligomers. A next step in prebiotic chemistry is the formation of organic macromolecular products. These are formed systematically in laboratory simulations of atmospheric gas mixtures leading to the formation of organic products. The exact composition of these muddy compounds depends on the formation conditions. Interestingly, when hydrolyzed they are capable of letting out a wide variety of organics and oxygenated compounds, including many of biological interest, such as amino acids. On certain celestial bodies (as the case of Titan as explained below) macromolecular material created in the atmosphere can precipitate to the surface and further evolve. Therefore, prebiotic molecules and the organic compounds obtained from them are primordial to be characterized in extraterrestrial environments.
Atmospheres are an important target in the study of organic chemistry. Old theories considered the possibility that prebiotic compounds were formed in a primitive reducing Earth atmosphere, and that prebiotic chemistry took place with the precipitated compounds in the surface oceans (Miller,
1953). Although nowadays this idea has been abandoned, the early Earth atmosphere probably not being reducing enough for atmospheric organic synthesis to take place; atmospheric organic chemistry is still of interest, as it can take place in many extraterrestrial environments, mainly in atmospheres of giant planets1. It takes place in atmospheres in our Solar System and allows us to test theories about this type of chemistry ‘in the field’. Moreover, atmospheric composition is fundamental for the adaptation of living organisms on the surface. In this context the study of any atmosphere is relevant, and particularly one rich in organic compounds. Organic compounds in atmospheres (like methane (CH4), acetylene (C2H2), to mention some) and nitrogenated compounds (like molecular nitrogen (N2), ammonia (NH3), etc.) could lead to the formation of more complex molecules, including prebiotic ones. All this makes the identification and characterization of organic compounds in the universe, and in planetary atmospheres in particular, a very interesting topic, and the focus of this work.
1For a discussion about early Earth atmosphere and a comparison with Titan’s see for exampleSelsis and Parisot
Table 1.1: Titan characteristics. Most of the values are taken from Coustenis and Taylor (2008). Third column is expressed in Earth units.
Mass 1.346×10²³ kg 0.0226
Equatorial radius 2575 km 0.202
Mean distance from Saturn 1,221,850 km
-Mean distance from Sun 1.422×10⁹ km 9.55
Solar Flux 15.1 W m2 0.01
Orbital period 15.95 Earth days 15.95
Rotaional Period 15.95 Earth days 15.95
Month duration (period around Saturn) 0.58 Earth months 0.58 Titan year (period around Sun) 29.5 Earth Years 29.5
Orbital eccentricity 0.029 1.74
Orbital inclination to Saturn’s Equator 0.33◦
-Orbital inclination to Ecliptic 29.6◦
1.3
Axial Tilt 0◦
0
Mean surface Temperature 94 K 0.33
Surface pressure 1.5 bar 1.5
Surface gravity 1.35 m s−2
0.14
One of the bodies in our Solar System is particularly relevant to the interests outlined in the previous paragraphs. Titan, Saturn’s biggest satellite, is similar to some models of the early Earth and its characteristics can teach us about our home world and other celestial bodies in general. Some orbital and physical characteristics of Titan are given in Table 1.1. Titan’s bulk composition is mainly water ice and rocky material (ESA,2005). It has a rocky center and several layers of ice at different pressures, with a possible liquid layer of water and ammonia between low and high pressure ice layers (Tobie et al.,
2005). In this sub-surface ocean, chemical evolution may also occur and early conditions inside Titan could have fostered the development of prebiotic chemistry and the possible emergence of life (Raulin et al., 2009). The surface is composed mainly of water ice and organics (Soderblom et al., 2009a). It is smooth, with few impact craters. It presents low height variation with the exception of some mountains of several hundred meters and several possible cryovolcanoes (Jaumann et al., 2009). Radar experiments about Titan’s surface revealed signs of land-like surfaces spattered with lakes, the only large, stable bodies of surface liquid known to exist anywhere other than on Earth. The lakes are made of liquid hydrocarbons (Stofan et al.,2007), which are an interesting environment from the astrobiological point of view, due to their potential to concentrate macromolecular species. Although the surface temperature (94 K,Fulchignoni et al.,2005) is too low for prebiotic chemistry to take place in Titan’s surface, the possibility of being warmed up by cometary impacts or internal heating during periods long enough to allow some kind of chemical evolution (Raulin,2005), as well as the possible presence of sub-surface liquid water-ammonia solution, are thrilling. Additionally, Titan is the only satellite in the Solar System known to have a thick, planet-like atmosphere. Even in the absence of life, the prebiotic conditions of the Titanian environment and the associated organic chemistry are of great interest. Complex and still not fully understood chemical reactions among a whole ‘zoo’ of organic molecules higher in the atmosphere produce organic aerosols, that precipitate to the surface. The formation of a UV-protective aerosol layer would protect eventual organics in the surface, the possibility of this mechanism taking place in a body with more life-friendly surface conditions, like a prebiotic Earth, adds relevance to the study of these processes. The production, evolution and delivery of these ‘basic blocks’ for life in the atmosphere is one of the main motivations of the studies of Titan from the astrobiological point of view. Titan can be considered as a frozen planetary-scale chemical reactor, some of the processes taking place in it having maybe taken place in early Earth
(in the atmosphere or other places, like oceanic hydrothermal vents (Reisse, 2005)). Consequently, characterizing and understanding Titan, and particularly its atmosphere, might help understand the processes that can lead to prebiotic chemistry in a planet.
1.1
Titan’s atmosphere
1.1.1 A short tale about an intriguing atmosphere
The interest about Titan’s atmosphere can be emphasized by a quick chronological review of some discoveries, studies and experiments that contributed to the actual knowledge of it. This short review focused on the upper atmosphere (although comments on lower layers will also be made) is intended to provide an historical context, as well as a short tale of progressive discovery of this fascinating atmosphere. Many important aspects will be omitted for simplicity and the reader is referred to the existing bibliography for further information. For example, Coustenis et al. (2009b), on which this section is largely based.
Jos´e Comas Sol`a claimed in 1908 to have observed limb darkening on Titan, and therefore an atmosphere. A few decades later James Jeans concluded, from his analysis of escape processes in atmospheres, that heavy gases could have been retained by Titan after its formation if temperatures between 60 - 100 K prevailed (Jeans, 1931). These gases could be, among others, ammonia, argon (Ar), neon (Ne), molecular nitrogen and methane. The presence of the atmosphere was confirmed by Gerald Kuiper in 1944, who actually detected methane in it (Kuiper,1944). The detection of methane implied a chemically evolved atmosphere, as methane requires carbon (C) and hydrogen (H), and the latter should have escaped from Titan long ago. The presence of the atmosphere was soon recognized as a unique characteristic of Titan among the other satellites.
New information about Titan atmosphere had to wait till the 1970s, when the main components of the atmosphere started to be elucidated. Trafton announced the detection of molecular hydrogen through infrared spectroscopic studies (Trafton,1972b), implying the presence of a molecular hydrogen (H2) escape inhibiting gas. At the same time,Trafton (1972a) determined a higher absorption than Kuiper in one of the IR bands of methane, meaning a higher abundance of CH4 or, again, the pres-ence of another undetected but abundant gas which would broaden CH4 bands via collisions. Hunten
(1973b,a) considered N2 or CH4 as the main constituent of the atmosphere, but the low abundances of methane and high effective pressure estimates in Titan derived shortly afterwards (Lutz et al., 1976) constrained methane to a minor component. Moreover, the absence of substantial quantities of NH3 led to the assumption that it could have been dissociated into N2 and H2, supporting the idea of N2 as the main component of the atmosphere. Contemporaneously, low albedo (Danielson et al.,1973) and polarization measurements of reflected radiation measured for Titan implied the presence of a visible-ultraviolet (VIS-UV) absorbing haze, which turned to be distributed around Titan (Veverka, 1973). Hypotheses on the composition of the haze pointed to complex organics. This ideas were supported by experiments and identification via observations in the thermal range of not only CH4 but also ethane (C2H6), ethylene (C2H4), and C2H2(Gillett et al.,1973;Gillett,1975). Thus the picture of condensed CH4 and a ’fog’ of polymers formed from the fragments of methane UV photolysis took form. The properties of this haze not being well known, any attempt of interpretation of spectroscopic observa-tions was (and still is) dependent on the assumpobserva-tions about the haze particles. The ’70s first models of Titan’s atmosphere concentrated on CH4 and hydrocarbons as main components (e.g. Strobel,1974). On the other hand, models about the formation of Titan including a N2atmosphere (Lewis,1971) and a high surface temperature derived from observations (Conklin et al.,1977), ledHunten and Morrison
tenths of bars. Subsequently, it was Strobel in 1982 who first modeled Titan’s atmospheric chemistry with N2 as the main species. At the end of the ’70s then, a few measurements and a lot of hypothesis set the temperature and pressure spanning a few order of magnitudes around actual values. The terrain was set, but new measurements were desperately needed.
The Voyager 1 flyby in 1980 shocked with an unpleasant surprise: the satellite was completely shrouded by the thick (optical depth 5) atmosphere. Nevertheless, the observations helped in finding some answers to the many questions about Titan’s atmosphere. Voyager images showed an hemispheric asymmetry, explained at that time in terms of variations in haze density, particle size and composition, as well as seasonal effects (Smith et al.,1982). A haze layer detached from the main haze was observed at about 300 km, although the properties of the haze were minimally constrained, and no model could reconcile the different measured properties of the haze. Analyses of the Voyager/Radio Science System (RSS) and Voyager/Infrared Interferometer Spectrometer (IRIS) data in the ’80s (e.g. Samuelson et al., 1981; Lindal et al., 1983; Lellouch et al., 1989) allowed to derive a satellite radius, surface pressure and temperature in close agreement with actual values. Combining different constraints from the experiments in Voyager, N2 was confirmed as the main constituent of the atmosphere. As they provide a method to directly probe N2 densities in the upper atmosphere, solar occultation measurements performed with the Voyager/UltraViolet Spectrometer (UVS) instrument played an important role in this determination (see e.g. Smith et al.,1982). Results from UVS also provided a value of thermospheric temperature of 186 K at 1265 km and a CH4 abundance of 8% at 1125 km. CH4 and other minor hydrocarbons were also confirmed from Voyager infrared data (e.g. Coustenis et al.,1989a). The confirmation of the presence of complex organics motivated the generation of lab experiments and of 1-D photochemical models. These models were also the basis of the knowledge of the thermal structure of the middle and upper atmosphere, much less characterized than the lower atmosphere. These new models (Strobel,1982;Yung et al.,1984) were based on chemical reactions in a N2-CH4 atmosphere, vertical transport modeled with an eddy diffusion coefficient profile. The main reactions were established and the results were the irreversible destruction of N2 and CH4 (the latter should have been completely destroyed by photolysis in some 106 years time), the production of many hydrocarbons and nitriles and H2, the latter escaping to space. The possible inventory of the chemical constituents kept growing, and the ideas of molecular complexity leading to solid phase products gain support, as more molecules and aerosols with properties similar to those of Titan were detected in new laboratory experiments, trying to reproduce the conditions in Titan’s atmosphere (Raulin et al.,1982;
Khare et al.,1984,1986;Mckay et al.,1989). One decade after the flyby, the molecules detected from Voyager data seemed to fall short compared to the variety of organics and derived macromolecules obtained in experiments and models, but this would not last for long.
By the end of the 20th century a more comprehensive picture and interpretation of the atmosphere emerged, supported by new observations. The complex hydrocarbons predicted in models, observed in laboratories or unexpected from these two sources started to be detected in the satellite. In addition to the analysis of IRIS data (Coustenis et al.,1989a,b) the detections were achieved using ground or Earth orbit observations, thanks to the development of high resolution capability instrumentation in the last 20 years of the 20th century, especially in the thermal infrared and mm/sub-mm ranges (and therefore limited to the lower atmospheric layers in Titan). This made it possible to obtain more precise abundance and temperature profiles, to detect new molecules and to probe the atmosphere at lower levels than Voyager. Examples of this detections are those of water (H2O) and benzene (C6H6) (Coustenis et al., 1989a, 2003) from ISO observations. Nevertheless the Voyager 1 observa-tions continued to be exploited for more than 2 decades after the flyby. From the analysis of IRIS data recorded over the north (winter) pole, Coustenis et al. (1991) showed an abundance of hydrocarbons increasing with altitude, consistent with species forming in the upper atmosphere and sinking in the
lower stratosphere. Still from IRIS data, an enhance towards northern (winter) latitudes of most of the minor hydrocarbons was observed (Coustenis and B´ezard, 1995). The new molecules detected motivated updates to the 1-D photochemical models in the ’90s (e.g.Toublanc et al.,1995;Lara et al.,
1996) and the observed latitudinal variations and associated temperature differences originated differ-ent explanations (Flasar and Conrath,1990;B´ezard et al.,1995). General circulation models (Hourdin et al., 1995) attacked these topics and provided a picture of summer pole to winter pole circulation above the stratosphere and opposite below it. During equinoxes this circulation would break into two circulation cells with upwelling at the equator. At the same time new efforts in the study of the haze lead to reconcile its properties measured by Voyager some 15 years before. This was achieved thanks to models that treated the aerosols as conglomerates of small (hundredths of µm) spherical particles (West and Smith, 1991; Rannou et al., 1995). As for the upper atmosphere, temperature profiles up to some 500 km altitude derived from a stellar occultation measured from the ground in 1998 (Sicardy et al., 1999) showed local structure with two inversion layers at 425 and 450 km. The observed structure motivated an interpretation based on waves braking in the upper stratosphere. Thus, when the 21st century started, thanks to Voyager and ground based measurements, main com-position, trace gases, pressure and temperature were constrained, although with a large span of values. But topics as the origin of N2 and methane remained open, and a vertical profile of CH4 uncertain. Whereas the first close taste of the satellite had provided constrains and confirmations for some of the old theories, the complex picture associated with Titan required more observations to understand it. In the first years of the 2000s Titan was experiencing its northern winter solstice, two thirds of a Titan year had passed from the Voyager 1 encounter and seasonal changes could be better studied, giving rise to new interpretations. Ground and Earth orbit measurements had been performed at different moments since the northern spring around 1980, when Voyager flew by the satellite. The latitudinal asymmetry observed by Voyager reversed during this period (Caldwell et al., 1992;
Coustenis et al., 2001). The circulation in the atmosphere was interpreted to be coupled with the distribution of haze and minor constituents (Rannou et al., 2002;Lebonnois et al.,2003), and better explained by a global circulation model coupled with a haze microphysical model (Rannou et al.,
2004). More photochemical models contributed to the knowledge about the haze (Wilson et al.,
2003;Wilson and Atreya,2003), explaining Titan’s haze as the result of coupled hydrocarbon-nitrile polymers and Polycyclic Aromatic Hydrocarbons (PAH). This fact assigned particular importance to benzene as link between the gas and the haze. But the pathways to haze formation were still missing. The models kept updating with new constraints, like the new profiles for N2 and other hydrocarbons provided byVervack et al. (2004) from a reanalysis of Voyager 1/UVS data, measured more than 20 years before. They derived thermospheric temperatures of ∼ 155 K, more in agreement with current values than the 186 K fromSmith et al.(1982). Notwithstanding the better knowledge of the thermal structure, the experiments simulating Titan’s atmosphere (e.g.Coll and Raulin,1998;Coll et al.,1999;
Ram´ırez et al.,2001;Ramirez and Navarro Gonzalez,2002;Imanaka et al.,2004) kept surprising due to the high order hydrocarbons and nitriles obtained, compared to the inventory detected in Titan. What is the degree of complexity achieved by the chemistry on Titan? What parameters dictate the circulation of the atmosphere? How variable is it? What is the origin of Titan’s methane? What is the nature of the surface, its composition and topography? These questions were still opened before the Cassini/Huygens mission, which would provide new answers, and questions.
The thirst for a new close look of Titan had to wait till the arrival to the Saturnian system of Cassini/Huygens in the end of 2004. Measurements from the Cassini orbiter and the Huygens probe to Titan have been analyzed since then, with new information becoming available after each Titan flyby, which continue in the present days (September 2013). These analyses contributed to solve some of the questions about Titan as well as to expand in location and time the measurements of the atmosphere.
Long after N2 was postulated as main atmosphere constituent, Cassini measurements support the idea that N2 was not primordial, but probably produced from photolyzed NH3. The Composite Infrared Spectrometer (CIRS) instrument on Cassini, with improved spectral resolution with respect to IRIS on Voyager, incremented our knowledge of the composition and temperature structure in the stratosphere. The trends observed in the stratosphere from Voyager data, with abundance of some hydrocarbons increasing with height and with an enrichment towards the north (winter) pole, were confirmed and the studies extended (see for example Vinatier et al., 2007, 2010). Neutral and ionic composition and temperature in the thermosphere above some 900 km were measured with unprecedented spatial resolution and frequency by the Ion and Neutral Mass Spectrometer (INMS). The Ultraviolet Imag-ing Spectrograph (UVIS) experiment complemented the mentioned instruments in altitude coverage, providing composition and temperature measurements of the thermosphere (Shemansky et al.,2005;
Koskinen et al., 2011;Capalbo et al.,2013), although published results derived from UVIS are fewer than those derived from CIRS and INMS. But new puzzling measurements arrived also with Cassini. Since 2005 INMS and the Cassini Plasma Spectrometer (CAPS) measured heavy organic neutrals (with up to 7 C atoms, including C6H6, e.g.Magee et al.,2009) and ions (of more than 13000 Da, e.g.
Coates et al.,2009) in the atmosphere, above 900 km. This led to a re-formulation of thermospheric chemistry and photochemical models, which started to include ion chemistry (Vuitton et al., 2007,
2008) and to re-analyze the paths to macromolecule formation (Lavvas et al.,2008a,b). Models before Cassini included hydrocarbons and nitriles, a few included thermosphere minor neutral. After Cassini, new species and reactions were included, particularly in the thermosphere. Observations along the Cassini mission showed interesting temporal and geographical/horizontal variability in the upper at-mosphere. The dependence of this variability on parameters like solar activity or magnetospheric interactions is still under study. M¨uller-Wodarg et al. (2008) suggest that Titan’s thermosphere is highly variable and dominated by strong dynamics, which are accompanied by an oblate shape of the atmosphere at those thermospheric heights. This picture diverges considerably from the global structure predicted in the pre-Cassini era by general circulation models which considered solar heating alone (likeMuller-Wodarg et al.,2000). Magnetospheric influence on thermospheric temperatures was also suggested (Westlake et al.,2011). The efforts to reconcile the measurements and understand the atmosphere continue till the present day, with new information arriving from Cassini and lab experi-ments, and new interpretation and models that let us layout a picture of the atmosphere in general, and the thermosphere particularly.
1.1.2 General description - state of knowledge
Composition
From all the experimental evidence and studies developed in the last century we can have a good idea about Titan’s atmosphere. In what follows, this text will focus on composition, temperature structure and variability of the upper atmosphere (above ∼500 km), referring to lower layers when suitable to underline a possible connection or explanation. The surface gravity of about 0.14 g makes Titan’s atmosphere much more extended than in the case of Earth, with an exobase around 1500 km (e.g. Westlake et al., 2011). It is composed mainly of N2, the main trace gas being CH4, followed by H2. Dissociation and ionization of N2 and CH4 in the upper atmosphere by UV radiation from the Sun and precipitating electrons, following by recombination of the products, give rise to different hydrocarbons (which in turn can give rise to polycyclic aromatic hydrocarbons) and nitriles (including the prebiotic HCN). Oxygenated species like H2O and carbon monoxide (CO) are also present, though less abundant than the species previously mentioned. Just as an example of the complexity of the composition, a table comparing some measurements and models from the bibliography is shown in
Figure 1.1.
Figure 1.1: Titan’s upper atmosphere composition from different measurements and models. From Soderblom et al. (2009b). Header of second column should read Lebonnois.
As a general rule for the trace gases, the higher the complexity of a molecule the less its abundance in the atmosphere. The vertical abundance profiles of the different species are affected by molecular diffusion in the upper atmosphere and by eddy mixing in lower layers, the borderline of these effects being the homopause. The homopause has been placed somewhere between 850 and 1100 km (Yelle et al., 2008; Cui et al., 2009; Vervack et al., 2004). N2, as the main component, can be considered in hydrostatic equilibrium, the abundance of other minor species are subject to source/sinks and transport phenomena. Sinks and sources greatly affect the vertical profiles of chemically active species. Those with a short chemical lifetime have its presence determined by chemical processes, those with a long chemical lifetime, are distributed according to transport and dynamical processes. Photochemical models predict that the molecular vertical mixing ratio profiles increase with height in the stratosphere, as the molecules are formed in the upper atmosphere, diffuse downwards and generally condense in the lower stratosphere. The abundance then decreases with altitude in the thermosphere above the production region. Models that are one dimensional should be representative of what is observed at mid latitudes. Mixing ratios of some species have been observed to increase with altitude in the stratosphere for southern (summer) and mid latitudes (see for example Vinatier et al.,2007, 2010), supporting the described behavior, although this is not the same for all latitudes as will be commented below. In the lower thermosphere number density profiles from UVIS (Koskinen et al., 2011) show maxima near the predicted production region for some species, and Shemansky et al.(2005) showed a depletion in the upper thermosphere for the same species. However the abundance profiles are not always monotonically increasing/decreasing with altitude below/above this ‘creation layer’, other interesting phenomena are observed. Shemansky et al.(2005) show two changes in the scale height of
the species (at about 700 and 1000 km), and the number density profiles from Koskinen et al.(2011) present a wavy behavior. Although they are not going to be treated in this essay, ions are another important component of Titan’s upper atmosphere (see e.g. Vuitton et al.,2009). Although limited to only one dimension, the characterization of the vertical distributions of atmospheric constituents is of fundamental importance to add to the global picture of the atmosphere. The main characteristics of the gaseous phase of the neutral upper atmosphere is somehow established, but the measurements and models of composition available today present some inconsistencies when contrasted with each other (see discrepancies in the following sections). Moreover, the consequences of such composition and its fluctuations around the average observed is still under study.
Aerosols
According to models, hydrocarbons and nitriles will form polyacetylene polymers, nitrile polymers, PAH polymers as well as aliphatic and aromatic copolymers (see for exampleWilson and Atreya,2003;
Lavvas et al.,2008b). These polymers could agglomerate and form organic haze particles or aerosols. The implications of this haze are manifold. It plays an important role in the atmospheric radiative balance, affecting the temperature structure; it also affects the radiative transfer and thus influences photolysis. The aerosol surface could also host heterogeneous processes (Lavvas et al., 2011). The astrobiological importance of this haze has been recognized since its detection some 40 years ago. The haze can precipitate onto the surface (and lakes) and undergo further chemical evolution according to surface conditions. Moreover, its UV protective nature can shield the surface from harmful radiation. The path to haze formation appears to take place all across the atmosphere, from seed particles to coagulation and then aggregation, to end up in a haze layer (see Lavvas et al.(2011) and Figure 1.2). What is the composition of Titan’s aerosols?, how are they formed? The efforts to answer these key
Figure 1.2: Complexification of Titan composition, from gas to aerosols (fromWaite et al.,2007)
questions about Titan’s atmosphere include laboratory experiments trying to reproduce the conditions in Titan’s atmosphere (Raulin et al.,1982; Khare et al., 1984, 1986;Mckay et al., 1989). They
pro-vided evidence that the complex organics formed out of the gas mixture can lead to solid compounds called ‘tholins’, with similar optical properties to those observed in Titan’s haze. However, it should be noted that the haze production mechanisms and resulting haze optical properties depend largely on the pressure, temperature and initial mixture (CH4/N2) of the experiment. This might imply that in different altitudes of the atmosphere the haze formation processes vary, leading to other key question: what are the aerosol distributions in time and space on Titan? Aerosols have been observed at altitudes as high as 1000 km (Liang et al., 2007) and down to the surface. Moreover, particles detected with mass >> 13000 Da at some 950 km and above (Coates et al., 2009) are likely aerosol precursors. But although their presence is unquestionable, their characteristics are elusive. Aerosol size and shape are important for their microphysics, but size depends on ion charge and a range of values are possible. High polarization and high forward scattering measured from Voyager and Pioneer lead to postulate that the particles were non spherical (West et al.,1983). The high polarization sug-gested loose aggregates, with small monomers of about 50 nm. The high forward scattering sugsug-gested a large area (equivalent sphere of 2 µm radius) with about 3000 monomers per each (Tomasko et al.,
2008). FUV stellar occultations provide little constraints for the aerosols characteristics (Koskinen et al.,2011). Nevertheless they can provide extinction vertical profiles in the lower thermosphere (600 - 800 km) and help characterize the aerosols’ horizontal/temporal distribution combining occultations measured for different geographical locations at different times. Either because of their astrobiological implications or their influence in Titan’s atmosphere thermal structure and dynamics, aerosols are a primary component of the atmosphere which can not be left aside in the efforts to understand it.
Vertical structure
The composition and vertical distribution of the gases and aerosols largely determine the vertical structure of Titan’s atmosphere. Heating and cooling from gases and haze balance in different ways at different altitudes and, although derived vertical profiles vary from model to model and from model to measurements, a rough temperature profile can be described. From 94 K at the surface, the tem-perature decreases with height in the troposphere, getting as low as about 70 K at a tropopause at approximately 50 km. The temperature increases in the stratosphere, avoiding N2 to condensate, and reaches values of about 180 K at the stratopause, located around 300 km. The existence of a mesosphere is not clear, although the presence of a temperature inversion at about 500 km due to the detached haze layer centered at around 550 km has been observed. Above this tentative mesopause the temperature increases with height in the thermosphere, until the profile becomes mainly isothermal with temperatures measured around 150 - 170 K. In this text the author will loosely refer to the lower thermosphere for altitudes roughly between 600 and 900 km and to the upper thermosphere meaning altitudes ranging from 900 to 1400 km. The Huygens Atmospheric Structure Instrument (HASI) ex-periment aboard the Huygens probe provided a one time/one location temperature profile from the surface up to 1400 km. Another unique measurement came from UVS on Voyager, from a solar occul-tation (Vervack et al.,2004). From UVIS occultationsShemansky et al.(2005) derived a temperature profile for the thermosphere. The main, regular, upper atmosphere temperature determinations come from INMS measurements.
The thermosphere is particularly important in the global picture of Titan’s atmosphere. Based on what has been exposed above, it can be thought of as a chemical factory that forms complex and heavy positive and negative ions and molecules (e.g. aromatic and nitrile species) in its upper layers, as a consequence of interaction with EUV radiation, energetic ions and electrons. This is the region where photolysis of N2 and CH4 occurs. The molecules and ions formed are thought to start the haze
formation processes, with aerosols detected as high as 1000 km (Liang et al.,2007). These particles fall through the upper layers and grow, and eventually become ubiquitous throughout the stratosphere, playing a fundamental role in heating Titan’s stratosphere and perhaps the thermosphere (Lavvas et al.,2009). UVIS solar occultations can provide an independent and reliable measurement of tem-perature in the upper atmosphere through the measurements of N2 profiles. Measured at different locations/times they are a valuable addition to the study of the thermal structure and its variability. This will be one of the main results of the present manuscript. All things considered, the average composition and temperature structure of the upper atmosphere of Titan is well characterized. At the same time, it presents a variability far from being completely interpreted.
Variability
Titan’s upper atmosphere presents a marked variability. Added to the variations observed before the arrival of Cassini to the Saturnian system, commented previously, the analyses of INMS data show that the abundances and temperatures can vary from flyby to flyby (see for exampleCui et al.,2009;
Magee et al.,2009). The models also predict variability in the atmosphere based on different factors, like solar zenith angle (De La Haye et al.,2008). For the purpose of analysis, one could try to classify the abundance and/or temperature variability in horizontal and temporal, according to the factors that might cause it, keeping in mind that the observed behavior can be the result of an inseparable combination of all of them and a correlation with any of these parameters might be absent. Moreover, the possibility of a bias in a reduced data set should be kept in mind.
The horizontal variability can be divided in latitudinal and longitudinal. There are several mani-festations of variations as a function of latitude. One of the manimani-festations is in composition.Vinatier et al.(2010) showed an enrichment of many hydrocarbons and nitrile species at low stratospheric alti-tude near the north (winter) pole. They also showed that the vertical profile of some species changes for northern latitudes and the general increase with altitude observed for equatorial or southern latitudes is not maintained. For the higher layers, INMS measurements of the thermosphere, above 1100 km, show a density increase towards the equator for some of the heavy hydrocarbons (M¨uller-Wodarg et al., 2008). This is reflected in the oblateness of the atmosphere obtained in the empirical model in the cited work and commented before. The latitudinal variations manifest also in temperature. Titan has a difference in temperature between the hemispheres at the stratospheric level. According to CIRS measurements, the stratosphere is colder in the winter pole, the stratopause being higher and warmer in this pole. In the thermosphere, some INMS measurements and models based on them also showed a decreasing temperature towards the winter pole (Cui et al.,2009;M¨uller-Wodarg et al.,
2008). However, Snowden et al. (2013) find no correlation between temperatures measured in the upper atmosphere and latitude in their analysis of INMS data. Thanks to general circulation models we know now that Titan presents a meridional circulation: at solstice, there is air flow and transport from summer pole to winter pole in the stratosphere and above and winter pole to summer pole be-low. During equinoxes the circulation breaks into two, with upwelling in the equator and downwelling in the poles, and there is a symmetry between north and south hemispheres. This ought to change over the course of Titan’s year (30 terrestrial years). The latitudinal transport also allows haze par-ticles to remain in the atmosphere for a longer time until they are deposited in the polar regions. The transport and accumulation of the haze (and hydrocarbons in a less important way) towards the winter hemisphere increases cooling there and powers the transport effect. This circulation takes part mainly in the stratosphere and mesosphere, the thermosphere being less affected by it. At the same time, recent seasonal changes in the altitude of the detached haze provide a strong argument for circulation-induced modification of the haze (Teanby et al.,2012). An origin in a transition from
monomer to fractal haze particles, combined with higher-altitude haze production and subsequent modification by high-altitude dynamical circulation, is required to provide a complete explanation. Their measurements show that the radiative effects of this complex chemistry are sufficient to drive dynamics up to very high altitudes, effectively linking chemical and dynamical processes well into the thermosphere (above 500 km), providing another motivation to study temperature in the upper atmosphere and its contribution to aerosol formation. Again, a variability analysis of composition and temperature in the low/mid thermosphere is lacking. UVIS measurements can provide valuable information in this topic, to be added to the existing datasets. In sum, while the latitudinal variability in Titan’s stratosphere is a combined effect of the dynamics of the atmosphere and the chemistry, the behavior of the thermosphere with latitude is still elusive.
The longitudinal variability is considered in this work as the variation in composition and temper-ature with Titan longitude. As Titan is tidaly locked to Saturn the same side of Titan faces Saturn at all times during its orbit, making longitude on Titan correspond directly to a region of interaction with the Saturn plasma environment (Saturn, anti Saturn, ram, or wake). Therefore any longitudinal variation would be related to magnetospheric interactions. Cui et al. (2009) divided the data from INMS into longitude bins and found that the Saturn side of Titan was warmer than the anti-Saturn side and the magnetospheric ram side was warmer than the wake side. However, the small number of samples available for the study made it impossible to determine a general latitude trend. The sparsity of longitude sampling also keptM¨uller-Wodarg et al.(2008) from deriving conclusions on the variability with these coordinates. No trends with longitude was observed in the analysis bySnowden et al. (2013). In short a variation of the thermosphere with longitude has not been observed.
Titan’s atmosphere presents also a temporal variability. For the purpose of analysis it can be divided into seasonal, solar cycle, diurnal and secular effects. The ∼27◦
tilt provide Titan seasonal effects. One Titan year equals some 30 Earth years and therefore more than one year passed from the Voyager 1 flyby till the present day (September 2013). Evidence of the seasonal effects started to be evident with a clear north/south albedo switch in 1980-1990 (Caldwell et al.,1992). The darker hemisphere in the blue spectral region being the one with more absorbing haze. As already commented, hemispheric differences in the stratosphere are consistent with a higher concentration of gases and haze in the winter pole (B´ezard et al.,1995;Lebonnois et al.,2003;Rannou et al.,2002), accompanied by an increase in cooling in this region. The changes observed are explained by the change in circulation in the lower atmosphere commented above. The thermosphere reacts faster than the lower layers, washing out seasonal effects, hindering their study. Apart from the mentioned Titan’s tilt, Saturn’s orbital eccentricity and associated 20% variation of solar radiation received at different points in the orbit affects the seasonal variations, mainly in the troposphere and stratosphere. The different distance to the Sun (9.03 to 10.04 AU between perihelium and aphelium) produces an hemispheric asymmetry for the same season. The southern summer has more solar input and is therefore hotter but shorter (at perihelion). Finally, it is worth mentioning that seasons don’t repeat perfectly, as there is interanual variability due to the solar cycle phase shift with respect to the seasons (Lockwood and Thompson,
2009).
Like other atmospheres, Titan’s is also influenced by the solar cycle. Since the ultraviolet input is the main driver of Titan’s photochemical gas and haze production, variations in UV and EUV solar radiation due to the solar cycle may produce a change in the thermosphere, with an 11-year periodicity. Long periods of observation are required to decorrelate such effects, and the relationship of Saturn magnetosphere with the solar cycle has to be considered too. The Voyager 1 flyby and most of the Cassini mission, which are the main sources of information we have on the thermosphere, occurred during solar maximum an minimum conditions, respectively. Although valuable as the only measurement of this kind for that period, the data from Voyager 1 flyby is understandably limited for
an analysis of variability. Finally, as the solar influence over Titan’s upper atmosphere has been at its relative weakest during most of the Cassini observations, no variability caused by variations in solar activity is expected for this more recent and extended data set.
Diurnal variability is defined by day/night differences. During 1 Titan day (16 Earth days) the atmosphere is exposed to different illumination conditions.De La Haye et al. (2008) presented a one-dimensional rotating model, at constant latitude and varying local-time, to take into account the diurnal variation effects, such as the ceasing of the solar flux induced mechanisms on the night side. The model showed large variations in the processes prevalent on the day compared to the night side. Surprisingly, the thermosphere day side is observed to be cooler than the night side in De La Haye et al.(2007) andCui et al.(2009).Westlake et al.(2011) found that the higher the Solar Zenith Angle of the observation the higher the temperature they get from a particular flyby. This is contradictory to what would be expected for a solar driven atmosphere. Diurnal variations are therefore present although, counterintuitively, not driven by solar input.
Apart of the diurnal cycle, other consequence of the rotation of Titan around Saturn is the interac-tion with different environments of its magnetosphere and with the solar wind. Based on an analysis of INMS data from 32 flybys, Westlake et al. (2011) suggested a correlation of the thermospheric temperature with the position of Titan in Saturn’s magnetosphere. They found that measurements performed in the plasma sheet lead to hotter temperatures than those in the plasma lobe, suggesting that magnetospheric particle precipitation causes the temperature variations observed. On the other hand, Snowden et al. (2013) found no correlation between the temperature of Titan’s thermosphere and ionospheric signatures of enhanced particle precipitation, suggesting that the correlation is not indicative of a physical connection. As the importance of the energy deposition rate of EUV pho-tons becomes less important than that of ions/electrons above some 1350 km, a different behavior of the temperature structure in different regions of the thermosphere could be a possibility. New mea-surements at the relevant altitudes and results from models including the effects of magnetospheric particles might shade some light to this controversial type of variability.
As a natural element, Titan’s atmosphere is subject to variations that do not fit in any of the clas-sifications made here, and that could be misinterpreted as one of them. Secular variation, long-term non-periodic variations, are possibly present but obviously impossible to characterize. Lockwood and Thompson (2009) report on 34 years of visible wavelength photometry of Titan, the most recent 4 years of observations, overlapping in seasonal phase with the first 4 years of the observation period. They find that Titan’s brightness varied from one Titan year to the next at the same seasonal phase, in this case largely due to the high stratospheric hazes. Moreover, upward waves can produce local-ized compositional and temperature changes. Waves have been observed in titan’s mesosphere and thermosphere (Fulchignoni et al., 2005; M¨uller-Wodarg et al., 2006), although the problem of wave forcing is currently under-constrained by observations. In any case, irregular phenomena are not to be discarded as explanation of some of the observed variations, especially when the data set analyzed is sparse.
The exposed general picture of Titan’s atmosphere, particularly its thermosphere, accounts for a complex system, at some 1500 million kilometers away from Earth, with a complex environment, studied by our scientific community for more than a century, and a bunch of measurements. Many of the measurements we are in possession of today were obtained in the last decade by an artificial satellite called Cassini. New data arrive periodically and new efforts in the form of laboratory studies and models are done continuously to improve the state of knowledge of Titan’s atmosphere.
1.2
Cassini investigations
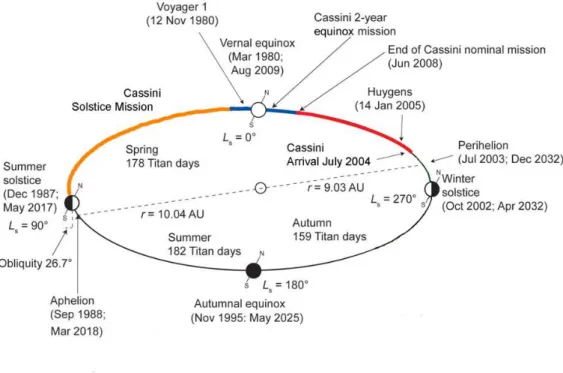
On October 1997 the Cassini-Huygens spacecraft was launched, starting one of the most challenging and fruitful endeavors of human space exploration. Its mission was to provide information to better understand the Saturnian system, with a particular interest in Titan. After several flybys and a Jupiter encounter the spacecraft entered the saturnian system. On January 2005 the Huygens probe, ejected from the spacecraft almost one month before, reached Titan. The first farthest ever human device at the surface of a celestial body, the probe collected information about Titan’s atmosphere along its passage through it. The Cassini spacecraft continued orbiting the saturnian system, visiting Titan regularly. A diagram of the Cassini missions coverage is shown in Figure 1.3. Currently in the middle of the Cassini Solstice mission (the second mission extension after the nominal and Equinox missions) these flybys are at the moment of writing still providing a mound of information about the satellite.
Figure 1.3: The entire primary, equinox, and solstice phases of the Cassini mission cover just half of a Saturn/Titan year (29.5 Earth days) (Credit: Ralph Lorenz).
Measurement requirements for the Cassini mission included:
• Determine the abundances of atmospheric constituents (including any noble gases). • Observe vertical and horizontal distributions of trace gases.
• Detect new molecules.
• Study the formation, composition and distribution of aerosols. • Map the global temperatures.
• Investigate seasonal effects in Titan’s atmosphere.
The Cassini ‘era’ provided lots of new tools to analyze Titan and its atmosphere. Among the instruments in the Cassini remote sensing plate, three of them are very relevant for the study of