Preliminary results of continuous oxygen measurement above
a Posidonia oceanica seagrass bed in the Bay of Calvi (Corsica)
Schiettecatte L.-S.
1, *
, Champenois W.
1
, Delille B.
1
, Borges A.V.
1
& J.-M. Beckers
2
The flows of carbon and nutrients in the coastal ocean are disproportionately high in comparison with its surface area; it receives massive inputs of organic matter and nutrients from land, exchanges large amounts of matter and energy with the open ocean across continental slopes and constitutes one of the most biogeochemically active areas of the biosphere. The production, degradation, export and burial of organic matter in coastal waters are general much higher than in the open ocean. However, the ecosystem metabolic status of the coastal ocean as net autotrophic or net heterotrophic has been the subject of a long lived debate. One of the sources of this debate is the lack of data to fully capture the temporal variability of organic carbon cycling in the highly dynamics coastal ecosystems. Indeed, a recent exhaustive literature review of ecosystem metabolic estimates in European coastal waters did not allow to conclude unambiguously on their trophic status, albeit these are among the more thoroughly studied sites in the world (Gazeau et al. 2004, Estuarine, Coastal and Shelf Science, 60(4): 673-694). Gazeau et al. (2005, Marine Ecology Progress Series, 301, 23-41) reviewed the advantages and caveats of several methods to estimate net ecosystem metabolism (NEP), and recommended the use of integrative mass balance approaches. With the recent development of reliable and accurate oxygen sensors (optodes), NEP can be determined from the temporal O2change from high temporal resolution
moored measurements.
Material and methods
Three Aanderaa Oxygen Optodes (Figures 2 and 4) were deployed on a mooring at 4, 7and 9 m. depth above a P.
oceanicaseagrass bed (10 m depth) in the Bay of Calvi (red point Figure 1, from Gobert et al. 2001, Hydrobiologia 455, 121-125), outside the Oceanographic Station STARESO. Degree in saturation of oxygen (%O2) and temperature were
recorded every 30 mns. An Anderaa cup anemometer was deployed above the station at 11.8 height, recording wind speed every hours. Wind speed were corrected to 10m height (U10) according to Johnson (1999, Coastal engineering,
39, 263-269). Air-sea O2fluxes (FO2)were computed every hours using the k-wind relationship given by Wanninkhof
(1992, Journal of Geophysical Research-Oceans, 97 (C5), 7373-7382). For NEP (with NEP = GPP-R, cf. equations 1 and 2) computations, the water column was divided into 5 boxes (surface-5m, 6m, 7m, 8m and 9 to 10m).
With n and d referring to night and day hours (H), w to the whole water column, FnO2and FdO2to air-sea O2fluxes over
respectively the night and day, Rdto respiration during daytime. [O2] is the concentration of oxygen in the whole water
column.
Results and Discussion
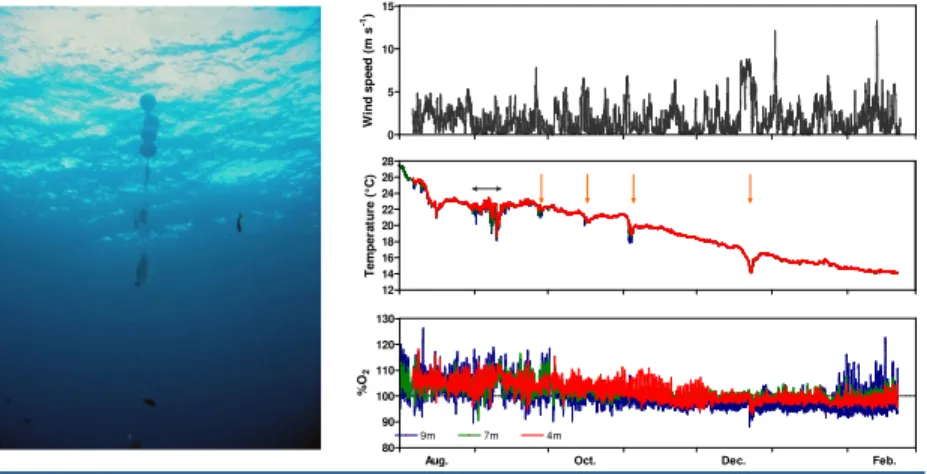
Figures 3 show results from U10, seawater temperature and %O2at the 3 depths. Water column was generally
well-mixed and seawater temperature declined from summer (28°C) to winter (14°C). Over a short period (grey cross), a slight thermal stratification was observed during low wind speed event. Consecutive to North-East wind speeds, offshore waters (characterized by lower temperature) were introduced to the system, as noticed by a drop of the seawater temperature (red crosses) and a transient thermal stratification. Daily %O2signal, associated to light availability, was
well captured in the data sets showing highest %O2and daily signals (%O2increase during day and decrease at night)
at 9m depth consistent with the biological activities effect of the P. oceanica on the water column. Daily and seasonal signals of %O2dropped from summer to January, before increasing again in February, related to biological activities of
the seagrass meadow.
This is consistent with results from Figure 5 on the NEP computations in the water column averaged over a month. Over the studied period the system was autotrophic with highest values in August (9 mmol O2m-2d-1). The system tends
toward heterotrophy (-3 mmol O2m-2d-1) during fall-winter whereas production showed an increase around February (3
mmol O2m-2d-1). The GPP was significantly well correlated with the respiration. Overall NEP values were consistent
with the results from Barron et al (2006, Estuaries and Coasts, 29 (3), 417-426) from O2measurements in incubations
chambers methods in the Magalluf Bay (Mallorca Island, Spain).
http://www.co2.ulg.ac.be/
European Geosciences Union
1
Chemical Oceanography Unit, B5, University of Liège, Belgium
General Assembly 2007
2GHER, B5, University of Liège, Belgium
Vienna, Austria, 15 – 20 Apr.07
Laure-Sophie.Schiettecatte@ulg.ac.be
Figure 2 (left): Picture of the moorage. Figure 3 (right): Seasonal profil of U
10(top),
seawater temperature (middle) and %O
2(bottom) at 4, 7 and 9 m depth.
Figure 4 (left): Picture of an oxygen sensor. Figure 5 (right): monthly averaged NEP
(in mmol O
2m
-2d
-1, top) and relationship betwenn the gross primary production
(GPP) and respiration (R, bottom) for the water column.
2 2 224
2
1O
F
H
]
[O
]
[O
)R
(
n n w,n w,n−
−
=
×
+
−
+
+
=
2 +1 2 21
)GPP
([O
]
[O
]
)
R
F
O
(
w,d w,d d dAug. Oct. Dec. Feb.
-5 0 5 10 15 N E P ( m m o l O2 m -2 d -1) 0 100 200 300 400 500 600 -750 -500 -250 0 R = -0.98 GPP + 0.6 r2= 0.92 GPP (mmol O2 m-2 d-1 ) R ( m m o l O2 m -2 d -1) Figure 1 0 5 10 15 W in d s p e e d ( m s -1) 12 14 16 18 20 22 24 26 28 T e m p e ra tu re ( °C )
Aug. Oct. Dec. Feb.
80 90 100 110 120 130 9m 7m 4m % O2