Volcanic in
fluence of Mt. Fuji on the watershed of Lake Motosu and its
impact on the lacustrine sedimentary record
Laura Lamair
a,j,⁎
, Aurélia Hubert-Ferrari
a, Shinya Yamamoto
b, Meriam El Ouahabi
c,
Jacqueline Vander Auwera
c, Stephen Obrochta
d, Evelien Boes
e, Atsunori Nakamura
f, Osamu Fujiwara
f,
Masanobu Shishikura
f, Sabine Schmidt
g, Giuseppe Siani
h, Yosuke Miyairi
i, Yusuke Yokoyama
i,
Marc De Batist
e, Vanessa M.A. Heyvaert
e,j, QuakeRecNankai Team
1a
Department of Geography, University of Liège, Clos Mercator 3, 4000 Liège, Belgium
b
Mount Fuji Research Institute, Yamanashi Prefectural Government, 5597-1 Kenmarubi, Kamiyoshida, Fujiyoshida, Yamanashi 403-0005, Japan
cDepartment of Geology, University of Liège, Allée du six août 12, 4000 Liège, Belgium
dGraduate School of Earth Resource Science, Akita University, Tegatagakuen-machi1-1, Akita City 010-8502, Japan e
Department of Geology, Ghent University, Krijgslaan 281, 9000 Ghent, Belgium
f
Geological Survey of Japan, National Institute of Advanced Industrial Science and Technology (AIST), Higashi 1-1-1,Tsukuba, Ibaraki 305-8567, Japan
g
UMR5805 EPOC, University of Bordeaux, Avenue Geoffroy Saint-Hilaire, 33615 Pessac, France
h
GEOPS, University of Paris Sud, Rue du Belvédère, 91400 Orsay, France
i
Atmosphere and Ocean Research Institute, University of Tokyo, Kashiwanoha 5-1-5, Kashiwa-shi, Chiba 277-8564, Japan
jGeological Survey of Belgium, Royal Belgian Institute of Natural Sciences, Jennerstraat 13, 1000 Brussels, Belgium
a b s t r a c t
a r t i c l e i n f o
Article history: Received 7 August 2017
Received in revised form 13 November 2017 Accepted 14 November 2017
Available online 17 November 2017 Editor: Dr. J. Knight
Lacustrine sediments are particularly sensitive to modifications within the lake catchment. In a volcanic area, sedimentation rates are directly affected by the history of the volcano and its eruptions. Here, we in-vestigate the impact of Mt. Fuji Volcano (Japan) on Lake Motosu and its watershed. The lacustrine infill is studied by combining seismic reflection profiles and sediment cores. We show evidence of changes in sed-imentation patterns during the depositional history of Lake Motosu. The frequency of large mass-transport deposits recorded within the lake decreases over the Holocene. Before ~ 8000 cal yr BP, large sublacustrine landslides and turbidites werefilling the lacustrine depression. After 8000 cal yr BP, only one large sublacustrine landslide was recorded. The change in sedimentation pattern coincides with a change in sed-iment accumulation rate. Over the last 8000 cal yr BP, the sedsed-iment accumulation rate was not sufficient enough to produce large sublacustrine slope failures. Consequently, the frequency of large mass-transport deposits decreased and only turbidites resulting from surficial slope reworking occurred. These constitute the main sedimentary infill of the deep basin. We link the change in sediment accumulation rate with (i) climate and vegetation changes; and (ii) the Mt. Fuji eruptions which affected the Lake Motosu watershed by reducing its size and strongly modified its topography. Moreover, this study highlights that the deposition of turbidites in the deep basin of Lake Motosu is mainly controlled by the paleobathymetry of the lakefloor. Two large mass-transport deposits, occurring around ~8000 cal yr BP and ~2000 cal yr BP respectively, modified the paleobathymetry of the lakefloor and therefore changed the turbidite depositional pattern of Lake Motosu.
© 2017 Elsevier B.V. All rights reserved.
Keywords: Lake Motosu Mount Fuji Volcano Mass-transport deposits Turbidites
Sediment accumulation rateLake Motosu Mount Fuji
Volcano
Mass-transport deposits Turbidites
Sediment accumulation rate
1. Introduction
Lacustrine sediments can provide a continuous and high-resolution record of environmental changes that have impacted the lake and its catchment (Last and Smol, 2001). Lakes behave like
receptacles and are sensitive to changes in their catchment. Extreme catchment modifications can occur in volcanic areas, due to deposi-tion of eruptive products (e.g., tephra fall-out, lavaflows, pyroclastic flows;Waldron, 1967; Collins and Dunne, 1986; Major et al., 1996), collapse of the volcanic structure (e.g., volcanoflanks, extruded
lava domes) and large mass movements (e.g.,Kadomura et al.,
1983; Kadomura and Chinen, 1995; Oguchi et al., 2001). At present, the response of lacustrine sedimentary systems on volcanically
induced catchment modifications remains poorly documented.
⁎ Corresponding author.
E-mail address:[email protected](L. Lamair).
1
Members of the QuakeRecNankai team: Ed Garrett, Helmut Brückner, Svenja Riedesel, Koen De Rycker, Jan Walstra.
https://doi.org/10.1016/j.sedgeo.2017.11.010 0037-0738/© 2017 Elsevier B.V. All rights reserved.
Contents lists available atScienceDirect
Sedimentary Geology
In this study, we investigate the sedimentary infill of Lake Motosu in Japan (Fig. 1), to better understand the impact of Mt. Fuji volcanic activity on the sedimentary processes in the lake. Lake Motosu, one of the Fuji Five Lakes, is located at the foot of the northwesternflank of Mt. Fuji Volcano. The entire Fuji Five Lakes area has been impacted by numerous effusive and explosive volcanic eruptions of Mt. Fuji (e.g.,Tsuya, 1955; Machida, 1964; Miyaji, 1988, 2007) since ~ 100 kyr (Machida, 1964, 2007).
In order to assess the long-term impact of Mt. Fuji activity on lacus-trine sedimentation during the Holocene, we study the sedimentary infill of Lake Motosu using high-resolution seismic reflection profiles and sediment cores. High-resolution seismic reflection profiles are used (i) to identify the characteristics and architecture of the sedimen-tary infill, and (ii) to understand the spatial and temporal evolution of the sedimentary infill in association with Mt. Fuji activity. Two types of sediment cores were collected, short gravity cores and longer piston cores. We performed a high-resolution multi-proxy analysis of the
short cores to identify and characterize the different sedimentary facies. The piston cores were employed to provide time constraints regarding the sedimentary infill. The two data sets are used to better understand sediment dynamics and its evolution during the Holocene. Finally, the observed changes are discussed with respect to two driving factors: climate change and modifications of the lacustrine watershed linked with the volcanic activity of Mt. Fuji.
2. Setting
2.1. Geographical setting
Lake Motosu (35°27′50″ N, 138°35′10″ E; 897 m above sea level (asl)) is one of the Fuji Five Lakes, along with Lakes Shoji, Sai, Kawaguchi and Yamanaka. The lake was formed as the result of natural damming by lavaflows and existed throughout the Holocene (Aramaki et al., 2007). Lake Motosu and its catchment cover areas of 4.7 km2and
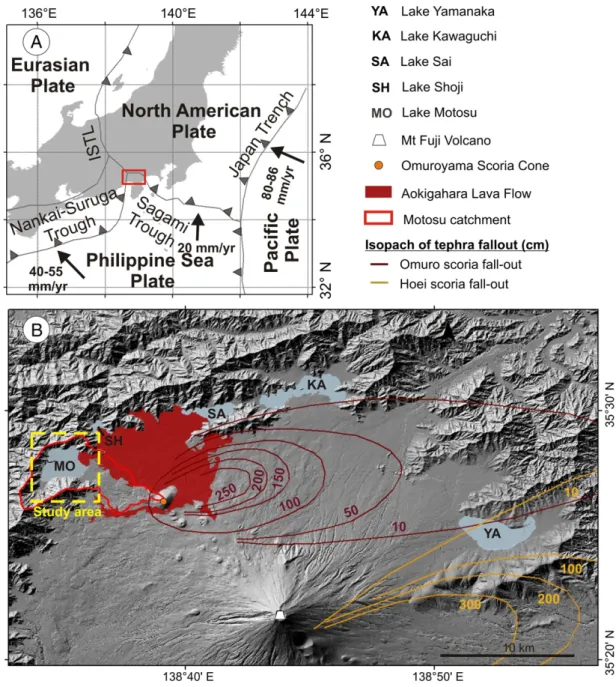
Fig. 1. Setting of the study area. (A) General localization of Lake Motosu on Honshu Island (Japan) with respect to the different plate boundaries. (B) Shaded topography with Fuji Five Lakes (Lake Yamanaka, Lake Kawaguchi, Lake Sai, Lake Shoji, Lake Motosu) and Mt. Fuji Volcano. The tephra fallout isopachs in cm of the Omuro (3260–3056 cal yr BP;Yamamoto et al., 2005) and Hoei (CE 1707) eruptions are indicated in brown and in orange, afterMachida (1964). The spatial distribution of Aokigahara lavaflow (CE 864) is shown in red (afterTakada et al., 2016).
201 L. Lamair et al. / Sedimentary Geology 363 (2018) 200–220
24.45 km2, respectively. The maximum water depth is 125 m. The lake's
water supply consists of rainfall, surface run-off and underground water originating from the Mt. Fuji Volcano and the Misaka Mountains. More-over, a network of ephemeral rivers, activated during torrential rain events in the typhoon season from August to October, feeds the lake (Tsuya et al., 1988).
The presence of an active alluvial fan (~0.4 km2) in the southwestern
end of Lake Motosu (labeled“A” inFig. 2) is indicative of seasonal inflow of water and bedload discharge into the lake. Surface water, originating from snow melt and rain showers, easily percolates through the highly permeable lavaflow deposits and pyroclastic rocks from Mt. Fuji, creating large aquifers at greater depth (Koshimizu and Tomura, 2000; Adhikari, 2014). According to Koshimizu and Tomura (2000), the current contribution of underground water to Lake Motosu is very lim-ited (1.2%). Because Lake Motosu has no outlet, its water level is mainly controlled by the seasonal balance between rain and evaporation. Based on annual monitoring from 1980 to 1991, the lake water levelfluctuated between 896 m asl and 906 m asl (Herath et al., 1992).
2.2. Tectonic setting
The Fuji Five Lakes are located close to the triple junction of the North American Plate, the Eurasian Plate and the Philippine Sea Plate (Fig. 1). Thefirst plate boundary affecting the Fuji Five Lakes area is marked by the Nankai-Suruga Trough, which represents the offshore subducting boundary of the Philippine Sea Plate underneath the Eurasian Plate at a rate of 40–55 mm/yr in its central part (Seno et al., 1993, 1996; Mazzotti et al., 2000; DeMets et al., 2010; Loveless and Meade, 2010). The second plate boundary, marked by the Sagami Trough, corresponds to the subduction of the Philippine Sea Plate beneath the North American Plate at an average rate of 20 mm/yr (Loveless and Meade, 2010). Further east on Honshu, the Pacific Plate subducts underneath the North American Plate and Philippine Sea Plate, forming the Japan Trench, with average convergence rates of 80–86 mm/yr (DeMets et al., 2010). The present-day plate boundary between the North American Plate to the east and the Eurasian plate to the west corresponds to the Itoigawa-Shizuoka Tectonic Line,
a major inland fault system (Nakamura, 1983; Wei and Seno, 1998; Taira, 2001).
2.3. Geological setting and volcanic history
The geology of the Fuji Five Lakes area is strongly influenced by the past activity of Mt. Fuji (3776 m asl), a stratovolcano. The volcano is characterized by highly variable eruptive style, consisting of Plinian
and sub-Plinian eruptions producing pyroclastic and lava flows
(Takada et al., 2013). The eruptions are basaltic to andesitic.
According to tephra studies, the volcanic activity of Mt. Fuji started ~100 kyr BP (Machida, 1964, 2007). Its volcanic history is divided into two main stages, linked to the development and activity of the Older Fuji Volcano (before 17 cal kyr BP) and the Younger Fuji Volcano (after 17 cal kyr BP;Tsuya et al., 1988; Miyaji, 1988; Takada et al., 2016). The Younger Fuji Volcano is mainly basaltic. The eruptive history of the Younger Fuji Volcano consists of 5 stages (Miyaji, 2007). During the Fujinomiya stage (from 17 to 8 cal kyr BP), a significant volume of lavaflows (min. 20.2 km3
Dense-Rock Equivalent/kyr) was deposited. During the Subashiri-a stage (from 8000 to 5600 cal yr BP), the Younger Fuji Volcano was very quiet, with small-scale intermittent, explosive eruptions. The Subashiri-b stage (5600–3500 cal yr BP) was character-ized by small-scale pyroclasticflows, medium-scale lava flows and in-termittent explosive eruptions. During the Subashiri-c stage (3500 to 2300 cal yr BP), continuous medium-scale explosive eruptions from the summit crater were recorded. During the Subashiri-d stage (2300 cal yr BP to the present day), small-scale pyroclasticflows and ex-plosive eruptions, associated with lavaflows, were emitted from the flank craters. Mt. Fuji volcanic activity has been more reduced over the last 900 years apart from the CE 1511 (Tsuya, 1955), CE 1560 (Tsuya, 1955) and CE 1707 Hōei eruptions (Yamamoto et al., 2005).
The Motosu catchment is composed of sedimentary and volcaniclastic rocks of the Furusekigawa and Tokiwa Formations (pyroclastics and basaltic lava, mudstone, sandstone, dacite and tuff) to the south, to the west and to the north of Lake Motosu. To the east and to the south-east of the lake, the catchment consists of younger volcanic products (Figs. 1, 2).
Fig. 2. Seismic reflection grid and coring locations with in the background, the geological map (modified afterTakada et al., 2016andOzaki et al., 2002) and bathymetry of the lake (modified afterGSI, 1964). The high-resolution pinger seismic reflection profiles are represented by black dashed lines, and the four low-resolution and deep penetration seismic reflection profiles (YIES, 2004) are marked with purple dashed lines. The coring locations are indicated with black dots for gravity cores and black triangles for piston cores. Drill cores taken in 1998 are indicated with black squares. MO-1 and MO-2 are inland drill cores (Koshimizu et al., 2002, 2007; YIES, 2004) whereas MO-4 and MO-5 have been taken within the lake (Koshimizu et al., 2002, 2007; YIES, 2004). The alluvial fan, labeled“A”, corresponds to the southwest active alluvial fan.
Lake Motosu, located to the northwest of Mt. Fuji, is relatively protected from explosive eruptions because of the existence of domi-nant westerly winds (Fig. 1). However, the Lake Motosu catchment was impacted by several pyroclastic falls during its history. The Omuro eruption (3260–3056 cal yr BP;Yamamoto et al., 2005), originating from a vent close to Lake Motosu, caused the deposition of a large scoria cone (Fig. 1). At least three lavaflows reached the surroundings of Lake Motosu: i) the Motosu Lava Flow, ii) the Motosuko Lava Flow are located to the southeast of the lake, and iii) the Aokigahara Lava Flow entered the lake from the east (Fig. 2). The exact ages of thefirst two lava flows are estimated between 13,860 and 10,575 cal yr BP based on their stratigraphic position (Takada et al., 2016) and14C dating performed on lavaflows in the area (Yamamoto et al., 2005). The Aokigahara Lava Flow occurred in CE 864 (Obata and Umino, 1999) (Fig. 1).
Boreholes drilled along the eastern edge of the lake show that the first damming of the lake by a lava flow occurred after 19,664– 20,350 cal yr BP (Koshimizu et al., 2002, 2007; YIES, 2004). Since that time, ~ 160 m of lava has accumulated (information from drilling core MO-2;Koshimizu et al., 2002, 2007). The last damming was caused by the CE 864 Aokigahara Lava Flow, with a minimum thickness of ~ 30 m (information from drilling core MO-1;YIES, 2004; Koshimizu et al., 2007).
3. Materials and methods 3.1. Seismic reflection data
We investigated the sedimentary architecture of Lake Motosu with a high-resolution GEOPULSE pinger system (3.5 kHz). A GPS was used for navigation and positioning, with a horizontal accuracy of 5 m. The data were recorded digitally on an iXSEA Delph Seismic acquisition system. We acquired 21 seismic lines with a total length of 39 km. The seismic reflection grid is presented inFig. 2. IHS Kingdom seismic software was used for seismic-stratigraphic processing, visualization and geologi-cal interpretation. Picked seismic horizons were exported and imported in ArcGIS 10.3.1 to create spatial distribution maps. In addition, four old seismic lines in paper format, acquired by Yamanashi Institute of Environmental Sciences in 1997 and with a total length of ~ 8.5 km, were digitized and georeferenced in ArcGIS 10.3.1. The two-way travel time (TWT) were converted in meters using a sound velocity of 1480 ms−1for the water and 1600 ms−1for the subsurface depths. The pinger seismic profiles image the upper ~19 m of the sedimentary infill, whereas the older seismic reflection profiles with a lower resolu-tion image the lake bottom up to a depth of ~20–25 m.
3.2. Seismic patterns, seismic stratigraphy and sedimentary infill The seismic facies analysis is based on seismic reflection parameters and reflector architecture. In this study, we use the term mass-transport deposit (MTD) to designate landslide deposits. On seismic reflection profiles, MTDs appear as units with a transparent to chaotic seismic fa-cies and a wedge- or lens-shaped geometry. The upper boundary of the chaotic facies can be irregular and hummocky (e.g.,Schnellmann et al., 2005; Moernaut and De Batist, 2011; Van Daele et al., 2013). We use the term megaturbidites (Bouma, 1987) for turbidites comprising a ho-mogeneous upper part (i.e., homogenites,Kastens and Cita, 1981; Siegenthaler et al., 1987; Chapron et al., 1999) with a thickness larger than 20 cm, i.e., exceeding the resolution of the seismic reflection profiles (ca. 20 cm). On seismic reflection profiles, large turbidites or megaturbidites are defined as very low-amplitude/transparent seismic
facies showing lens-shaped and ponded geometries (Siegenthaler
et al., 1987; Chapron et al., 1999; Schnellmann et al., 2002; Bertrand et al., 2008; Van Daele et al., 2013). They tend to infill the deepest part of the basin (e.g.,Schnellmann et al., 2002; Fanetti et al., 2008; Praet et al., 2017). These seismic patterns can be easily identified thanks to
the contrast with continuous reflections produced by non-disturbed deposits (background sedimentation). High-amplitude continuous seismic reflections are attributed to coarse sediments. In this specific volcanic context, they are interpreted to correspond to tephra fall-out (i.e., strong seismic reflectors draping the morphology), or to coarse-grained sediment related to the basal coarse-coarse-grained part of turbidites (Ta) in Bouma sequence (Bouma, 1962) (i.e., strong reflectors ponding in morphologically low areas).
Identified MTDs are mapped to construct an inventory of MTDs in Lake Motosu. The MTD inventory is limited by the acoustic penetration of the seismic signal, the seismic resolution and the occurrence of acous-tic blanking. Deposits that are thinner than the pinger seismic resolution (ca. 20 cm) cannot be recognized. In the eastern and central part of the lake, blanking occurs below ~ 175 ms TWT and ~ 181 ms TWT, respec-tively, because of the presence of thick MTDs (i.e., MTD 10 and MTD 13). We calculate the volume of each MTD using their areal extent and average thickness. Some MTDs are only imaged in a single seismic line. Therefore, we assume that their spatial extent is restricted to the distance between two seismic lines (~ 100 m). For others (MTDs 1 to 9), their full extent cannot be evaluated because of widespread blanking in the central part of the lake below ~181 ms TWT. Calculated areas and volumes thus represent minimum values.
To assess MTD synchronicity and characterize sedimentation rates in Lake Motosu, we map isochrones, i.e., strong seismic reflectors that are present throughout the lake basin and which hence represent synchro-nous deposition. Two isochrons are defined in the seismic reflection grid and two isopachs are calculated. Isopachs are used to determine the change in the depositional dynamics of the basin (seeSection 4.6). 3.3. Coring and core analysis
3.3.1. Gravity cores
We collected 5 short cores (65–81 cm) from the bottom of the lake, using a UWITEC gravity corer in 2014. The coring locations are defined based on interpretation of the seismic profiles and are shown inFig. 2. Cores were scanned for imagery (linescan imaging) and magnetic susceptibility using a Geotek MSCL core scanner at 2 mm resolution. X-ray radiography was performed on all the cores to identify sedimen-tary structures not visible by the naked eye. Histogram equalization in CorelPHOTO PAINT X5 was used on the digital core images in order to create enhanced RGB images, which were used for core correlation and facies characterization. XRF data were acquired using an Avaatech core scanner. The short cores MOT14-5B and MOT14-4B were scanned at a resolution of 2 mm: (1) with an X-ray current of 0.75 mA, at 40 s count time and 30 kV X-ray voltage for measuring the heavy chemical elements (Cu, Zn, Br, Rb, Sr, Y, Zr, Nb, Pb, Bi); (2) with an X-ray current of 1.2 mA, at 15 s count time and 15 kV X-ray voltage for light chemical elements (Al, Si, P, S, Ca, Ti, Cr, Mn, Fe). Zr (cps) and Ti (cps) were used as proxies for terrigenous input (e.g.,Kylander et al., 2011), as well as Sr (cps) due to the volcanic setting of the study area (Stansell et al., 2013). Br was employed as a proxy for organic matter (e.g.,Kalugin et al., 2007). To perform quantitative chemical analyses of the scoria layers, representative samples were collected from the short core MOT14-1A and ground in an agate mortar. Fused glass discs were prepared by mixing 0.35 g of rock powder previously dried at 1000 °C for 2 h with lithium tetra- and meta-borate. These glass discs were used to measure major elements (Si, Ti, Al, Fe, Mn, Mg, Ca, Na, K) by X-rayfluorescence (PERFORM'X). The quantification error was b0.2% for Si, ~0.1% for Fe, Al, Ca, ~0.05% for Ti and ~0.04% for Mn, Mg, Na, K and P.
The bulk and clay mineralogy of sediments was investigated on a few samples. The XRD spectra were acquired on a PANalytical Empyrean XRD for mineralogy and a Bruker D8 ADVANCE diffractometer equipped with CuKα radiation (λ = 1.518 Ǻ) for clay analysis. The clay fraction (b2 μm) was separated by settling in a water column and subsequently mounted as oriented aggregates on glass slides (Moore and Reynolds, 1989). Three X-ray spectra are obtained on slides prepared under 203 L. Lamair et al. / Sedimentary Geology 363 (2018) 200–220
different experimental conditions: air-dried, ethylene glycol solvated for 24 h and heated at 500 °C for 4 h. The semi-quantitative determi-nation (±5%) of the clay minerals was based on the heights of
diagnos-tic peaks measured above the background noise (Biscaye, 1965;
Holtzapffel, 1985).
Grain-size analysis was performed on two selected cores using a Malvern Mastersizer 2000 with a down-core resolution of 0.5 cm, allowing us (i) to characterize the different depositional sedimentary environments of Lake Motosu (i.e., platforms using short core MOT14-1A and the deep basin using short core MOT14-5B), and (ii) to differen-tiate sedimentary event deposits from background sedimentation (i.e., hemipelagite). In order to avoid clayflocculation, 2 ml of 50 g/L of sodium hexametaphosphate (calgon) was added for each grain-size measurement. Loss-on-ignition was done at 1 cm resolution. The sam-ples were dried at 105 °C for 24 h and burned at 550 °C for 24 h. The water, the organic matter (OM) and the Ca contents were calculated followingHeiri et al. (2001). Core-to-core correlations were made by combining RGB images and geophysical properties of the sediment.
SEM analyses were conducted on sedimentary facies in order to investigate the state of preservation of diatoms, which was used as a proxy for the depositional dynamics (e.g., background sedimentation versus turbidites). Background sedimentation would be characterized by intact diatoms, whereas turbiditic sedimentation would result in numerous broken diatom frustules. This contrast came out in the study of lacustrine sediments in Chili impacted by ground shaking (Van Daele, 2013).
3.3.2. Piston cores
We conducted a piston coring campaign in Lake Motosu in 2015 using a UWITEC coring platform. Two sites were investigated: the 6.74 m long piston core MOT15-1 samples the deepflat basin (Fig. 2), and the 3.70 m long piston core MOT15-2 samples the basin edge. Cores were split, scanned for imagery (linescan imaging) and described. In addition to our data set, two piston cores (MO-5, 130 cm and MO-4, 160 cm) were taken in 1998 at the bottom of Lake Motosu by the Yamanashi Institute of Environmental Sciences (Uchiyama and Koshimizu, 2003; YIES, 2004) (Fig. 2). During the same campaign, two boreholes (MO-1 and MO-2) were drilled onshore, through the lava flows (Koshimizu et al., 2002, 2007; YIES, 2004).
The long piston cores are used in this paper (i) to test if the sedimen-tary facies identified in the short cores are also representative of the long-term sedimentation; (ii) to ground-truth the nature of the differ-ent seismic facies; and (iii) to establish the chronology of Lake Motosu's sedimentary infill.
3.3.3. Chronology
We defined the chronology of the recent sedimentary infill of
Lake Motosu based on210Pb and137Cs depth profiles.210
Pb (T1/2=
22.3 years) is a naturally occurring radionuclide widely used to esti-mate sediment accumulation rates and ages over the last century (seeKirchner, 2011, among others).137Cs (T
1/2= 30 years) is an
artificial radionuclide, that has well-known pulse inputs related to the atmospheric nuclear weapon tests in the early 1960′s (maximum atmospheric fallout in 1963 in the northern hemisphere) and to recent nuclear accident (Chernobyl in 1986; Fukushima in 2011). We sampled the upper 20 cm of core MOT14-5B. Activities of210Pb,226Ra and137Cs
were measured using a low-background, high-efficiency, well-shaped
γ-detector (CANBERRA, Ge volume 280 cm3
) (Schmidt et al., 2009). Calibration of theγ-detector was done using certified standard mate-rials (IAEA-RGU-1; IAEA-375). Activities are expressed in mBq g−1 and errors are based on one standard deviation counting statistics. Ex-cess210Pb (210Pb
xs) was calculated by subtracting the activity supported
by its parent isotope,226Ra, from the total210Pb activity in the sediment.
In order to estimate the sedimentation rate of the deep basin, a
Constant Flux Constant Sedimentation model (CF/CS;Oldfield and
Appleby, 1984) was applied. All the rapidly deposited events were
removed and a corrected depth was used to calculate an age-depth model (Arnaud et al., 2006; Avşar et al., 2015).
For the long cores, a chronology was established by combining reference tephra layers and radiocarbon dating. Around Mt. Fuji, three rhyolitic tephra markers are identified in inland trenches, outcrops, and in drilling cores: the Kozushima-tenjosan (KT), the Kawagodaira (Kg) and the Kikai-Akahoya (K-Ah) tephra (Miyaji, 1988; Machida and Arai, 1992; Kobayashi et al., 2007; Nakano et al., 2007). The CE 838 KT tephra is characterized by a low refractive index (1.494–1.497,
Kobayashi et al., 2007), similar to those from volcanoes on the Izu Islands (Uesugi, 2003). The Kg tephra is afine-grained white pumice resulting from the eruption of the Kawagodaira Volcano on the Izu Peninsula with a refractive index around 1.500–1.503 (Takemura et al., 2000).Tani et al. (2013)estimate the age of the Kg tephra to be 3160–3137 cal yr BP by14C wiggle-match dating. The K-Ah tephra is a
co-ignimbrite fall-out tephra characterized byfine-grained vitric ashes originating from Kyushu. Its refractive index lies between 1.508 and 1.516 (Machida, 1999), and it is14C-dated at 6300 cal yr BP (Machida
and Arai, 1978). Varve counting in a core from Suigetsu Lake indicated that the K-Ah eruption occurred at 7324 cal yr BP (Fukusawa, 1995). We measured the refraction index and the major element composition of the observed rhyolitic tephra marker layer in the long core from site MOT15-1 in order to unequivocally identify this layer. The refraction index was measured using the oil immersion method. Major element analyses of the glass shards were performed with a CAMECA-SX 100 Electron Microprobe (EPMA-CAMPARIS). Ten elements were analysed (Na, Mg, Si, Al, P, K, Ca, Ti, Mn and Fe) using an accelerating voltage of 15 kV, a current of 10 nA and a beam size of 5 mm to minimize alkali loss (i.e., Na). Precision on individual shards was better than 0.6% for Si, ~ 1% for Al,b3% for Ca and Mg, b4% for Na, b5% for Fe, b6% for K, 10% for Ti and about 30% for P and Mn. Analytical measurements of individual glass shards were normalized to 100% wt.
Radiocarbon dating was performed at the bottom of long core MOT15-2 (at 357 cm depth), at 294 cm and 400 cm depth in the long core MOT15-1 and at 64 cm depth in the short core MOT14-1A. Radio-carbon dating was done on terrestrial organic matter to avoid age reservoir effect (Björck and Wohlfarth, 2001). For that purpose, sediments were sieved (N150 μm) and terrestrial organic remains were handpicked. Radiocarbon ages were obtained by accelerator mass spectrometry (AMS) at the Atmosphere and Ocean Research Institute, University of Tokyo. The ages were calibrated using the Oxcal 4.2 software (Bronk Ramsey, 2009). Published uncalibrated radiocarbon dating mentioned in this paper was recalibrated using Oxcal 4.2 software (Bronk Ramsey, 2009) with the Intcal13 dataset (Reimer et al., 2013). Radiocarbon ages are expressed in 2 sigma range (95.4% of probability). 4. Results and interpretations
4.1. Lake morphology: a deep basin and platforms
Lake Motosu consists of a restrictedflat deep central basin with a Z-shape (0.43 km2) and a maximum depth of 125 m (Fig. 3A). At the
eastern side of theflat basin, the lake floor is characterized by a hum-mocky relief. The deep basin is surrounded to the northwest, southwest and northeast by shallow platforms with gentle slopes (between 1.5 and 7°), to the east and southeast by steep-edged lavaflows (between 18° and 26°) and to the south and to the north by steep slopes (between 20° and 37°), formed by the Furusekigawa and Tokiwa Formations, respectively (Figs. 2, 3A).
We identify four sets of platforms with an asymmetric spatial distri-bution. They are mostly concentrated downstream of the river valleys (Fig. 3B), the largest set being located in continuity with the largest river catchment at the southwestern end of the lake. In the east and in the southeast, downstream of the CE 864 Aokigahara and Motosu lava flows, no platforms are identified. We assign the following numbers to the platform stages, based on their water depth position: platform
stage 1 lies at ~120 m, platform stage 2 between 65 and 115 m, platform stage 3 between 27 and 55 m, and platform stage 4 at ~24 m. Platform stage 2 is the largest one and covers an area of ~0.65 km2. The platforms show a decreasing sedimentary thickness, going from ~11 m for plat-form 2, to ~ 2 m for platplat-form 4. The platplat-form-staircase morphology and their upward decreasing sediment thickness (Fig. 3B) suggest that they are the result of stepwise increases in lake water level.
The platform edges and the steep slopes are incised by gullies (Fig. 3B). They are sometimes covered by a thin veneer of sediments. The combination of the very high-resolution seismic profiles and the bathymetric data suggest a connection between the gullies and some inland ephemeral streams.
4.2. Lake basin sedimentary infill
The sedimentary infill of Lake Motosu consists mainly of clayey silt deposits with intercalated layers that are rich in organic matter, and/ or coarse-grained sediment. The mineralogy of the clayey silt is similar in all coring sites. The crystalline fraction comprises on average 18% of plagioclase, 5% of muscovite, 22% of quartz + cristobalite and 55% of clay. The clay fraction consists of illite (75%) and chlorite (25%). The amorphous mineral fraction equals on average 48% and is predominantly composed of diatom frustules.
A more detailed investigation of the sedimentary infill is performed using high-resolution measurements on short gravity cores located in the deep basin and the southwestern platform 2 (Fig. 2). The results ev-idence a different sedimentation pattern between the deep basin and the platform.
The three gravity cores taken in the deep basin (3A, MOT14-4B, MOT14-5B) and one gravity core taken at the western border of the deep basin (MOT14-6A) are correlated using magnetic susceptibility and enhanced RGB images (Fig. 4A). Four different correlative facies were identified in the sedimentary record of the cores. Their main characteristics are represented for MOT14-5B inFig. 5.
Facies 1 consists of grey-brown siliceous clayey silt with abundant diatom frustules, small fractions of terrestrial organic matter and terrig-enous silt and clay. Laminations are occasionally observed. In terms of geophysical and geochemical properties, this facies is very heteroge-neous and no distinct pattern is recognized (Fig. 6). The concentrations of Sr and Br are generally lower. The LOI at 550° (% OM) ranges from 8.5% to 12.0% within Facies 1. The LOI at 950° (% Ca) and the concentra-tion S tend to be higher than in the other facies. SEM observaconcentra-tions show that diatoms are mostly intact and well preserved in the sediment (Fig. 7).
Facies 2 consists of a basal thin sandy layer (~ 1 mm), layers of scattered organic matter covered by a homogeneous grey-brown sili-ceous clayey silt deposit with at the top a whitishfine-grained cap. Fig. 3. Geomorphology of the Motosu Basin. (A) Slope map identifying the deepflat basin surrounded by steep slopes (25–37°) and gentle slopes (1.5°–7°). (B) Bathymetry (GSI, 1964) and spatial distribution of platforms. The geometry of Platform 1 (represented in pink) is partially unknown due to the lack of acoustic penetration. (C) South-north seismic reflection profile showing the different platform stages and their associated sedimentary thicknesses.
205 L. Lamair et al. / Sedimentary Geology 363 (2018) 200–220
The basal coarse sandy layer is characterized by high peaks of magnetic susceptibility and Sr. The homogeneous grey-brown siliceous clayey silt deposit is characterized by homogeneous Mag. Sus and LOI at 550 °C (in average, 10% of organic matter content). The Br, Sr and Zr content show little variability. In Facies 2, the average concentration of Ti, Br and Sr is higher than the ones observed in Facies 1 (Fig. 6). Diatoms in Facies 2 are heavily broken (Fig. 7). In the upper part of Facies 2, smaller broken pieces of diatoms are abundant, and some large diatoms with no damage are identified.
Facies 3 is characterized by a basal thin layer of organic matter covered by homogeneous grey-brown clayey silt deposit. A top whitish fine-grained cap may be observed. Magnetic susceptibility values tend to be low at its base due to the presence of high concentrations of organ-ic matter. The clayey silt deposits show stable magnetorgan-ic susceptibility values and LOI at 550 °C (in average, 10% of organic matter content). Facies 3 has similar concentration of Br and Zr, a lower Ti content and
magnetic susceptibility and a higher concentration of S than in Facies 2 (Fig. 6). In Facies 3, most diatoms are heavily damaged (Fig. 7). Depending on the coring location, a basal layer only identified in the X-ray imagery and characterized by a high magnetic susceptibility can be present (e.g., MOT14-3A inFig. 4A).
Facies 4 is a normally-graded deposit characterized by a thin basal coarse-grained layer covered by grey-brown siliceous clayey silt. On X-ray imagery, the base is shown as a dense layer. Magnetic susceptibility, Zr and Sr values increase within the sandy layer, and show a decreasing trend immediately in the overlying silty deposits. LOI at 550 °C shows a similar pattern than the magnetic susceptibility, with an increase at the base. In some cases, the sandy layer is either absent (e.g., E2 in MOT14-5B inFig. 4A) or not macroscopically visible (e.g., E3 in MOT14-5B in
Fig. 4A). On X-ray imagery, the base of Facies 4 is well imaged.
Regarding geochemical properties of Facies 4, the concentration of Zr and Fe is similar to Facies 2 and Facies 3 (Fig. 6). The concentration Fig. 4. Gravity cores. (A) Core-to-core correlation based on magnetic susceptibility profiles. Location of the cores is given inFig. 2. From left to right: linescan image, processed core image, sedimentary log and facies log. Four sedimentary events (E1 to E4) are recognized in the gravity cores. (B) Correlation between gravity cores MOT14-4B and the south-north seismic reflection profile. From left to right: processed core image, linescan image, XRF data (Sr, Zr and Ti content) and a high-resolution seismic reflection profile. Only the thickest sedimentary events (E4) exceed the seismic reflection resolution and can be imaged on the seismic reflection profile. On the seismic reflection profile, E4 appears as a semi-transparent horizon with a ponded geometry.
of Br is slightly lower than in Facies 2 and Facies 3. Facies 4 can be subdivided in two groups (a and b) based on magnetic susceptibility, Ti and Sr concentrations. For these three proxies, Facies 4a presents sim-ilar trends to Facies 3, whereas Facies 4b is closer to Facies 2. Facies 4 is composed of a mixture of broken diatoms and terrigenous material, as well as well-preserved diatoms (Fig. 7).
The different types of facies described above are interpreted as back-ground sediments (Facies 1) and rapidly deposited sediments that are intercalated within the background sedimentation (Facies 2–4). Back-ground sedimentation (Facies 1) represents the normal sedimentary dynamics of the lake, which results from the biological productivity and the settling of river-supplied suspended matter.
Four sedimentary event deposits (E1 to E4) are identified in the deep basin (Fig. 4A). E1 is characterized by Facies 3, E2 and E3 by Facies 4, and E4 by Facies 2. Like in Lake Biwa (Inouchi et al., 1996; Shiki et al., 2000) they are generally composed of a thin coarse basal sublayer (Ta;Bouma,
1962) overlain by a thicker silty sublayer (Te;Bouma, 1962). Their
cu-mulative thickness is 26 cm in MOT14-3A, 43 cm in MOT14-4B, 52 cm in MOT14-5B, and 37.5 cm in MOT14-6A (Fig. 4A).N50% of each core taken in the deep basin consists of these event deposits. By contrast, the cumulative thickness of the background sedimentation above E4 (Fig. 4A) is relatively stable (between 18 cm and 19 cm) in MOT14-4B, MOT14-5B and MOT14-6A, and slightly larger (23.5 cm) in MOT14-3A. The structure, texture and composition of the event deposits are dif-ferent from background sedimentation in terms of their geophysical and geochemical properties (magnetic susceptibility, grain size, LOI and XRF). Background sedimentation is characterized by heterogeneity. The rapidly deposited layers (Facies 2–4) have higher concentrations of terrigenous material (Ti, Zr and Sr), especially for E3 and E4 (Fig. 6).
The abundance of broken diatom frustules in Facies 2–4, despite the in-trinsic difficulty to break them, suggests that these facies are deposited by high-energy events such as turbiditicflows triggered by typhoons, floods or earthquakes.
We recognize three types of turbidites. Facies 4 turbidites are char-acterized by a thin coarse base (Ta;Bouma, 1962) followed by graded
clayey silt interval (Te;Bouma, 1962). This type of turbidites is identical
to the ones identified in Lake Biwa (Shiki et al., 2000). Facies 2 and 3 have a coarse-grained base, which corresponds to facies“Ta” in a
Bouma sequence (Bouma, 1962) but are followed by a thick homoge-neous deposit (Te;Bouma, 1962). Similar turbiditic facies were
docu-mented in Chilean (e.g.,Van Daele et al., 2015) and in Alpine lakes (e.g.,Beck, 2009). The differences between Facies 2 and 3 are related to the thickness of the homogeneous upper part (i.e., larger in Facies 2) and the presence of a systematic whitishfine-grained cap in Facies 2. This thin top layer has been recognized in association with homogenites in other lakes (e.g.,Bertrand et al., 2008).
The long piston cores show that the different sediment facies iden-tified in short cores, are in correspondence with the long-term sedi-mentation in the deep basin. In the long core MOT15-1, we identify the three types of turbidites (Facies 2, Facies 3 and Facies 4).
The sedimentary succession of platform 2 (core MOT14-1A at a water depth of 77 m) differs from the deep basin infill (Fig. 9). From the top of the core to the bottom, three distinct units are identified (Fig. 9). Unit I (0–39.7 cm) consists of clayey silt with very few silty mm-scale laminae. Magnetic susceptibility values are relatively stable with an average of 1 × 10⁻³S.I.; three small peaks (from 2 × 10⁻³to 3.5 × 10⁻³S.I.) can be correlated with the silty laminae. Unit II (39.7– 60.0 cm) is composed of 8 scoria layers, characterized by high magnetic Fig. 5. Sedimentology of core MOT14-5B (deepflat basin). (A) From left to right:210
Pb/137
Cs depth and210
Pbxsderived age-depth model processed core image, X-ray image, magnetic
susceptibility, LOI, grain-size, clay content and XRF data. Black dashed lines indicate the boundary between subsequent X-ray images.
207 L. Lamair et al. / Sedimentary Geology 363 (2018) 200–220
susceptibility values (max. 5.6 × 10⁻³S.I.). Clayey silt is deposited between the scoria layers. Unit III (60.0–66.2 cm) is similar to unit I and shows the same sedimentological characteristics and magnetic susceptibility values.
Units I and III are interpreted as background sedimentation on plat-form 2. The background sedimentation in the deep basin (MOT14-3A, MOT14-5B and MOT14-5B inFig. 7) shows similar average magnetic susceptibility values. The origin of the nine scoria layers is unknown. The X-ray images show reworked scoria (S5 to S9), embedded in the clayey silt deposits (Fig. 9). These reworked scoria are probably derived from scoria fall-out deposited on the upper platforms (platforms 3 and 4). The other scoria layers may be related to direct fall-out from the Mt. Fuji Volcano. XRF analysis conducted on the different scoria layers in-dicates that all of them have a similar composition (Table 1). The average composition of the scoria fall-out is the following: SiO251.2% ± 1.0%,
TiO21.0% ± 0.1%, Al2O317.5% ± 0.8%, Fe2O310.3% ± 0.5%, MnO
0.2% ± 0.01%, MgO 9.6% ± 0.5%, CaO 9.6% ± 0.5%, Na2O 2.1% ±
0.07%, K2O 0.6% ± 0.1% and P2O50.2% ± 0.04%. The geochemical
signa-ture of the scoria deposits is similar to the ones originated from Mt. Fuji volcano, except for TiO2and Fe2O3which present slightly lower values
(Ishizuka et al., 2007). Therefore, based on the geochemical content and the proximity of the volcano, we infer that the scoria layers recorded in MOT14-1A are originated from Mt. Fuji Volcano and could be related either to scoria fall-out or to reworking processes.
4.3. Sedimentary infill imaged by the seismic reflection profiles
The seismic reflection profiles provide complementary information regarding the sedimentary infill in the deep basin and on the platform. The sedimentary infill of the deep basin is thicker in the deepest part of the basin and its thickness tends to diminish towards the edge of the deep basin. The sedimentary infill is divided in two intervals defined Fig. 6. Geophysical and geochemical properties of the different facies described in MOT14-5B.
based on the seismic facies. The lower interval of the sedimentary infill is well imaged on one pinger seismic line as acoustic blanking prevailed in the deepest part of the basin. On the seismic reflection profile shown
inFig. 10, the lower part of the sedimentary infill is comprised between ~6.4 m (177 ms TWT, 772 m asl) and at least 19 m depth (193 ms TWT, 759 m asl). In the deepest part of the deep basin, this lower unit start Fig. 7. Preservation of diatoms in the different facies based on SEM observations performed on MOT14-5B; well-preserved diatoms (D); broken diatoms (d). (A–B) Facies 1; diatoms are well preserved; (C–D) Bottom part of Facies 2; most of diatoms are heavily broken; (E–F) Facies 3; most of diatoms are heavily damaged; (J–H) Facies 4; the sedimentary matrix is composed of broken pieces of diatoms and terrigenous material.
Table 1
Geochemical composition (in %) of scoria layers (S1 to S8) identified in MOT14-1A. SiO2 (%) TiO2 (%) Al2O3 (%) Fe2O3 (%) MnO (%) MgO (%) CaO (%) Na2O (%) K2O (%) P2O5 (%) LOI (%) Total (%) S1 50.3 0.9 18.0 10.2 0.2 5.8 10.0 2.0 0.5 0.1 0.56 98.5 S2 50.9 0.9 18.8 9.3 0.2 5.5 10.0 2.2 0.5 0.1 0.59 99.0 S3 52.1 1.1 17.1 10.0 0.2 5.0 8.5 2.0 0.8 0.2 1.87 98.7 S4 50.7 0.9 18.2 9.6 0.2 5.5 10.2 2.0 0.5 0.1 0.51 98.3 S5 51.4 1.1 17.0 10.6 0.2 6.0 9.6 2.1 0.6 0.2 0.11 98.9 S6 51.1 1.1 16.9 10.3 0.2 5.1 9.2 2.1 0.7 0.2 2.06 98.9 S7 51.3 1.1 17.1 10.7 0.2 6.2 9.5 2.1 0.6 0.2 0.07 99.0 S8 51.0 1.1 17.0 11.1 0.2 5.7 9.4 2.1 0.7 0.2 0.30 98.7 209 L. Lamair et al. / Sedimentary Geology 363 (2018) 200–220
around ~11 m depth (184 ms TWT, 767 m asl). The seismic stratigraphy of this lower interval consists of a succession of lens-shaped and wedge-shaped units, with chaotic seismic facies interrupting continuous transparent to high-amplitude seismic reflections (Fig. 10). This chaotic seismic facies representsN50% of the sedimentary infill and corre-sponds to MTDs resulting from large slope failures (e.g.,Schnellmann et al., 2005; Moernaut and De Batist, 2011; Van Daele et al., 2013). At the edge of the deep basin, where the thickness of the sedimentary infill is relatively reduced, the 3.70 m long core MOT15-2 reaches the top of the upper MTD consisting of coarse sand and pebbles (diameter of max. 5 cm).
The upper part of the sedimentary infill is between 0 m and ~11 m depth (170 ms TWT and 184 ms TWT, 778 m and 767 m asl) in the deepest part of the deep basin and between 0 m and ~ 6.4 m (169 ms TWT and 177 ms TWT, 779 m and 772 m asl) on the seismic reflection profile inFig. 10. In this upper interval, the sedimentary infill of the deep basin (Figs. 8, 10) is characterized by a succession of transparent to very low-amplitude facies, medium-amplitude facies and strongly reflecting seismic horizons. The strongly reflecting horizons are attrib-uted to coarser sediments. The strong reflectors, draping the whole
morphology, are interpreted as scoria fall-out deposits. The correlation between the seismic reflection profiles and the long cores indicates that thefirst strongly reflecting horizon (R1 inFig. 8C) correspond to a series of scoria (direct fall-out or reworked) and sand layers.
The very low-amplitude seismic reflections display a sedimentary architecture, which stands in contrast with the other continuous, medium- to high-amplitude seismic horizons. Theyfill the low flat deep depression and thin out in low dipping areas (slope 0.5–1.9°) to-wards the basin's edges. Moreover, they are mostly absent in areas where the slope is larger than 1.9° (such as on the platforms). This type of seismic facies is interpreted as a megaturbidite/homogenite (Siegenthaler et al., 1987; Chapron et al., 1999; Schnellmann et al., 2002; Bertrand et al., 2008). This interpretation is strengthened by the correlation between the seismic reflection profiles and the thickest tur-bidites (i.e., megaturtur-bidites) evidenced in the short cores (Fig. 4B) and in the long core MOT15-1 (Fig. 8C, D). Moreover, the upper interval contains a wedge-shaped chaotic seismic facies, with a smooth lower bounding surface and hummocky upper surface, corresponding to the pattern of a MTD (MTD 13 inFigs. 8A, B,11). At the western tip of the MTD, a megaturbidite is pinching out away from the MTD, and overlies
Fig. 8. Sedimentary infill of the deep basin and its edges. (A) West-east seismic reflection profile showing the coring locations and the MTDs 10 and 13. Isochrones are indicated in red. Gas-escape features are identified by grey arrows at the top of MTD 10. (B) South-north seismic reflection profile showing the coring locations and MTDs 10 and 13. Isochrones are presented in red. Gas-escape features are recognized with the grey arrow at the top of MTD 10. The labels ISO1 and ISO2 correspond to isopach calculated inFig. 15. (C) Simplified log of the different cores identifying the sand and scoria layers (reworked and direct scoria fall-out) and the Kg and K-Ah tephra (Obrochta et al., in preparation; Uchiyama, pers. comm.). R1corresponds to the set of strong reflectors located above MTD 13 (panels A, B). (D) Close-up of the south-east seismic reflection profile (B).
Fig. 8 (continued).
Fig. 9. Sedimentation on platform 2. (A) West-east seismic profile across platform 2. (B) Geophysical properties of core MOT14-1A.
211 L. Lamair et al. / Sedimentary Geology 363 (2018) 200–220
at ~ 3.6 m depth (174.5 ms TWT, 774 m asl;Fig. 11) a distinct high-amplitude seismic-stratigraphic horizon. At the foot of the southwest-ern platform 2, a series of small lens-shaped chaotic facies (MTDs) is present (Fig. 10).
The sedimentary sequence underlying platform 2 has a wedge shape, with a thick upper part and a very thin cover at the edge of the platform. The general seismic stratigraphy of its 11 m of sediment de-posited on the platform in its central part can be divided into two inter-vals. The lower part of the sediment cover (from 2.9 m up to 11 m depth in its central part; 798 m asl to 790 m asl) shows a similar seismic
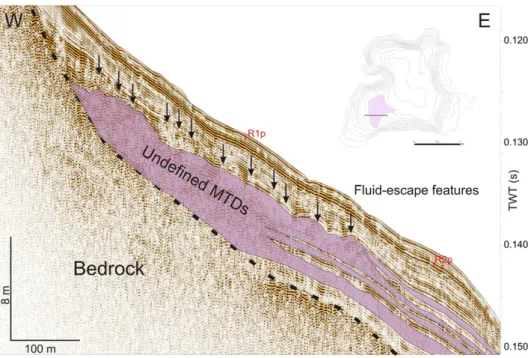
pattern as that of the lower interval of the deep basin. The low- to high-amplitude rather continuous seismic reflections are interrupted by a series of wedge-shaped chaotic seismic facies, presenting a smooth lower bounding surface and occasionally a hummocky upper surface (Fig. 12). These features are interpreted as MTDs (MTDs 11). The upper interval (from 0 m to 2.9 m) is different than the upper ~11 m in-terval in the deep basin. No transparent to very low-amplitude ponding facies are present in the upper interval of the platform. Occasionally, strong seismic reflectors drape the morphology of the platform. The upper strong reflectors (R1p inFig. 12) correspond to the scoria-rich Fig. 10. Mass-transport deposits (MTDs) imaged in seismic reflection profile (south-north), cross-cutting the basin.
interval that is identified in MOT14-1A. A second strong reflector pack-age (R2p inFig. 12) is correlated with a series of coarse sand layers (0.5– 1 cm thick) at ~70 cm depth in drill core MO-5. The edges of platform 2 feature several scarps, which are not visible on other platform edges. The relation between the scarps and the large MTDs identified in the deep basin is difficult to assess.
The sedimentary sequences below the platforms and in the deep basin thus confirm the extreme focusing of the sedimentation in the deep,flat areas linked to sediment reworking on the steep slopes and on turbiditic deposition in the basin centre. They also evidence a transi-tion in the depositransi-tional pattern related to a change in the frequency of mass-transport deposits.
4.4. Spatial distribution of mass-transport deposits and their potential sources
We identify 13 large MTDs in Lake Motosu. Maps of these MTDs are presented inFigs. 11–14. The main characteristics of these 13 MTDs (e.g., area, thickness, volume) are listed inTable 2.
In the lower part of the sedimentary infill of the deep basin, we iden-tify a succession of nine small MTDs (MTD 1 to MTD 9;Fig. 10). Because
of acoustic blanking (Fig. 13), MTDs 1–9 are only imaged in the north-western and the southnorth-western parts of the deep basin. A correlation between MTDs, identified in the northwestern and southwestern parts of the lake basin, is not possible due to acoustic blanking in the central part. The average thickness of the MTDs ranges from 0.4 m to 2 m. At the base of MTDs 4 and 5, strong seismic reflectors are present, which correspond to tephra or coarse-grained deposits.
Above MTD 9, MTD 10 covers an area of ~ 0.68 km2, comprising
platform 1 and the entire deep basin (Fig. 13). We assume an average thickness of 5 m (visible on one seismic reflection profile), resulting in
a minimum volume of 3,390,000 m3. Its hummocky morphology
forms enclosed depressions and crests. Fluid escape features are observed at the top of MTD 10 (Fig. 8A, B). No distinct head scarp is identified. Based on the thickness, distribution and morphology of MTD 10, we distinguish three distinct potential sediment sources (Fig. 13): (i, ii) northwestern and southwestern sources, probably linked to failure of the platform edge, and (iii) a southeastern source related to the collapse of the outer margin of the Motosu Lava Flow.
In the upper part of the sedimentary infill, MTD 13, located in the eastern part of the deep basin, is characterized by a hummocky surface and shows a discontinuous, chaotic seismic facies, with low to high Fig. 12. A series of MTDs (MTDs 11) on platform 2 imaged on a west-east seismic reflection profile and their spatial distribution within Lake Motosu.
Fig. 13. (A) Spatial distribution of MTD 1 and MTD 9. Arrows indicate the MTD source inferred from its geometry and its thickness; southwest platform 2 for MTD 1 and northwest platform for MTD 9. The hatching represents the blanking below MTD 10. (B) MTD 10 and its three potential sources.
213 L. Lamair et al. / Sedimentary Geology 363 (2018) 200–220
seismic amplitudes (Fig. 11). Strong reflectors are located below the MTD at ~4 m depth. MTD 13 covers a minimum area of 0.73 km2within the lake. The sedimentary infill above MTD 13 varies from 0.2 m at the shallowest part (eastern border of the lake) to 3.2 m in the deepest part (deep basin). The head scarp is not visible; we assume it was covered by the Aokigahara Lava Flow.
Along the southwestern platform 2, a series of MTDs (MTDs 11) can be identified below 2.9 m sediment depth (Fig. 12). These MTDs are stacked and characterized by a higher seismic amplitude than the MTDs located in the deep basin. The latter suggests that the MTDs coming from the southwestern platform consist of coarser material than the ones identified in the deep basin. All MTDs located along the southwestern margin of platform 2 have a similar spatial extent and oc-cupy an area of ~0.2 km2. Their average thickness varies between 0.70 m
and 2.1 m. Fluid escape features are observed at the top (Fig. 12). One subaerial landslide is identified on Landsat imagery (Google Earth,http://earth.google.com;Fig. 14B) and its sublacustrine continuity (MTD 12) is mapped on top of platform 2 on one seismic reflection profile (Fig. 14A). The thin veneer of sediment (~25–30 cm) on top of MTD12 has a similar thickness as the thin veneer on top of MTD 13 located at the eastern margin of the deep basin.
4.5. Chronology and sediment accumulation rate
The chronology of the sedimentary infill of Lake Motosu is based on (1)210Pb/137Cs dating, (2) key tephra markers identified in the long
cores, and (3) radiocarbon dating.
In core MOT14-5B, the210Pbxsprofile shows a rapid activity decrease
from 212 mBq g−1at the surface down tob6 mBq g−1at a depth of
17–18 cm, which indicates a low sedimentation rate (Fig. 5). Two levels that were sampled in the turbiditic facies between 6 cm and 13 cm contain a low level of supported210Pb
xs, indicating mixing with older
material within the turbidityflow. The depth interval of the uppermost turbiditic layer was carefully defined to subtract its thickness and to produce a corrected210Pb
xsprofile. The Constant Flux Constant
Sedi-mentation model (CF/CS;Arnaud et al., 2006; Avşar et al., 2015) was
ap-plied to this corrected profile to infer an average background
sedimentation rate of ~ 0.8 mm/yr. 137Cs, a byproduct of nuclear weapons fall-out and nuclear accidents, has been present in the atmo-sphere since 1955. Its high activities in the uppermost layers could be related to the 2011 Fukushima nuclear disaster. Within and below the turbidite, negligible activities are recorded (as already observed for
210Pb
xs). Its absence at the base of the uppermost turbidite indicates
that the latter is older than 1955, which supports the chronology based on210Pb
xs. Traces of134Cs (T1/2= 2.06 years) have been detected
in the uppermost layers of core MOT14-5B and may be related to
Fukushima accident, indicating a good recovery of the water-sediment-interface. Its rapid disappearance within the 2 upper cm indicates limited sediment mixing (bioturbation). Taking into account the event deposits, we obtain an average sediment accumulation rate of 1.7 mm/yr since 1900.
In the long cores MOT15-1 and MOT15-2, we identified a 3 mm thin rhyolitic tephra layer at composite depths of 4.27 m and 1.99 m, respec-tively. In MOT15-1, measurements of the refractive index, microscopic observations and geochemical analyses were performed on the glass shards, present in the rhyolitic tephra. The measured refractive index of glass shards (1.498 ± 0.002) and the presence of amphibole indicate that the rhyolitic tephra corresponds to the Kg tephra (3160–3137 cal yr BP;Tani et al., 2013). The geochemical composition of the Kg tephra by major element analyses (WDS) on 7 individual glass-shards confirms a homogeneous rhyolitic composition (Table 3).Obrochta et al. (in preparation)conducted similar analyses on a tephra layer in MOT15-2, which allowed identifying it as the Kg tephra. Over the last 3150 years, sediment accumulation rates at the coring site MOT15-1 and MOT15-2 are 1.35 mm/yr and 0.63 mm/yr, respectively. At 347 cm depth in MOT15-2,Obrochta et al. (in preparation)identified the K-Ah tephra (7324 cal yr BP;Fukusawa, 1995).
At the foot of platform 2, two rhyolitic tephras have been identified in MO-4 at ~ 80 cm depth and at ~150 cm depth (YIES, 2004;Fig. 8C). Based on their refractive index and heavy mineral composition, these
two rhyolitic tephra layers correspond to the Kg tephra (3160–
3137 cal yr BP;Tani et al., 2013) and to the K-Ah tephra (7324 cal yr BP;Fukusawa, 1995), respectively (Uchiyama, pers. comm.). At the edge of platform 2, two rhyolitic tephra have been identified at
~ 27 cm depth and at ~ 80 cm in MO-5 (Uchiyama and Koshimizu,
2003;Fig. 8C). Based on core to core correlation, we infer that the upper rhyolitic tephra corresponds to Kg tephra, whereas the second one is K-Ah tephra. Both cores show a low sediment accumulation rate of 0.20 mm/yr to 0.25 mm/yr (MO-4) at the foot of platform 2, and an extremely low one of 0.09 to 0.10 mm/yr at the platform edge 2 (MO-5).
14C dating in MOT14-1A at 64 cm depth (Table 4) suggests an age
range of 2520–2353 cal yr BP, yielding an average sediment accumula-tion rate of ~ 0.26 mm/yr at the top of platform 2.14C dating done at
the bottom of MOT15-2 at 357 cm depth (Table 2) implies an average sediment accumulation rate of 0.45 mm/yr, which is slightly lower than the sediment accumulation rate since the deposition of the Kg tephra, ~3150 yr ago.
The occurrence at distinct depths of the Kg tephra (Fig. 8C) and the difference between the sediment accumulation rates confirm the sharp-ly increasing sediment accumulation rate from platform 2 and the basin edges towards the central part of theflat deep basin. This is related to Fig. 14. (A) Chaotic seismic facies corresponding to the accumulation toe of a subaerial landslide imaged on a seismic reflection profile (west-east) along the southern border of Lake Motosu. (B) Headscarp of the landslide visible on Landsat image (Google Earth,http://earth.google.com) along the southern border of Lake Motosu.
the occurrence of megaturbidites in the deep basin. The edge of plat-form 2 is often destabilized, explaining the very low sediment accumu-lation rate recorded at MO-5.
Based on radiocarbon dating and the occurrence of the Kg and K-Ah tephra markers, the age of MTD 13, MTD 12, MTD10 and a minimum age for MTDs 11 is estimated. MTD 13 is located at the same depth as the strongly reflecting horizons present above the Kg tephra (R1,Fig. 8C) in the deep basin. Radiocarbon dating done within the scoria layer interval gives an age range between 2765 and 2680 cal yr BP. The radio-carbon dating performed above the scoria layer interval shows an age between 1304 and 1223 cal yr BP. MTD 13 is younger than ~ 2800 cal
yr BP and older than ~1200 cal yr BP. Based on its stratigraphic position, we infer that MTD 13 is dated at around ~2000 cal yr BP. Based on the similar thickness of the background sedimentation above MTD 13 and MTD 12, we assume that MTD 12 occurred nearly at the same time. The top of MTD 10 is sampled in MOT15-2 at 365 cm depth. The radio-carbon dating suggests that MTD 10 occurred around 8000 to 8500 cal yr BP. Based on the sediment accumulation rate on the platform, we suggest that the succession of MTDs 11 on platform 2 occurred before ~13,600 cal yr BP. The succession of MTDs 11 on platform 2 and MTDs 1 to 9 in the deep basin are likely contemporaneous, and occurred during the last glacial/late glacial period.
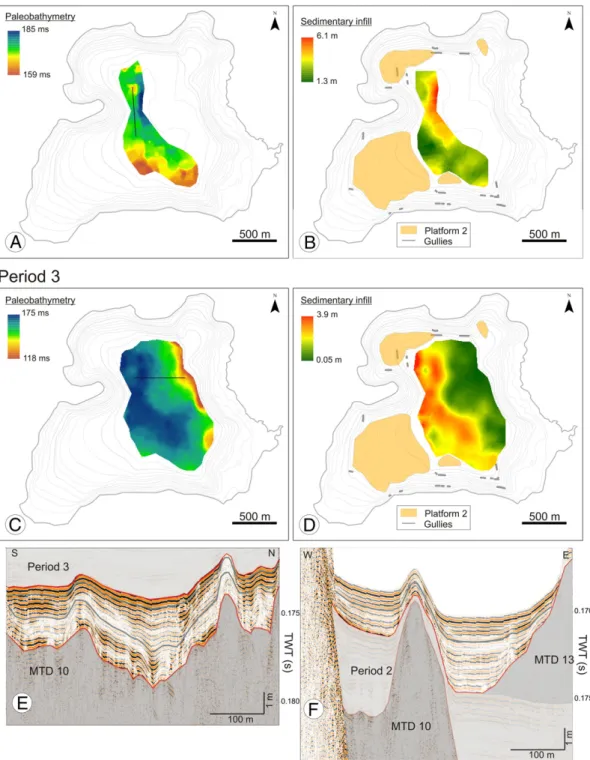
Fig. 15. Depositional evolution of Motosu basin. (A) Paleobathymetric map after the deposition of MTD 10. The depth is expressed in two-way travel-time (ms). (B) Isopach map calculated for period 2. (C) Paleobathymetric map after the deposition of MTD 13. (D) Isopach map calculated for period 3. (E) Sedimentary infill deposited during period 2 imaged on a south-north seismic reflection profile (location shown on A). (F) Sedimentary infill of period 3 imaged on a west-east seismic reflection profile (location shown on C).
215 L. Lamair et al. / Sedimentary Geology 363 (2018) 200–220
4.6. Sedimentation dynamics and history
The seismic grid provides further information on the temporal and spatial changes in sedimentation.
The sedimentation history of Lake Motosu shows three different pe-riods characterized by different sedimentation dynamics (Fig. 15): (1) be-fore ~8000 cal yr BP, i.e., below MTD 10; (2) between ~8000 cal yr BP and ~2000 cal yr BP, i.e., between MTD 10 and MTD 13; and (3) from ~2000 cal yr BP to the present day. Spatial changes in sedimentation during these pe-riods are evidenced by the mapping of isochrones (Fig. 15) corresponding to (i) MTD 13 and its lateral continuation, i.e., strong reflectors below MTD 13 (R1 inFig. 8C), and (ii) the top of MTD 10. Thefirst isochron can be traced back into the entire deep basin. Because of the lack of acoustic pen-etration below MTD 13, the second isochron, i.e., the top of MTD 10, cannot be mapped throughout the entire lake. To reconstruct the sedimentary his-tory of platform 2, the seismic horizons corresponding to the strong re flec-tive package above the Kg tephra, and the strong reflective package comprising the K-Ah tephra were mapped. Taking into account the low sediment accumulation rate on platform 2, we infer that on the seismic re-flection profiles, the strong reflectors comprising K-Ah tephra (R2p in
Fig. 8C) are approximately equivalent to the deposition of MTD 10. Before ~8000 cal yr BP, at least ~13 m of sediment was deposited in the deep basin (Fig. 10). The northwestern part of the deep basin is imaged deeper and isfilled with thicker MTDs than its southwestern part (Fig. 10). Along the southwestern platform 2, a major fraction of the sedimentary deposits consists of MTDs.
During the second period (from ~8000 cal yr BP to ~2000 cal yr BP), up to 6.5 m of sediment was deposited in the deep basin, representing a maximum sediment accumulation rate of ~1.1 mm/yr. The sedimentary infill is mainly controlled by the morphology of the lake floor, which be-came strongly modified by the emplacement of MTD 10. MTD 10 creat-ed depressions and ridges.Fig. 15A shows the top of MTD 10 with a maximum relief of ~10 m. The largest topographic anomaly is located to the south of the deep basin and consists of a northward dipping hum-mocky and irregular surface with slopes of 5° (Fig. 15A). To the north and to the west of the deep basin, three distinct ridges are identified. In the centre of the deep basin, a largeflat depression was formed by MTD 10. The extension of this depression to the east is unknown due to acoustic blanking. Above MTD 10, the sedimentary cover shows large variations in thickness. The depression isfilled with a thick sedi-mentary infill composed of turbidites, megaturbidites and background sedimentation. On top of the highs, the sedimentary infill is thinner, ranging from 1.5 to 2.5 m (Fig. 15B). The low-amplitude to semi-transparent seismic facies corresponding to megaturbidite is (nearly) absent. We attribute the drastic change in sediment accumulation rate to the reduced thickness of event deposits. At the end of this period, MTD 13 was emplaced in the deep basin and changed the basin mor-phology (Fig. 15C). The thickness of the sedimentary infill is directly re-lated to the paleobathymetry due to the deposition of megaturbidites (Fig. 15D). In addition, sediment accumulation at the foot of northwest platform 2 suggests that gullies transfer sediment from the shore into the lake.
Fig. 16. Lavaflows affecting the northwestern flank of Fuji Volcano and potentially the Motosu catchment before 8000 BP (period 1), between 8000 and 2000 BP (period 2) and since 2000 BP (period 3).
Table 2
Summary of MTDs recorded in Lake Motosu and their characteristics. PF = platform, DB = Deep basin.
Location Source Min. areaa
(m2 ) Min. thicknessa (m) Max. thicknessa (m) Average thickness (m) Volume (m3 ) Fluid-escape feature Strong seismic horizon at the base
MTD 1 DB SW Platform 28,040 0.25 3.0 2.0 56,080 MTD 2 DB SW Platform 7900 0 2.0 1.0 5710 MTD 3 DB SW Platform 30,000 0.5 1.0 0.5 6525 MTD 4 DB SW Platform 33,000 0.0 1.0 0.5 6560 X MTD 5 DB SW Platform 20,530 0 1.0 0.5 3711 X MTD 6 DB NW Platform 17,990 0.6 1.2 1.0 6875 MTD 7 DB NW Platform 17,990 0.5 1.5 1.0 6875 MTD 8 DB NW Platform 17,990 0.5 1.5 1.0 6875 MTD 9 DB NW Platform 17,990 0.5 3 2.0 13,750
MTD 10 DB NW, SW Platform and SE slope 677,880 0 ~13 ~5 3,389,400 X X
MTDs 11 PF 2 SW Platform 219,120 0.5 to 2.5 Occasionally Occasionally
MTD 12 PF 3 South subaerial slope of Lake Motosu 49,900 Impossible to assess
MTD 13 DB East edge of Lake Motosu 73,095 0 10.5 5.0 365,475 X X
During the same period, the thickness of the sediment deposited ranges from 2.90 m in the centre to 0.10 m along the edges of platform 2. The maximum sediment accumulation rate on platform 2 is ~0.48 mm/yr, which is 2.3 times lower than the sediment accumulation at the deep basin. The lower sediment accumulation rate on platform 2 is due to the absence of megaturbidites. The absence of megaturbidites is caused by the relative high slope gradient of the platform which is high enough to maintain most turbiditicflow. The same phenomenon occurred along the deep basin topographic highs. Consequently, turbi-dites recorded on the platform would be characterized by a thin coarse base with potentially a thin silty top. For example, in the gravity MOT14-1A core, reworked tephra layers are related to the coarse base of the turbiditic deposits. In addition to the slope gradient, the absence of megaturbidites is linked to the potential sedimentary source. The un-stable margins of platform 2 are potential source areas for the turbidity flows ponding into the basin. To record a turbiditic flow from that source on the platform 2, the turbiditicflow would need to be reflected on the basin margin before reaching platform 2.
During the most recent period, from ~2000 cal yr BP to the present day, up to ~ 3.7 m of sediments accumulated in the central part of the deep basin. During this period, no large sublacustrine slope failures are observed. The sedimentary infill is composed of background sedi-mentation, turbidites and megaturbidites. The sediment accumulation rates equal an average of 1.8 mm/yr in the deep basin. A maximum thickness of the infill is observed in the northwest and in the southwest (max. 3.0–3.7 m) at the foot of platform 2. In contrast, in the southeast, where no platforms are present, sedimentary input is strongly reduced (max. 2.3 m). The isopach map (Fig. 15D) is different from the previous period, because MTD 13 drastically changed the lake bottom morphol-ogy by creating a strong relief in the eastern part of the deep basin, with a protrusion into the central part of the basin (Fig. 15C) and a new configuration of low areas. The thickness of the deposits on top of MTD 13 decreases from 3.2 m around the edges of MTD 13 to 0.20 m on top of its highs. Moreover, the isopach and paleobathymetric maps highlight that the thickness of the sedimentary infill deposited in this period is directly related to the paleobathymetry (Fig. 15C). Around
~2000 cal yr BP, the lake morphology was still influenced by the pres-ence of MTD 10. At present, MTD 10 is completely covered by sediments and has no longer any influence on the depositional patterns. In the deep basin, the topographic influence of MTD 13 decreases, since its hummocky relief is smoothed by the deposition of sediment on top.
During this third period, the sedimentary infill along the southwest-ern platform 2 consists mainly of background sedimentation and varies from 0.80 m in the middle to 0.10 m on the edge of platform 2. The maximum sediment accumulation rate on platform 2 is ~0.4 mm/yr, which is 4.5 times lower than in the deep basin. The core correlation from the platform to the deep basin (Fig. 8C) highlights the drastic differ-ence in sediment thickness between the platform and the deepest part of the basin. The turbidites are mainly restricted to the deepflat basin. 5. Discussion
In Lake Motosu, the onset of lacustrine sedimentation began before the emplacement of the Aira–Tanzawa (AT) tephra (Koshimizu et al., 2002, 2007). In MO-2, buried below thick lava flows, lacustrine sediments have been found, suggesting that the extent of Lake Motosu was probably larger in the past. The AT tephra was identified at ~ 172 m depth (738 m asl) and radiocarbon dating was performed at ~ 167.5 m depth (742 m asl) given an age range between 19,330 and 20,220 cal yr BP (Koshimizu et al., 2007). The AT tephra is found widely throughout Japan (Machida and Arai, 1976, 1983, 1992) and occurred between 29,870 and 28,585 cal yr BP (25,120 ± 270 BP;Miyairi et al., 2004). Therefore, the depositional history of Lake Motosu probably started before ~30,000 cal yr BP.
In this study, the high-resolution seismic reflection profiles image partially the sedimentary infill of the deep basin (i.e., ~19 m of sedimen-tary infill in the northwestern part of the deep basin). The bottom of the imaged lacustrine sedimentary infill stands at 759 m asl. According to the lacustrine sediment accumulation rate obtained in MO-2 (0.47 mm/yr; based on the interval between the14C dating and AT tephra) and the
calculated thickness of the sedimentary infill without the MTDs, we estimate that the pinger seismic reflection profile image the sediments deposited over the last ~21,000 cal yr BP. In the following section, only the imaged sedimentary infill of Lake Motosu is discussed.
Through its history, the deep basin of Lake Motosu has been mostly filled by reworked materials, i.e., MTDs, megaturbidites and turbidites. This observation is supported by the detailed analysis of the seismic reflection data and the gravity cores. The trigger mechanisms for depo-sition of reworked material are not addressed here in detail. However, we should mention that the volcanic and seismic history of the Fuji Five Lakes area probably played a key role (Stein et al., 2006) in the nature of the sedimentary infill of Lake Motosu.
The seismic profiles and cores clearly show a change in the dynamics/ intensity of sediment reworking. Before 8000 cal yr BP, at least ten large MTDs associated with the deposition of large amounts of reworked sed-iment occurred. The sedsed-iment accumulation rates for this period cannot be calculated due to the uncertainties related to the age of the bottom imaged sedimentary infill. Between ~8000 and ~2000 cal yr BP, only one large MTD was deposited in the deep basin. The sediment accumula-tion rates for the deep basin and platform 2 are estimated around 1.1 mm/yr and 0.48 mm/yr, respectively. Since ~ 2000 years BP, no large MTDs occurred and only turbidites and megaturbidites are record-ed. The sediment accumulation rates for the deep basin and platform 2 are calculated around 1.8 mm/yr and 0.4 mm/yr, respectively. The sediment accumulation rates show two different trends. In the deep basin, the sediment accumulation rate increases during the last period, whereas on the platform, the sediment accumulation rate reduces. The sediment accumulation rate of the deep basin is strongly affected by the presence of turbidites and megaturbidites. Therefore, the increase of the sediment accumulation rate in the recent period reflects an in-crease in occurrence or thickness of megaturbidites. In contrast, the sed-iment accumulation rate on the platform mostly reflects the background Table 3
Glass chemistry of seven samples from the Kawagodaira (Kg) tephra (3160–3137 cal yr BP;Tani et al., 2013) from a sample collected in the long core MOT15-1, determined by electron probe microanalysis.
Na2O (%) MgO (%) SiO2 (%) Al2O3 (%) K2O (%) CaO (%) FeO (%) MnO (%) TiO2 (%) Cl (%) Total (%) 3.47 0.31 77.07 12.87 2.80 1.64 1.52 0.00 0.20 0.10 100 3.57 0.38 77.27 12.73 2.83 1.51 1.31 0.10 0.19 0.11 100 3.61 0.26 77.36 12.30 2.96 1.69 1.39 0.06 0.29 0.08 100 3.54 0.28 77.40 12.46 2.90 1.67 1.22 0.08 0.33 0.12 100 3.12 0.31 77.56 12.78 3.00 1.54 1.41 0.00 0.18 0.10 100 2.99 0.27 78.06 12.70 2.84 1.50 1.27 0.03 0.25 0.09 100 2.23 0.29 78.54 12.89 2.89 1.55 1.23 0.00 0.26 0.12 100 Mean 3.22 0.30 77.61 12.68 2.89 1.58 1.34 0.04 0.25 0.10 100 Table 4 14 C dating results. Core Depth (cm)
Lab. code Uncalibrated14
C (BP) Calibrated14 C (cal yr BP) 95.4% of probability MOT14-1A 64 YAUT-029403 2428 ± 30 2520–2353 (69.1%) 2699–2632 (18.8%) 2617–2588 (6.2%) 2539–2525 (1.3%) MOT 15-1 294 YAUT-029419 1327 ± 36 1304–1223 (73.8%) 1214–1181 (21.6%) MOT 15-1 400 YAUT-029424 2534 ± 31 2748–2681 (38.4%) 2600–2493 (43.7%) 2640–2609 (13.3%) MOT 15-2 357 YAUT-029402 7039 ± 41 7956–7790 (95.4%) 217 L. Lamair et al. / Sedimentary Geology 363 (2018) 200–220