Journal of Chemical and Pharmaceutical Research, 2014, 6(7):10-23
Research Article
CODEN(USA) : JCPRC5
ISSN : 0975-7384
Plants as a source of green corrosion inhibitors on mild steel in hydrochloric
acid: The case of oil extract of leaves of Pistacia lentiscus from Saidia Morocco
Aouinti Fatima
1, Elmsellem Hicham
2, Bachiri Ali
1, Fauconnier Marie-Laure
3, Chetouani
Ahmed
2,4, Chaouki Belbachir
2, Aouniti Abdelouahad
2and Hammouti Belkheir
2* 1Laboratory of Physical Chemistry of the Natural Resources and Environment, University Mohammed Premier,Oujda, Morocco
2LCAE-URAC18, Faculté des Sciences, Université Mohammed Premier, Oujda, Morocco 3Units of General and Organic Chemistry University of Liege Gembloux Agro-Bio Tech, Belgium 4Laboratoire de chimie physique, Centre Régionale des Métiés de l'Education et de Formation ''CRMEF'', Région
de l'Orientale, M-60000 Oujda, Morocco
_____________________________________________________________________________________________
ABSTRACT
The aim of this work was to characterize the essential oils of Pistacia lentiscus (P.L) from Saidia Morocco and analysis by gas chromatograph interfaced with a mass spectrometer (GC-MS). The Corrosion inhibition effect of organic oil and extract of leaves of Pistacia lentiscus (P.L) of mild steel in 1M HCl solution was carried out using, gravimetric, electrochemical polarization and EIS methods. Experiments are performed by varying concentration of the inhibitor. The inhibition efficiency increases with increased organic oil and extract concentration to attain a maximum value of 96.34 % and 86.59% at 1g/L for oil and extract respectively. The study reveals that oil, was dominated by monoterpene hydrocarbons (44.99%) followed by oxygenated monoterpenes (13.66%) and Sesquiterpene hydrocarbons (16.59%). Among them, limonene (18.92%), α-pinene (13.94%), β- caryo phyllene (6.93%) and terpinen-4-ol (5.57%) were identified as major components. The Pistacia lentiscus oil and extract acts a mixed inhibitor and showed a result of the growth in the compactness of the protecting film dressing. The organic oil and extract adsorbs on the mild steel surface according to a Langmuir isotherm adsorption model.
Keywords: Corrosion, mild steel, hydrochloric acid, inhibition, Pistacia lentiscus, oil, extract, electrochemical,
adsorption.
_____________________________________________________________________________________________ INTRODUCTION
Corrosion is a naturally occurring phenomenon commonly defined as deterioration of metal surfaces caused by the reaction with the surrounding environmental conditions. Corrosion is a major destructive process affecting the performance of metallic materials in applications in many construction sectors. The consequences of corrosion are quite many and are considered a serious problem in industry, constructions and civil services such as electricity, water and sewage systems. Steel is extensively used in industry especially for structural applications, but its susceptibility to rusting in humid air and its high dissolution rate in acid media are the major obstacles for its use on larger scale. As acidic media, hydrochloric acid and sulphuric acid are generally used in industry for cleaning, decaling and pickling of steel structures, the equipment (reactors, agitators, pumps, drain, etc.) are subjected to slower or faster deterioration; processes which are normally accompanied by considerable dissolution of the metal. However, the aggressiveness of these acids in the solution against structural materials of mild steel, the use of inhibitors is the most practical methods of protection against corrosion. Their addition is necessary to secure the attack of metal from corrosiveness media such chemical cleaning and pickling generally used to remove mill scales (oxide scales) from the metallic surface. To prevent or minimize internal corrosion in these systems, inhibitors are used especially in flow and closed systems, such as fresh water distribution systems. The protection of metals
against corrosion in hydrochloric acid has been the subject of much interest since it has been used in many industrial processes, especially in fertilizer production. The acids damage the materials under treatment and in this kind of situation; organic and inorganic inhibitors are used to reduce the corrosive property of acids. A corrosion inhibitor is a substance which when added in small concentration to an environment, effectively reduces the corrosion rate of a metal exposed to it. Large numbers of organic compounds have been studied and are still being studied to assess their corrosion inhibition potential. Several works studied the corrosion of various materials in the hydrochloric acid with addition of chemical ions and solid particles and sometimes measurements were performed in the industrial
hydrochloric acid to study the behaviour in a real but complex medium 1-3.
Some investigations have also been done on the inhibition in hydrochloric acid using synthetic inhibitors. Though the existing data show that organic compounds have good anticorrosive activity, some of them are highly toxic to
both human beings and environment.4. But little works appear to have been done using naturally occurring
substances in hydrochloric acid as corrosion inhibitors. The safety and environmental issues of corrosion inhibitors arisen in industries has always been a global concern. Due to increasing environmental awareness and adverse effect of some chemicals, research activities in recent times are geared towards developing cheap, non-toxic and environmentally safe corrosion inhibitors. Therefore, attention has been focused on ‘environment friendly green
inhibitors’ of plant origin, which are inexpensive, readily available and are renewable sources of materials5.
In previous work, we will try a new Plant, Pistacia lentiscus oil and extract, Moroccan origin, as a ecofriendly inhibitor of corrosion mild steel in molar HCl. Pistacia lentiscus L. (Family Anacardiaceae) is widely distributed in Mediterranean Europe, Morocco and the Iberian Peninsula and in the west through southern France, Turkey, Iraq and Iran. It is extensively used in folkmedicine [5], and the pharmaceutical and antimicrobial activity of this species has been reported by several authors [6, 7]. Numerous essential oil studies have been conducted on P. lentiscus leaves from different provenances [8–12]. The aerial part has traditionally been used as a stimulant, for its diuretic properties, and to treat hypertension, coughs, sore throats, eczema, stomach aches, kidney stones and jaundice [13, 14]. The resin part of this plant known as mastic resin and plant called the mastic tree [15, 16], it has great medicinal value and has already been used in traditional systems of medicines like the Unani and Ayurveda systems [17], and it has been reported to possess anticancer [18] and antiulcer activity [19]. Although spices are used primarily for their desirable flavor and odor, they may play other important roles in food systems [20–22] and can also be a good source ofmacro- and trace elements [23, 24]. These elements are essential for normal growth of plants, and their protection against plant viruses, immunity, and the completion of the life cycle [25, 26]. Throughout the world, there is increasing interest in the importance of dietary minerals in the prevention of several diseases. Human, as well as animal, studies have shown that optimal intakes of elements such as sodium, potassium,magnesium, calcium, manganese, copper, zinc and iodine could reduce individual risk factors, including those related to cardiovascular disease [27–29], Mineral compounds are of critical importance in the diet, even though they comprise only 4–6 % of the human body. The essential oil of leaves of Pistacia species has been the object of several studies of their antibacterial [6, 30–33], antiproliferative [34] and antioxidant activities [11, 35, 36]. And many studies have been reported on the antioxidant property of P. lentiscus [37]. Some researchers have reported the chemical composition of the essential oil from leaves of P. lentiscus of diverse origins (France, Spain, Italy, Greece, Egypt, Turkey, and Morocco) [38–41].
We propose in this work, the influence of addition of oil extracted from Pistacia lentiscus on inhibition of the corrosion of mild steel in 1M HCl evaluated at 298K. Study of the kinetics of the corrosion of mild steel in hydrochloric acid was achieved by weight loss, potentiodynamic polarization and electrochemical impedance spectroscopy methods after After extraction of essential oil of the aerial part of Salvia Officinalis by hydrodistillation using a Clevenger type apparatus and identification of major components for essential oil studied of
Pistacia lentiscus by spectral analysis of gas chromatography and gas chromatography coupled to mass
spectrometry (GC-MS),
EXPERIMENTAL SECTION
2.1. Plant material, Hydrodistillation apparatus and procedure
The leaves of Pistacia lentiscus were collected in the around region of Saidia, Morocco The air-dried leaves of
Pistacia lentiscus (P.L) were submitted for 4 h to hydrodistillation using a Clevenger type-apparatus. The essential
oils were dried over anhydrous sodium sulphate and then stored in sealed glass vials at 4 to 5°C prior to analysis. The extracted oil was analyzed using gas chromatograph interfaced with a mass spectrometer (Shimadzu QP 2010, Japan) system fitted with a DB-5 (30m , 0.25mm, 0.25 µm film thickness) column operating in the split less mode, helium was used as the carrier gas at 1 ml/min. the injector was maintained at 250°C and the transfer-line at 280°C. The spectrometer was used in the electron impact mode at 70eV, full scan from m/z 40 to 500 and selected ion monitoring (SIM) according to Table 1. The oven temperature was programmed as Follows : 60°C (2 min)
20°C/min to 150°C hold for 0 min, 10°C/min to 200°C hold for 10min, 10 °C/min to 260°C and hold for 10 min (figure 1). . This plant extracted with hydrodistillation method to obtain an essential oil, which was subsequently
used to study the corrosion inhibition properties of mild steel in polluted hydrochloric acid solution 6.
Figure.1. hydrodistillation using a Clevenger type-apparatus
2.2. Preparation of specimen and method: 2.2.1. Gravimetric method
Prior to all measurements, the steel samples (0.09 % P; 0.38 % Si; 0.01 % Al; 0.05 % Mn; 0.21 % C; 0.05 % S and the remainder iron) were ground with different emery paper up to 1000 grade, washed thoroughly with bidistilled water degreased and dried with acetone.
The aggressive solution (1N HCl) was prepared by dilution of analytical grade 37% HCl with bidistilled water. Gravimetric measurements were carried out in a double walled glass cell equipped with a thermostat-cooling condenser.
The solution volume was 100 cm3. The steel specimens used had a rectangular form (2 cm x 2 cm x 0.05 cm).
2.2.2. Polarisation and impedance spectroscopy measurements
The EIS is a method designed to avoid severe deterioration of the exposed surface of the structure studied and was widely used for monitoring the corrosion of a working electrode. This method consists of applying frequencies and low amplitude sinusoidal voltage wave to produce perturbation signals on the working electrode. The corrosion state can be predicted by analyzing the current response of the voltage or the frequencies. In modern practice, the impedance is usually measured with loch-in amplifiers or frequency-response analyzers, which are faster and more
convenient than impedance bridges 2, 3, 7.
The electrolysis cell was Pyrex of cylinder closed by cap containing five openings. Three of them were used for the
electrodes. The working electrode was mild steel with the surface area of 1 cm2. Before each experiment, the
electrode was polished using emery paper until 1200 grade. After this, the electrode was cleaned ultrasonically with distillate water. A saturated calomel electrode (SCE) was used as a reference. All potentials were given with
reference to this electrode. The counter electrode was a platinum plate of surface area of 1 cm2. The temperature was
until a steady state open circuit potential (Eocp) was obtained. The polarization curve was recorded by polarization from -800 mV to 100 mV under potentiodynamic conditions corresponding to 0.5mV/s (sweep rate) and under air atmosphere.
The potentiodynamic measurements were carried out using VoltaLab100 electrochemical analyser, which was controlled by a personal computer. AC-impedance studies also were carried out in a three electrode cell assembly. The data were analysed using Voltamaster 4.0 software. The electrochemical impedance spectra (EIS) were aquared
in the frequency range 10 kHz to 1NHz at the free corrosion potential. The charge transfer resistance (Rct ) and
double layer capacitance (Cdl) were determined from Nyquist plots
RESULTS AND DISCUSSION 3.1. Characterization and chemical composition of essential oils
Gas chromatography (GC) is undoubtedly one of the key techniques used for screening / identification / quantification of many groups of non-polar and/or semi-polar food toxicants (or their GC amenable derivatisation products). The high attainable separation power (potential number of theoretical plates) in combination with a wide range of the detectors employing various detection principles to which it can be coupled makes GC an important, often irreplaceable tool in the analysis of (ultra)trace levels of toxic food components that may occur in such complex matrices as foods and feeds. In practice, the methods used for analyses of organic compounds , oil typically consist of basic steps as shown in Figure 1: (i) isolation from a representative sample (extraction step); (ii) separation from bulk co-extracted matrix components (clean-up step); (iii) identification and quantification (determinative step). The last step is often optionally followed by (iv) confirmation of results figure2 .
Figure 2. Basic steps typically involved in GC analysis of organic copound, alternative approaches applicable in determinative step shown in a greater detail
Analysis of the essential oil of Pistacia lentiscus from saidia Morocco was carried out using gas chromatography (GC) and gas chromatography-mass spectral (GC-MS). The oil was dominated by monoterpene hydrocarbons (44.99%) followed by oxygenated monoterpenes (13.66%) and Sesquiterpene hydrocarbons (16.59%) . 18 constituents were reported amounting to 75.24% of the total oil (Table 1) and figure 3. Among them, limonene
(18.92%), α-pinene (13.94%), β- caryo phyllene (6.93%) and terpinen-4-ol (5.57%) were identified as major components of essential oil of Pistacia lentiscus from Saidia Morocco.
Figure 3. Pistacia lentiscus oil Specter
Table 1. Chromatogram of the essential oil of the leaves of Pistacia .lentiscus, from Saidia Morocco
Compounds
Monoterpene hydrocarbons Rt (min) Aire(%)
Tricyclene - - α-pinene 9.17 13.94 Camphene 9.49 3.10 Sabinene 10.06 0.87 β-pinene 10.11 4.45 Myrcene 10.43 1.68 α-phelandrene - - α-terpinene 10.93 0.81 p-cymene 11.09 1.22 Limonene 11.18 18.92 α-thijane - - Totals 44.99%
Monoterpene oxygénés Rt (min) Aire(%)
Linolol 12.45 0.41 Nonane - - Endoborneol 13.60 0.49 α-terpineol 13.98 6.78 terpinen-4-ol 13.78 5.57 Carvone - - Camphor - - 1-3-carene - - Totals 13.66%
Sesquiterpene hydrocarbons Rt (min) Aire(%)
Gurjunene - - β-caryophyllene 17.33 6.93 α-cubebene - - β-cubebene - - α-humulene - - Muurolene 18.31 1.49 gamma-cadinene 20.03 2.68 delta-cadinene 18.59 2.65 germacrene-D 17.44 1.65 α-copaene 20.07 0.78 α-cadinene - - Total 16.59%
3.2. Effect of inhibitor concentration
The weight loss measurements, simplest, way of measuring the corrosion rate of a metal is to expose the sample to the test medium (e.g. sea water) and measure the loss of weight of the material as a function of time. Although these tests are simple, there is no simple way to extrapolate the results to predict the lifetime of the system under investigation. Moreover, some corrosion processes occur with no significant mass change (e.g. pitting corrosion) making them difficult to detect by gravimetric methods. Weight loss measurements were carried out in a double walled glass cell equipped with a thermostat-cooling condenser. The solution volume was 100mL with and without the addition of different concentrations of inhibitors ranging from 0.001 to 1 g/L. The immersion time for the weight loss was 6 h at 298 K. After the corrosion test, the specimens of steel were carefully washed in double-distilled water, dried and then weighed. The rinse removed loose segments of the film of the corroded samples. Duplicate experiments were performed in each case and the mean value of the weight loss is reported using an analytical
balance (precision ± 0.1 mg). Weight loss allowed us to calculate the mean corrosion rate as expressed in mg.cm-2 h
-1. Inhibition efficiency (E w %) is calculated as follows:
−
×
=
corr corr wW
W
E
100
1
o (1)Wcorr and W0corr are the corrosion rates of steel in the presence and absence of the organic compounds, respectively.
The values of corrosion rate (Wcor) and the corresponding inhibition efficiency (Ew %) of different concentrations of
oil and extract of Pistacia lentiscus are given in Table 2.
Table 2: Gravimetric results of steel/HClat various concentrations of oil and extract of Pistacia lentiscus at 298K at 6h
Pistacia lentiscus Inhibitor C (g/L) Wcorr (mg.cm-2 h-1) E (%) θ 1M HCl - 0.82 --- --- Oil 1 0.03 96.34 0.96 0.5 0.06 92.68 0.93 0.1 0.09 89.02 0.89 0.05 0.11 86.59 0.87 0.01 0.14 82.93 0.83 0.001 0.17 79.27 0.79 Extract 1 0.11 86.59 0.87 0.5 0.15 81.71 0.82 0.1 0.23 71.95 0.72 0.05 0.32 60.98 0.61 0.01 0.39 52.44 0.52 0.001 0.43 47.56 0.48
Table 1 showed also that the maximum values of the inhibition efficiency (Ecorr) are 96.34%, and 86.59% at 1g/L, respectively for oil and extract of Pistacia lentiscus, which indicates that oil and extract of Pistacia lentiscus acts as a good inhibitors for steel in 1M HCl. This behaviour is due to the fact that the adsorption coverage of inhibitors on metal surface increases with the inhibitor concentrations resulting in the blocking of the reaction sites, and protection of the mild steel surface from the attack of the corrosion active ions in the acid medium. This adsorption is influenced by the nature and surface charge of metal, the type of aggressive electrolyte and the chemical structure of oil and extract of Pistacia lentiscus. The major components structure for essential oil of Pistacia lentiscus by spectral analysis (GC-MS), was show in figure4.
limonene α-pinene β- caryo phyllene terpinen-4-ol Figure 4: major component structures for essential oil by spectral analysis (GC-MS),
3.1.1. Potentiodynamic Polarization Study
As mentioned in the previous application notes, most corrosion phenomena are of electrochemical nature and consist of reactions on the surface of the corroding metal. Therefore electrochemical tests methods can be used to
characterise corrosion mechanisms and predict corrosion rates. The effect of organic oil concentration on the potentiodynamic anodic and cathodic polarization curves of mild steel has been studied in 1M concentrated HCl solution.. For electrochemical measurements, the inhibition efficiency is calculated by using corrosion current
density as follows 8:
−
×
=
corr corr wi
i
E
o1
100
(1)icorr and i°corr are the corrosion current density value with and without inhibitor, respectively, determined by
extrapolation of cathodic Tafel lines to the corrosion potential. Electrochemical parameters such as corrosion current
density (Icorr), corrosion potential (Ecorr), Tafel slope constants calculated from Tafel plots (βc and ßa) and the
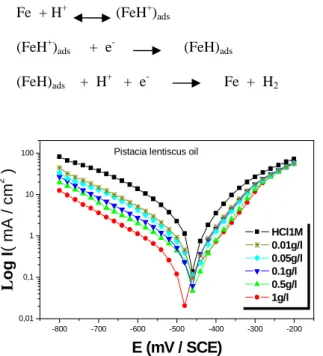
inhibition efficiency (E %) are given in figure 5 and 6. The Potentiodynamic polarization parameters and inhibition efficiency are presented in Table 3. It is obvious from the Fig.5 and 6, that in the presence of the inhibitor the curves are shifted towards lower current regions, showing the inhibition tendency of inhibitor that the cathodic current potentiel curves gave rise to parallel Tafel lines, which indicate that the hydrogen evolution reaction is activation controlled and that the addition of the oil and extract of Pistacia lentiscus does not modify the mechanism of this process. Fig.5 and 6, also reveals that the presence of the inhibitor affects the anodic dissolution of mild steel as well
as the cathodic reduction of hydrogen ions, (Icorr) and increases the inhibition efficiency of oil organic extracted.
Both the anodic and cathodic tafel slopes, namely ßa and ßc respectively are varying from the blank values indicating
the mixed mode of inhibition.
E% increases with inhibitor concentration to attain a maximum value of 93.50%, and 84.50% at 1g/L, respectively for oil and extract of Pistacia lentiscus, which indicates that oil and extract acts as a good inhibitors for steel in 1M HCl. Therefore, it could be concluded that organic oil adsorbs onto both anodic and cathodic sites of the mild steel surface. The electrochemical processes on the metal surface are likely to be closely related to the adsorption of the inhibitor, and the adsorption is known to depend on the chemical structure of the inhibitor. In hydrochloric acid solution the following mechanism is proposed for the corrosion of iron and steel. According to this mechanism cathodic dissolution of iron is
Fe + H+ (FeH+)ads (2)
(FeH+)ads + e- (FeH)ads (3)
(FeH)ads + H+ + e- Fe + H2 (4)
Figure 5. Polarisation curves of mild steel in concentrated HCl at different concentrations of Pistacia lentiscus oil
Figure 6. Polarisation curves of mild steel in concentrated HCl at different concentrations of Pistacia lentiscus extract
-800 -700 -600 -500 -400 -300 -200 0,01 0,1 1 10 100 HCl1M 0.01g/l 0.05g/l 0.1g/l 0.5g/l 1g/l
L
o g I ( m A / c m 2 ) E (mV / SCE)Pistacia lentiscus oil
-800 -700 -600 -500 -400 -300 -200 0,01 0,1 1 10 100 HCl1M 0.01g/l 0.05g/l 0.1g/l 0.5g/l 1g/l L o g I ( m A / c m 2 ) E (mV / SCE)
Table 3. Electrochemical parameters of mild steel in 1M HCl in the presence of different concentrations of organic oil and extract of (P.L) at 298 K Inhibitor C (g/L) Ecorr (mV) Icorr (µA/cm2) -βc βa E (%) θ 1M HCl - -455 600 173 113 -- -- Oil 1 -475 39 134 87 93.50 0.93 0.5 -455 88 155 80 85.33 0.85 0.1 -464 109 155 86 81.83 0.82 0.05 -454 132 131 84 78.00 0.78 0.01 -463 183 133 94 69.50 0.69 0.001 -456 199 140 89 66.83 0.67 Extract natural 1 -487 93 151 81 84.50 0.84 0.5 -479 135 148 107 77.50 0.77 0.1 -482 174 140 62 71.00 0.71 0.05 -457 203 148 105 66.17 0.66 0.01 -460 269 134 68 55.17 0.55 0.001 -467 307 158 80 48.83 0.49
3.1.2. Electrochemical impedance spectroscopy
Electrochemical impedance spectroscopy is a technique that determines a numerical value for the degree of corrosion protection provided by a coating to a metal substrate. This numerical value is called the impedance of the coating and is defined as the ability of the coating to resist or oppose corrosion through a combination of barrier and adhesive properties. The more the coating protects the underlying metal, the higher the impedance value. More information about the metal/acidic solution characteristics is possible by using electrochemical impedance spectroscopy (EIS). Impedance measurements provide information on both the resistive and capacitive behaviour of the interface and makes possible to evaluate the performance of the studied inhibitors. Before each EIS experiments, as done with Tafel experiments, the electrode was allowed to corrode freely for an hour to obtain a steady-state open
circuit potential, corresponding to the corrosion potential, Ecorr, of the working electrode. EIS diagrams of mild steel
were plotted in concentrated hydrochloric acidic solution in the presence of organic oil and extract of (P.L) at 298 K.
The impedance is then represented as a complex number 9,
)
sin
(cos
)
exp((
)
(
ω
Z
0j
φ
Z
0φ
j
φ
I
E
Z
=
=
=
+
(5)The expression for Z(ω) is composed of a real and an imaginary part. If the real part is plotted on the Z axis and the imaginary part on the Y axis of a chart, we get a "Nyquist plot". Fig. 7 and 8 shows Nyquist plots obtained in uninhibited and inhibited acidic solutions at different concentrations of organic oil and extract of (P.L). The
parameters deduced are grouped in Table 4. Charge-transfer resistance values (Rt) and double layer capacitance
values (Cdl) have been obtained from impedance measurements as described previously. The following relation is
used to calculate E (%):
−
×
=
T TR
R
E
01
100
%
(6)Where RT and R*T are the charge-transfer resistance values with and without inhibitor, respectively. The values of
the double-layer capacitive associated with the loop and the frequency at which the imaginary component of the impedance is maximal (-Zmax) are calculated from the relation:
t
dL
f
R
C
=
1
/
2
⋅
π
⋅
max⋅
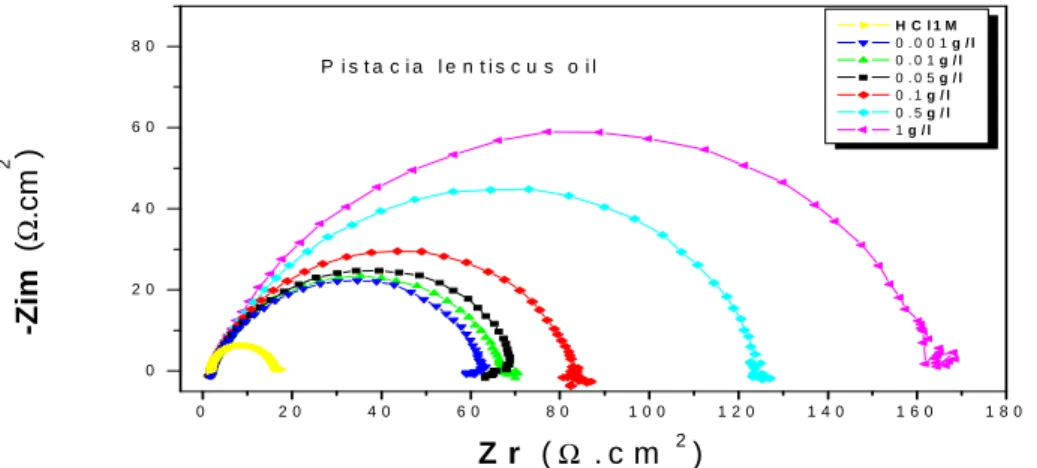
(7)where Rt is the diameter of the loop and fmax is the value of the frequency. Examination of Table 4 reveals that, more
and more the oil and extract of (P.L) concentration increases, RT rises to higher values showing that (P.L) inhibit
corrosion reaction. The decrease of Cdl is interpreted by the adsorption of inhibitor molecules on the metal surface.
The results obtained from the polarization technique in concentrated hydrochloric acidic solution were in good agreement with those obtained from the electrochemical impedance spectroscopy (EIS) with a small variation. The Nyquist diagram (Fig. 7 and 8) show that in the absence as well as presence inhibitor of all concentration can be seen that the plots exhibit depressed a single semicircle with only one capacitive loop in the entire frequency range. The adsorption is a result of electrostatic attraction between charged metal surface and charged species in the bulk of the solution. Positively charged species can also protect the positive.
0 2 0 4 0 6 0 8 0 1 0 0 1 2 0 1 4 0 1 6 0 1 8 0 0 2 0 4 0 6 0 8 0 -Z im ( Ω .c m 2 ) Z r (Ω . c m 2) H C l 1 M 0 . 0 0 1 g / l 0 . 0 1 g / l 0 . 0 5 g / l 0 . 1 g / l 0 . 5 g / l 1 g / l P i s t a c i a l e n t i s c u s o i l
Figure 7. Nyquist diagrams for mild steel in 1M HClcontaining different concentrations of Pistacia lentiscus oil
0 2 0 4 0 6 0 8 0 1 0 0 1 2 0 0 1 0 2 0 3 0 4 0 5 0 6 0
-Z
im
(
Ω
.c
m
2)
Z r (
Ω
. c m
2)
H C l1 M 0 . 0 0 1 g /l 0 . 0 1 g /l 0 . 0 5 g /l 0 . 1 g /l 0 . 5 g /l 1 g /l P i s t a c i a l e n t i s c u s e x t r a c tFigure 8. Nyquist diagrams for mild steel in 1M HClcontaining different concentrations of Pistacia lentiscus extract Table 4. Impedance parameters of steel in 1M HCl in the absence and presence of different concentrations of Pistacia lentiscus oil and
extract at 298 K Inhibitor C (g/L) Rt Rb (Htz) F µf/cmC 2 (%) E θ 1M HCl - 14.57 1.37 54.64 200 -- -- Oil 1 164 2.27 15.60 62.25 91.12 0.91 0.5 123 2.39 19.94 64.93 88.15 0.88 0.1 80 1.72 26.30 75.67 81.79 0.82 0.05 71 2.12 29.08 77.13 79.48 0.89 0.01 65 2.52 31.09 78.80 77.58 0.78 0.001 59 2.33 31.89 84.64 75.31 0.75 Extract natural 1 114 1.35 25.40 55 87.21 0.87 0.5 80 2.78 37.05 53.73 80.82 0.81 0.1 60 1.56 39.10 67.88 75.71 0.76 0.05 55 1.55 40.21 72 73.50 0.73 0.01 42 1.49 42.14 89.96 65.30 0.65 0.001 28 1.7 49.45 115 47.96 0.48
This transfer function is applicable for homogeneous systems with one time constant when the centre of the semicircle lies on the abscissa of real part. It is evident that it cannot describe the observed depression of the capacitive loop and it is necessary to replace the capacitor by some element taking into account frequency dispersion like the Constant Phase Element (CPE). This element is a generalised tool, which can reflect exponential distribution of the parameters of the electrochemical reaction related to energetic barrier at charge and mass transfer. Such phenomena often correspond to surface heterogeneity which may be the result of surface roughness, dislocations, distribution of the active sites or adsorption of inhibitors. In order to fit and analyze the EIS data, the equivalent
Figure 9. Suggested equivalent circuit model of the interface mild steel/1 M HCl with and without the studied oil inhibitors
3.3. Adsorption isotherm
The dependence of the fraction of the surface covered θ obtained by the ratio E%/100 as function of the inhibitors
concentration (Cinh) was graphically fitted for various adsorption-isotherms. The adsorption isotherm can be
determined if the inhibitor effect is due mainly to the adsorption on metallic surface (i.e. to its blocking). The adsorption isotherm type can provide additional information about the tested compounds properties. The fractional coverage surface (θ) can be easily determined from ac impedance, Tafel polarization or the linear polarization by the ratio IE%/100. In the present study, the inhibiting efficiency is evaluated from impedance measurements. If one
assumes that the values of IEimp% do no differ substantially from θ as shown in Table 2, 3 and 4 form different
methods. The adsorption isotherms models considered were as described in reference [57-59]:
Temkin isotherm exp (f.θ) = Kads Cinh
(8)
Frumkin isotherm
−
f
=
K
adsC
inh−
exp(
2
)
1
θ
θ
θ
(9)
Freundlich isotherm θ = Kads Cinh
(12)
Where Kads is the equilibrium constant of the adsorption process, Cinh is the inhibitor concentration and f is the factor
of energetic in homogeneity. According to the Langmuir’s isotherm, the surface coverage (θ) is related to inhibitor
concentration (C) by the following equation, where Kads is the equilibrium constant of the inhibitor adsorption
process:
1
inh inh adsC
C
K
=
+
Θ
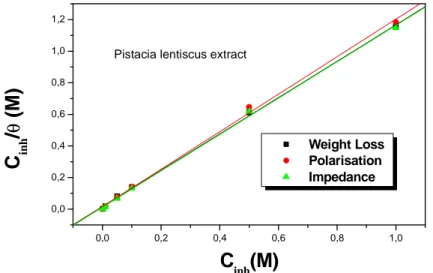
(13)As seen from Figure. 10 and 11, the plot of Cinh/θ versus Cinh yields a straight line with a correlation coefficient more
than 0.9998, showing that the adsorption of these inhibitors in acidic solutions is fitted to Langmuir adsorption isotherm. These results show that the inhibition of mild steel in HCl solutions by new synthesis compound derivatives is an adsorptive process equation.13. This isotherm assumes that the adsorbed molecules occupy only
one site and there are no interactions between the adsorbed species. The Kads values can be calculated from the
intercept lines on the C/θ-axis. This value is also related to the standard free energy of adsorption (∆G°ads), by the
following equation (14), where Cinh is the inhibitor concentration, Kads is the adsorption equilibrium constant, ∆G°ads
is the standard free energy of adsorption, 55.5 is the concentration of water in the solution in mol dm-3, R is the
universal gas constant and T is the absolute temperature in Kelvin:
(55.5
)
ads ads
G
°RTLn
K
∆
= −
(14)0,0 0,2 0,4 0,6 0,8 1,0 0,0 0,2 0,4 0,6 0,8 1,0 1,2 Weight Loss Polarisation EIS
C
in h/θ
(Μ
)
C
inh(M)
Pistacia lentiscus oil
Figure 10. Langmuir isotherm of steel in the 1M HCl in presence of oil at calculated by various method
0,0 0,2 0,4 0,6 0,8 1,0 0,0 0,2 0,4 0,6 0,8 1,0 1,2 Weight Loss Polarisation Impedance
C
in h/
θ
(
M
)
C
inh(M)
Pistacia lentiscus extractFigure 11. Langmuir isotherm of steel in the 1M HCl in presence of extract at calculated by various method
The standard free energy of adsorption ∆G0ads, which can characterize the interaction of adsorption molecules and
metal surface, was calculated. The large negative values of ∆G0ads ads ensure the spontaneity of the adsorption
process and the stability of the adsorbed layer on the mild steel surface as well as a strong interaction between different organic molecules forming the essential oil molecules and the metal surface.
Table 5. Equilibrium constant and free energy of adsorption values in presence of the studied Pistacia lentiscus oil and extract in 1 M HCl on mild steel different methods
Generally, values of ∆G0ads up to -20 kJ mol-1, the types of adsorption was regarded as physisorption, the inhibition
acted due to the electrostatic interactions between the charged molecules and the charged metal, while the values
Measurements Inhibitor Slope Kads
L mol-1 kJ mol∆ adsG° -1 Linear coefficient regression (r)
Weight loss Oil 1.03952 175.13 - 23.50 0.99983
Extract 1.1496 60.31 - 20.77 0.99953
Potentiodynamic Polarization Oil 1.07602 85.25 - 21.66 0.99901
Extract 1.18631 63.37 - 20.90 0.99911 Electrochemical impedance spectroscopy Oil 1.09685 142.25 - 22.97 0.99985
around -40 kJ mol-1 or smaller were associated with chemisorptions as a result of sharing or transfer of electrons from organic molecules to the metal surface to form a coordinate type of bond (chemisorptions).
Here, the calculated ∆G0ads values are ranging between 20.66 and 23.50 kJ mol-1, indicating that the adsorption
mechanism of Pistacia lentiscus oil and extract on mild steel in 1 M HCl solution at the studied temperature is physisorption (molecular). Moreover, the adsorption process depends on the electronic characteristics of the inhibitor, the nature of metal surface, temperature, steric effects and the varying degrees of surface-site activity. In
fact, the solvent H2O molecules could also be adsorbed at the metal/solution interface. Therefore, the adsorption of
inhibitor molecules from the aqueous solution can be considered as a quasi-substitution process between the
inhibitor in the aqueous phase Inh(sol) and water molecules at the electrode surface H2O(ads) [56,59,62-63]:
(8) where x is the size ratio, that is, the number of water molecules re-placed by one organic inhibitor. This is possible in case of positive as well as negative charges on the surface. The presence of a transition metal, having vacant, low-energy electron orbital, and an inhibitor molecule having relatively loosed bound electrons or heteroatom with lone-pair electrons facilitates this adsorption [29]. On the other hand, all different organic molecules forming the essential oil; which possess oxygen atoms and lone-pair electrons, can accept a proton, leading to the cationic forms. These species can absorb on the metal surface because of attractive forces between the negatively charged metal and the positively inhibitors.
CONCLUSION
The principle finding of the present work could be summarised as follows:
The inhibition efficiency increases with increasing inhibitor concentrations to attain a maximum value of 96.34 % and 86.59% at 1g/L for oil and extract respectively.
Measurements had shown that the Pistacia lentiscus oil and extract acted predominantly as a mixed inhibitor type for the corrosion of steel in 1M HCl without modifying the mechanism of hydrogen evolution reaction.
The transfer resistance of the system increased when the inhibitor was added to the solution.
The adsorption of the Pistacia lentiscus oil and extract on the steel surface in molar hydrochloric acid according to the Langmuir isotherm
Weight loss, electrochemical and EIS measurements were in good agreement.
REFERENCES
[1]D. Bouknana, B. Hammouti, A. Bouyanzer, A. Aouniti and M. Sbaa, J. Chem. Pharm. Res., 2013, 12(5), 1179-1194
[2]K. Barouni, A. Kassale, L. Bazzi, R. Salghi, B. Hammouti, A. Albourine, S. El Issami, O. Jbara, and M. Bouachrine, Research on Chemical Intermediates, 2014, 40(3), 991-1002.
[3]I. Belfilali, A. Chetouani, B. Hammouti, S. Louhibi, A. Aouniti, and S. S. Al-Deyab, Research on Chemical
Intermediates , 2014, 40(3), 1069-1088.
[4]K. Bouhrira, A. Chetouani, D. Zerouali, B. Hammouti, A. Yahyi, A. Et-Touhami, R. Yahyaoui, and R. Touzani,
Research on Chemical Intermediates, 2014, 40(2), 569-586.
[5]L. Afrine, A. Zarrouk, H. Zarrok, R. Salghi, R. Touir, B. Hammouti, H. Oudda, M. Assouag, H. Hannache, M. El Harti and M. Bouachrine, J. Chem. Pharm. Res., 2013, 12(5), 1474-1481
[6] A. Laqhaili, A. Hakiki, M. Mossaddak, M. Boudalia, A. Bellaouchou, A. Guenbour, M. El Morhit, B. Hammouti, J. Chem. Pharm. Res., 2013, 12(5),1297-1306.
F. Bentiss, M. Lebrini, N. E. Chihib, M. Abdalah, C. Jama, M. Lagrenee, S. S. Al-Deyab, and B. Hammouti, Int J
Electrochem Sci, 2012, 7(5), 3947-3958.
[8] H. Z. Alkhathlan, M. Khan, M. M. S. Abdullah, A. M. Al-Mayouf, A. A. Mousa, and Z. A. M. Al-Othman, Int J
Electrochem Sci,, 2014, 9(2), 870-889.
[9] L. Afia, R. Salghi, L. Bammou, L. Bazzi, and B. Hammouti, Acta Metallurgica Sinica-English Letters, 2012, 25(1), 10-18.
[10] A. Gulsen, Research on Chemical Intermediates, 2012, 38(7), 1311-1321.
[11] C. Belbachir, A. Aouniti, M. Khamri, A. Chafi, B. Hammouti, J. Chem. Pharm. Res., 2013, 12(5),1307-1314. [12] H. A. Fetouh, T. M. Abdel-Fattah, and M. S. El-Tantawy, Int J Electrochem Sci, 2014, 9(3), 1565-1582. [13] L. Y. S. Helen, A. A. Rahim, B. Saad, M. I. Saleh, and P. B. Raja, Int J Electrochem Sci, 2014, 9(2), 830-846. [14] A. R. Hoseinzadeh, I. Danaee, M. H. Maddahy, and M. R. Avei, Chemical Engineering Communications, 2014, 201(3), 380-402.
[16] N. Benhammou, F.A. Bekkara, T.K. Panovska, J. Pharm. Pharmacol, 2008, 2, 22-28
[17] D. Atmani, N. Chaher, M. Berboucha, K. Ayouni, H. Lounis, H. Boudaoud, N. Food Chem, 2009, 112, 303– 309.
[18] S. Zrira, A. Elamrani, B. Benjilali, Flavour Fragr. J,2003, 18, 475–480.
[19] M.E. Duru, A. Cakir, S. Kordali, H. Zengin, M. Harmandar, S. Izumi, T. Hirata, Fitoterapia, 2003, 74, 170– 176.
[20] A. Barra, V. Coroneo, S. Dessi, P. Cabras, A. Angioni, J. Agric. Food Chem, 2007, 55, 7093–7098. [21] C. Gardeli, P. Vassiliki, M. Athanasios, T. Kibouris, M. Komaitis, Food Chem, 2008, 107, 1120–1130. [22] A. Fernandez, A. Camacho, C. Fernandez, A. Altarejos, P. Perez, J. Essent. Oil Res, 2002, 12, 19–23. [23] R.Y. Bentley, H. Trimen, Medicinal plants. In Gardeli et al. (eds) Food Chem, 1980, 1–11.
[24] D. Palevitch, Z. Yaniv, J. Ethnopharmacol, 2000, 100, 198–204.
[25] Quality standards of Indian medicinal plants. ICMR. 2006, 4, 18-27. Qurabaddin majeedi. 1986, 57.
[26] L. Predrag, A. Hassan, P. Irina, C. Uri, S. Omar, A.S. Khalid, B. Arieh,. J. Ethnopharmacol, 2005, 99(1), 43– 47.
[27] D. Palevitch, Z. Yaniv, Medicinal Plants of the Holy Land (Modern Publishing House, Tel Aviv, 2000). [28] J. Duke, Medicinal Plants of the Bible (Trado-Medic Books, New York, 1983).
[29] M.S. Al-Said, A.M. Aggel, N. Parmar, M. Tariq, J. Ethnopharmacol,1986, 15, 271–278 [30] A. Koedam, J. Sci. Food Agric, 1986, 36, 681–684.
[31] M. O ¨ zcan, Lebensmittelunters. u. -Forsch, 1998, A 207, 253–255. [32] M. O ¨ zcan, N. Boyraz, Eur. Food Res. Technol, 2000, 212, 86–88.. [33] S. Basgel, S.B. Erdemoglu, Sci. Total Environ, 2005, 359(1–3), 82–89. [34] M. Ozcan, Y. Akgul Bagci, H. Dural. S. U. Sci. J, 1998, 15, 72–77.
[35] M.J. Strong, R.M. Garruto, A.J. Nonneman, Plenum Press, New York, 1994, 39–88.
[36] R.M. Garruto, T.P. Flaten, I. Wakayama, Advances in Clinical and Basic Research, ed. by B. Corain, H. Wisneiwski, P. Zatta, Wiley, New York, 1993, 257–266.
[37] M. Anke, B. Groppel, H. Kronemann, Walter de Gruyter & Co, Berlin, 1984, 421–464. [38] W. Metz, Food Process,1982, 41(11), 2807–2812.
[39] C.P. Sanchez-Castillo, P.J.S. Dewey, A. Aguirre, J.J. Lara, R. Vaca, P. Leon de la Barra, M. Ortiz, I. Escamilla, W.P.T. James, J. Food Compost. Anal, 1998, 11, 340–356.
[40] C.C. Tassou, G.J. Nychas, Int. Biodeterior. Biodegrad, 1995, 36, 411–420. [41] L. Bonsignore, F. Cottiglia, G. Loy, Fito- terapia, 1998, 69, 537–538
[42] G.B. Serafino, L. Bono, L. Daghetta, P. Marone, J. Gastroenterol, 2001, 96(9), S49.
[43] F. Ben Douissa, N. Hayder, L. Chekir-Ghedira, M. Hammami, K. Ghedira, A.M. Mariotte, M. Dijoux-Franca,
Flavour Fragr. J, 2005, 20, 410–414.
[44] K.V. Balan, J. Princea, Z. Hana, K. Dimasb, M. Cladarasc, J.H. Wychea, N.M. Sitarasd, P. Pantazis, chia.
Phytomedicine, 2007, 14, 263–272
[45] E.M. Giner-Larza, S. anez, R.M. Giner-Pons, C.M. Recio, J.L. Rios, J. Ethnopharmacol, 2000, 73, 61–69. [46] A.N. Assimopoulou, S.N. Zlatanos, V.P. Papageorgiou, Food Chem, 2005, 92, 721–727.
[47] N. Benhammou, A.B. Fawzia, K.P. Tatjana, Food Sci, 2007, 29(3), 155–161. [48] M.H. Boelens, R. Jimenez, Flavour Fragr. J, 1991, 6, 271–275.
[49] H.L. DePooter, N.M. Schamp, E.A. Aboutabl, S.L. El Thoamy, S.L. Doss, Flavour Fragr. J, 1991, 6, 229–232 [50] E. Miniati, Fitoterapia, 1981, 6, 267–271.
[51] L. Iauk, S. Ragusa, A. Rapisarda, S. Franco, V.M. Nicolosi, J. Chemother, 1996, 8, 207–208.
[52] M. Znini, G. Cristofari, L. Majidi, A. Ansari, A. Bouyanzer, J. Paolini, J. Costa, and B. Hammouti,
International Journal of Electrochemical Science, 2012, 7(5), 3959-3981.
[53] M. Znini, L. Majidi, A. Bouyanzer, J. Paolini, J. M. Desjobert, J. Costa, and B. Hammouti, Arabian Journal of
Chemistry, 2012, 5(4), 467-474.
[54] M. Znini, J. Paolini, L. Majidi, J. M. Desjobert, J. Costa, N. Lahhit, and A. Bouyanzer, Research on Chemical
Intermediates,2012, 38(2), 669-683.
[55] G. Cristofari, M. Znini, L. Majidi, A. Bouyanzer, S. S. Al-Deyab, J. Paolini, B. Hammouti, and J. Costa,
International Journal of Electrochemical Science, 2011, 6(12), 6699-6717.
[56] A. Ousslim, K. Bekkouch, A. Chetouani, E. Abbaoui, B. Hammouti, A. Aouniti, A. Elidrissi, and F. Bentiss,
Research on Chemical Intermediates, 2014, 40(3), 1201-1221.
[57] I. Belfilali, A. Chetouani, B. Hammouti, A. Aouniti, S. Louhibi, and S. S. Al-Deyab, Int J Electrochem Sci,,
2012, 7(5), 3997-4013.
[58] D. Bouzidi, A. Chetouani, B. Hammouti, S. Kertit, M. Taleb, and S. S. Al-Deyab, Int J Electrochem Sci,, 2012, 7(3), 2334-2348.
[59] A. Chetouani, K. Medjahed, S. S. Al-Deyab, B. Hammouti, I. Warad, A. Mansri, and A. Aouniti, International
[60] S. El Ayyoubi, A. Chetouani, Hammouti, A. Warthan, A. Mansri, and S. S. Al-Deyab, International Journal of
Electrochemical Science, 2012, 7(2), 1639-1655.
[61] F. Bentiss, M. Outirite, M. Traisnel, H. Vezin, M. Lagrenee, B. Hammouti, S. S. Al-Deyab, and C. Jama, Int J
Electrochem Sci,, 2012, 7(2), 1699-1723.
[62] , A. Zarrouk, H. Zarrok, R. Salghi, R. Touir, B. Hammouti, N. Benchat, L. L. Afrine, H. Hannache, M. El Hezzat and M. Bouachrine, J. Chem. Pharm. Res., 2013, 12(5), 1482-1491.
[63] H. Zarrok, S. S. Al-Deyab, A. Zarrouk, R. Salghi, B. Hammouti, H. Oudda, M. Bouachrine, and F. Bentiss,
International Journal of Electrochemical Science, 2012, 7(5), 4047-4063.
[64] B. M. Fernandez-Perez, J. A. Gonzalez-Guzman, S. Gonzalez, and R. M. Souto, Int J Electrochem Sci,, 2014, 9(4), 2067-2079.
[65] B. P. Markhali, R. Naderi, M. Mahdavian, M. Sayebani, and S. Y. Arman, Corrosion Science, 2013, 75(0), 269-279.
[66]S. Neema, M. Selvaraj, J. Raguraman, and S. Ramu, Journal of Applied Polymer Science, 2013, 127(1), 740-747.
[67] Y. Ando, K. Mizutani, and N. Wakatsuki, Journal of Food Engineering, 2014, 121(0), 24-31.
[68] L. Afia, R. Salghi, E. H. Bazzi, A. Zarrouk, B. Hammouti, M. Bouri, H. Zarrouk, L. Bazzi, and L. Bammou,


![[PDF] Support de formation complet sur le traitement de texte avec Word - Bureautique](data:image/gif;base64,R0lGODlhAQABAIAAAP///wAAACH5BAEAAAAALAAAAAABAAEAAAICRAEAOw==)