Development of a new genetic evaluation model for
carcass quality based on crossbred performances of
Piétrain boars in the Walloon Region of Belgium
M. Dufrasne
*, H. Hammami
*, V. Jaspart
†, J. Wavreille
‡and N. Gengler
*§Introduction
Until recently, Piétrain boars in the Walloon Region of Belgium were evaluated using performances recorded on their purebred progeny. However, these boars are mostly used in crossbreeding programs. As genetic correlation between purebred and crossbred performances are considered to be rather low and varying between 0.4 and 0.7 for pigs (Dekkers (2007)), the genetic merit of boars should be established for crossbred performances. Therefore since 2007, a new genetic evaluation system has been developed in the Walloon Region of Belgium. Piétrain boars are now only evaluated on performances recorded on their crossbred progeny with Landrace sows. These crossbred progeny are fattened in a central test station between about 20 and 110 kg live weight.
The aim of this study was to contribute to the development of this new genetic evaluation system of boars. This was made by the development of a genetic evaluation model for some carcass quality traits to have a tool that allows selection of boars with a high lean meat percentage on carcass.
Material and methods
Material. Data utilized in this study were provided by the so-called on-farm performance
recording system, which is also used at the central test station. Backfat thickness (BF) and loin muscle depth were recorded on live animals by ultrasound using the Piglog 105 apparatus. This strategy provided data recorded on animals from the test station, measured the week before slaughtering, but also on boars themselves and other related animals on their farms of origin. The data file contained 60 546 measures recorded on 56 822 different pigs between 150 and 300 days of age. Therefore, some pigs were measured several times, with only 6 % of repeated records. Animals used needed to have a breed composition of at least 40 % Piétrain or Landrace in order to have pigs with a similar breed composition to that of animals from the test station. Recorded animals were females, entire and castrated males.
Methods. Traits analysed in this study were BF and meat percentage (%meat), predicted
from BF and loin muscle depth measurements. These two traits vary with the age of animals, representing longitudinal data. Therefore, their evolution could be represented as a function of time. Random regression models could be applied and should be efficient to model this type of data (Schaeffer (2004)).
* Animal Science Unit, University of Liege Gembloux Agro-Bio Tech, B-5030 Gembloux, Belgium † Walloon Pig Breeders Association, B-5590 Ciney, Belgium
‡ Walloon Agricultural Research Centre, B-5030 Gembloux, Belgium § National Fund for Scientific Research, B-1000 Brussels, Belgium
The model developed was an animal model. Fixed effects were sex, contemporary groups and heterosis. A clustering algorithm created contemporary groups containing at least three animals measured at the same location in a time interval of maximum 75 days. This allows having groups of animals which are in similar environmental conditions to achieve their performances. Heterosis effect was modeled as fixed regression on heterozygosity. Heterozygosity of an animal was computed based on the breed composition of his parents according to their percentage of Piétrain, Landrace and crossbred types.
Random effects were additive genetic, permanent environment and residual. Additive genetic and permanent environment effects were modeled by random regressions using linear splines with three knots at 175, 200 and 250 days.
Variance components were estimated by restricted maximum likelihood (REML) method and then by a Gibbs sampling algorithm. Indeed, variance components estimation was not possible by REML on the total data file because of computing requirements. Therefore, initially, estimation was made by REML on six random samples of the total dataset and for each trait. The random sampling was based on the originated exploitation of pigs. One sample contained approximately 10 000 records. After that, variance components were estimated by a Gibbs sampling algorithm on the total dataset for each trait. Starting parameters were the mean of the estimated parameters by REML for the six random samples. Finally, variance components were estimated with a multitrait animal model for the two traits analyzed (BF and %meat), with a Gibbs sampling algorithm.
Fit of the model was tested by computing residuals from a BLUP (Best Linear Unbiased Prediction) evaluation. Ideally, residuals should be as small as possible so that the model explains the greatest proportion of variance. The t-test of student was used to test whether the means of residual distributions were significantly different from zero.
Results and discussion
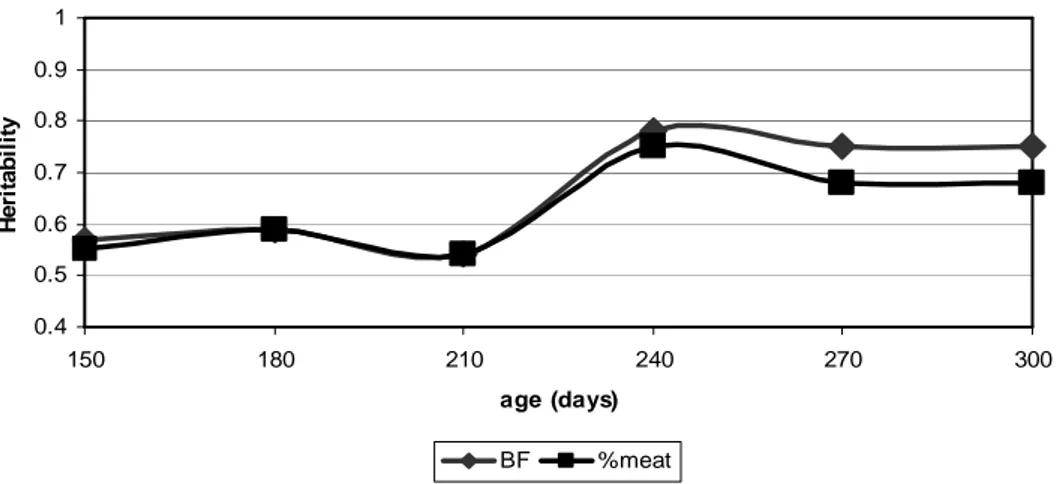
Results presented are obtained with the multitrait animal model by Gibbs sampling. The evolutions of estimated heritabilities for BF and %meat are shown in figure 1. These are two traits with a high heritability that increased between 150 and 300 days from 0.56 to 0.75 for BF and from 0.55 to 0.69 for %meat. These results are consistent with those reported on literature (e.g. Lo et al. (1992); Hermesch et al. (2000a,b); Edwards et al. (2006); Habier et
al. (2007)). Genetic correlations between BF and %meat for six time points separated by 30
days are presented in table 1. BF and %meat were highly correlated, with genetic correlations lower than -0.90. That is also in agreement with results presented in other studies (e.g. van Wijk et al. (2005)).
0.4 0.5 0.6 0.7 0.8 0.9 1 150 180 210 240 270 300 age (days) H e ri ta b il it y BF %meat
Figure 1: Evolution of estimated heritability for BF and %meat between 150 and 300 days
Observed wobbling of the estimated heritability was an artifact due to the way that variances were modeled by random regression model with linear splines.
Table 1: Genetic correlation between BF and %meat
Age (d) Genetic correlation
150 -0.90 180 -0.90 210 -0.94 240 -0.94 270 -0.93 300 -0.93
Figure 2 shows the evolution of the mean of the residuals for each trait with age. According to this figure, mean residual was close to zero for both traits at any age. The means of residual distributions of the two traits were not significantly different from zero (P Value = 0.7977 for BF and P Value = 0.1476 for %meat).
These results show that the model developed allows a good fit. The relative lost of fit at the very low and very high ages can be explained by the fact that less data was available and also because splines were extrapolated outside their optimal range.
Solutions for heterosis effects showed that crossbred animals had 13 % lower BF and 1.6 % higher %meat values than the average of the population.
Conclusion
Given that BF and %meat had high heritability and also high genetic variance (results not shown), genetic improvement of carcass quality is possible by genetic selection based on these traits. Moreover genetic correlation was high between BF and %meat, so selection to increase %meat could be based only on one of these two traits. Selection on BF would be preferred because it is a trait that is measured while %meat is predicted from BF and loin muscle depth measurements. According to the study of residuals, the developed model was considered to fit well the data especially between 175 and 250 days of age.
Acknowledgements
The authors gratefully acknowledge the financial support of the Ministry of Agriculture of the Walloon Region of Belgium, the support of the Walloon Pig Breeders Association (AWEP) and the collaboration of the Walloon Agricultural Research Centre (CRA-W). Nicolas Gengler, a research associate of the National Fund for Scientific Research (Brussels, Belgium) acknowledges his support. Additional support was provided through grants 2.4507.02F (2) and F.4552.05 of the National Fund for Scientific Research.
References
Dekkers, J.C.M. (2007). J. Anim. Sci., 85:2104-2114.
Edwards, D.B., Tempelman, R.J. and Bates, R.O. (2006). J. Anim. Sci., 84:266-275. Habier, D., Götz, K.-U. and Dempfle, L. (2007). Livestock Science, 107:142-151. Hermesch, S., Luxford, B.G. and Graser, H.-U. (2000a). Livestock Production Science,
65:239-248.
Hermesch, S., Luxford, B.G. and Graser, H.-U. (2000b). Livestock Production Science, 65:249-259.
Lo, L.L., McLaren, D.G., McKeith, F.K. et al. (1992). J. Anim. Sci., 70:2387-2396. Schaeffer, L.R. (2004). Livestock Production Science, 86:35-45.