Precursors to avalanches in a granular monolayer
T. Scheller,1C. Huss,2G. Lumay,1N. Vandewalle,1 and S. Dorbolo11GRASP, Physics Department, University of Liège, B-4000 Liège, Belgium
2Algebraic Analysis, Department of Mathematics, University of Liège, B-4000 Liège, Belgium !Received 3 April 2006; revised manuscript received 27 June 2006; published 28 September 2006"
We investigate the stability of a granular monolayer composed of spherical grains on an inclined plate. When the tilt angle ! increases, some reorganizations are observed throughout the pile. The packing fraction " of the packing evolves by successive jumps. Those discontinuous events precede the collapse of the pile at a critical angle !c. The occurrence of precursors before avalanches is modeled by stop-and-go motions of blocks due to
the competition between sliding friction and the Janssen effect#J. Durand, Sands, Powders, and Grains: An
Introduction to the Physics of Granular Materials!Springer-Verlag, New York, 2000"$.
DOI:10.1103/PhysRevE.74.031311 PACS number!s": 45.70.Cc, 05.20.#y
INTRODUCTION
The industrial processing of granular materials implies knowledge of the critical angles of a granular heap. Indeed, the critical angle is a major parameter when emptying a silo or mixing granular species#2–4$. Actually, the critical angle of a granular medium has been intensively studied. Different experimental setups#5–8$ and numerical models #9$ can be found in the literature, studying repose angles of granular heaps, before and after avalanches. The theoretical models #10,11$ are mostly based on hydrodynamic equations or on geometrical considerations#12$. In #4$, the authors were in-terested in critical angles and avalanches of small granular systems with a small number of layers. Not many publica-tions can be found considering only one granular layer, called a two-dimensional monolayer. Very recently, one of us measured the critical angle of a monolayer by tilting it up to avalanche#13$. By considering a granular monolayer of ini-tial height h0/d!d being the mean grain diameter" and width ! / d, the physical mechanisms behind the formation of an avalanche have been studied. The behavior of the avalanche angle!cwith respect to the aspect ratio h0/! of the mono-layer was determined in order to discuss the influence of the grain polydispersity and the friction. A model based on a critical force F for grain ejection and further avalanche ini-tiation has been elaborated. The force F can be related to the height h of the heap as
mgh!sin!c−$scos!c" = F !1" where m is the mass of a line of beads and $s is the static friction.
In this paper, the tilted monolayer experiment is reconsid-ered with respect to grain ordering. The packing aspect ratio is fixed to a constant, namely, h0=90 bead diameters and ! =30 bead diameter. The volume fraction " of the pile is measured prior to occurrence of the avalanche. Interesting behaviors are evidenced and explained.
After the description of the experimental setup and the measurement method, 30 experiments will be presented. A phenomenological model will be extracted from the observa-tion. It is based on a partition of the heap into blocks that can move and reorganize the heap giving the discontinuous ob-served compaction curves with respect to the angle.
EXPERIMENTAL SETUP
The granular monolayer is composed of 2800 millimetric ceramic beads. The mean grain diameter is d=2.0±0.2 mm. Thus, the grain polydispersity is non-negligible because it represents about 10%.
The friction between the beads and the glass plane has been estimated as follows#14$. Beads have been pasted onto a slider. The slider is placed onto a horizontal plate and hori-zontal force is applied by the use of a pulley. The force is increased till the slider moves. The force at which the slider moves is related to the static friction coefficient $=tan!s
which corresponds to an angle of %!s&=18.3° ±2.8°. This
corresponds to a friction coefficient$=0.33. The same ex-periment has been performed to estimate the friction between the beads and the vertical borders of the pile, composed of aluminum rods. The corresponding coefficient friction $
!
was found to be equal to 0.6.
The experimental setup is composed of a glass plate that is allowed to rotate around one of its sides. The rotation is driven by an electrical motor with high torque capability. The angle! of the inclined plane to the horizontal level is mea-sured with a high-precision tachometer !2500 pulses per round" such that the precision is about 0.15°.
Each measurement is operated as follows. The heap is first created on the glass plate. In order to avoid jamming, the beads are placed onto the plate with an initial angle!=2°. At this angle, the beads start to roll and pack together. A loose packing is thus obtained. This monolayer is characterized by a width ! and an initial height h0. The height h0of the heap is determined by the number of beads put into the system,
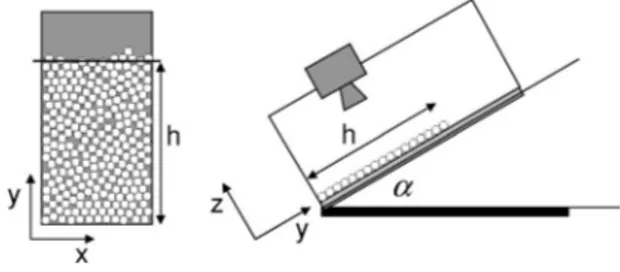
FIG. 1. Sketch of the experimental setup.!Left" View from the camera of the two-dimensional !2D" pile of average height h. !Right" Lateral view of the setup.
the interface of the monolayer being approximated by a straight line. The angle of the plane is then slowly increased. A camera, fixed at the top of the plane and moving with the plane!see Fig. 1", takes successive pictures of the packing. By image treatment, the interface of the monolayer is de-tected and averaged by a straight line. By following the mo-tion of those beads, the height h of the packing is tracked during the elevation of the plane. In so doing, the variations of h are related to the angle!.
Figure 2 presents six snapshots of the upper grains at different stages of the experiment. Before the collapse of the pile, a compaction of the monolayer is observed since the mean position of the upper grains seems to fall slowly. The height of the monolayer is seen to experience an average modification of 1% before collapsing. In other words, h0 changes by about one bead diameter.
From the height measurements, it is possible to estimate the packing volume fraction " which we defined as the in-verse ratio between the volume of the monolayer and the volume of a parallelepiped solid of ceramic that has the same length, thickness, and mass, namely,"=!hrd/!hd where d is
the bead diameter, ! and h the effective length and height of the monolayer, and hr the equivalent height of the parallel-epiped of bulk material. The initial loose packing fraction is about "0=0.683±0.004. The final packing fraction, before the avalanche starts, has a larger value "f=0.696±0.004.
Those densities are far from the close packing limit "cp
'%/2
(
3'0.91.In the following, the experimental data are normalized by the angle of collapse !cand the initial and final density "0 and"f, !*= ! !c, !2" "*= "−"0 "f−"0 = h− h0 hf− h0 hf h, !3"
in order to remove undesired effects due to packing initial-ization.
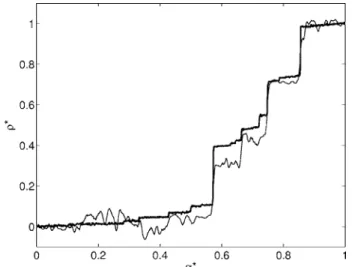
Figure 3 presents the normalized packing fraction as a function of the normalized angle. The packing fraction in-creases in a staircase manner. Each “jump” &"* in that plot should be attributed to a global motion of grains in the pack-ing and to a variation of the total height h of the pile.
An alternative method of measurement of the density has been used. The total holes area in the packing is also a mea-sure of the compactness. Both methods are reported in Fig.3. Significant steps are seen on both curves, indicating global reorganizations of the heap that are responsible for compac-tion. The curve obtained with the second method exhibits more noise. This shows that local reorganizations also occur. These internal motions do not affect directly the global den-sity. Only the first method!height tracking" will be consid-ered in the following.
EXPERIMENTAL RESULTS
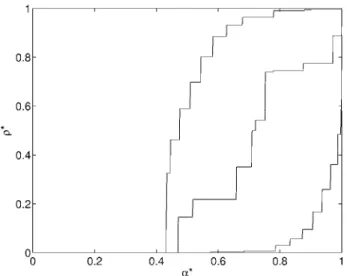
Figure4 presents 30 different packing fraction measure-ments as a function of !*. Around the mean critical angle %!c&=15.3° ±0.6°, all the beads above roll and move
to-gether: the monolayer collapses and the avalanche occurs. The avalanche angle !c being nearly of the order of the sliding angle !s confirms the measurements in #13$ for the mentioned aspect ratio of the pile. Even though the ava-lanches take place at a well-defined value of the tilt angle!c,
the packing is submitted to a variable number of collective reorganizations.
For small angles!!*'0.3", a small increase of the nor-malized density is observed because of the rolling of the grains at the top of the pile. After this first stage, a staircase evolution of the packing fraction "* is observed. All stair-cases are located in a wide area defined between two bound-ary curves!thick lines" illustrated in Fig.4, representing the maximum!minimum" of"*with respect to!*. On average, a
FIG. 3. The normalized packing fraction "*as a function of the tilt angle !*. The thick curve density is measured by tracking the interface of the packing. The thin curve corresponds to total hole area distribution in the packing compared to that of the beads.
FIG. 2. Successive pictures of the interface of a granular layer when the tilt angle ! increases. A compaction of the mono-layer is seen since the mean position of the upper grains seems to fall slowly. The last picture shows the pile just after the collapse at !=!c. This occurs at !c'16° for this pile.
dozen!12±3" of jumps of the packing fraction &"*are ob-served. They are separated by frozen stages of variable lengths &!*. The discontinuous evolution of the density in-dicates that a large number of grains move together. This behavior is quite different from the common continuous compaction curves observed in vibrated granular systems #15$. The origin of the collective motions observed in pack-ing fraction measurements should be found in motions of blocks or domains of large numbers of beads.
The staircase evolution of the compaction shows that large voids are suppressed by the motion of a certain amount of beads. That suggests that the monolayer may be decom-posed into a partition of blocks of given sizes separated by voids of given sizes. The next section is devoted to describ-ing the decomposition into blocks and the search for the most probable distribution of the blocks.
BLOCK AND VOID SIZE DISTRIBUTIONS
In order to capture the physical mechanisms behind the jumps, we elaborated a simple model based on the existence of N+1 blocks of grains in the packing. Even though some polydispersity of the grains exists, domains!blocks" should be considered as regions of united grains. A block is defined as a set of adjacent grains that can move together. In the model, the blocks have a constant width ! and a variable !random" height s determining the size of the blocks. At the beginning of the simulation, the blocks are separated by ran-dom voids as illustrated in Fig. 5. When the plate is tilted, the blocks are allowed to slip and merge in order to form a denser packing.
The number N and the size distribution of the voids be-tween the blocks in the monolayer may be assimilated to the size distribution of the N pieces of a broken 1D solid. When breaking N−1 times an initially 1D object of length 1, one can show that the probability that a final piece is smaller than xis given by
P!x" = 1 − !1 − x"N−1, !4" which corresponds by definition to a cumulative distribution function.
Experimentally speaking, the initial organization of the beads on the plate also divides the whole pile into N+1 blocks or domains and N voids between. We suppose that the height variations of the pile &h are representative of void size distribution. As we measured a total height variation of about 1% up to the critical angle !c, we can consider this height variation as being broken into N pieces giving the voids between blocks. The number of voids N is then given by the mean number of jumps in h!!". Experimentally, we found N=12±3. Using that value, the cumulative distribu-tion of the void size is given by Eq.!4" with N=12.
The probability distribution function of height variations of the pile &h is shown on Fig.6. This quantity is related to the number of voids that are suppressed during the compac-tion of the curve. The plot represents the experimental dis-tribution of &h, whereas the curve gives the probability func-tion !P/!&h defined as the derivative of relation !4", with N=12. This line is not a numerical fit but a well-defined analytic function with one fixed parameter N. The curve agrees with the experimental data. One can show that the proposed theoretical function agrees with experimental data independent of the number of classes of the histogram.
SLIPPING BLOCK MODEL
Let us now describe the dynamics of the blocks. In the model, the slipping of the blocks is determined by the static friction !$e" with the plate and also the presence of arches
redirecting the weight of the blocks to the edges of the pile
FIG. 4. Normalized packing fraction "*as a function of the tilt angle !*. For the same set of beads, the plot presents 30 different experiments. The thick curves correspond to the maximum and
minimum values obtained in this plot. FIG. 5. Sketch of the “slipping block model” described in the text.!top" A defined number of blocks are placed onto a tilted plate. They are separated by small voids.!bottom" When the tilt angle is increased, some blocks may slip and merge, forming a larger block and a denser system.
!Janssen effect", where an additional friction !$e
!
" occurs. Wepropose to introduce these effective static friction coeffi-cients$eand$e
!
, which are smaller than the measured$and$!. This hypothesis is confirmed experimentally: in fact, dur-ing a reorganization in the pile, one observes motions of large domains of grains, but inside these domains, we notice that some of the grains slip and others rather roll inside these blocks. Thus$emay be interpreted as an effective threshold of the grains for rolling and slipping.
The slipping of the blocks leads to N reorganizations in the pile. When the height of blocks is large, the Janssen !arching" effect increases. This happens when some blocks merge. As the density is related only to the position of the upper block, only the upper block is allowed to move and to merge with the second one !see Fig. 5", since the Janssen effect is the lowest there. The density then changes when the top block moves.
The weight component P of a block of volume !sd along the plate is given by
P="cp(!sdg sin!!" !5"
where( is the mass per volume unit of the beads. The friction force applied to a block is given by
F=$e"cp(!dsg cos!!" + 2$e
!
ds%ph& !6"where the first term is the friction of the block on the glass plate and the second term is the friction on both edges due to the Janssen effect. The second term is based on the horizon-tal pressure ph averaged along the block edges, i.e.#1$,
%ph& = 1 s
)
0 s(g! 2$e!
*
1 − exp+
− 2K$e!
y !,
-
dy. !7" The block is expected to slide when P)F. The parameter K is the redirection coefficient constant from the Janssen law ph=Kpvwhere pvis the vertical pressure exerted on a blockby the weights of the other blocks#1$. This constant is dif-ficult to measure but we can estimate it by the following. The angle of collapse !c is very close to arctan$ #13$. That
means that the Janssen effect is low for the considered length of the monolayer. We may estimate that the length of the monolayer is about the characteristic length of action of the Janssen effect. Considering the exponential term in relation !7", K must be of the order of !/2$
!
hwhich is about 0.30.When the Janssen effect is omitted, all blocks are slipping at the same angle!s. A single jump is thus expected. How-ever, when the Janssen effect is considered, more jumps oc-cur. One obtains a staircase evolution illustrated in Fig. 7. The initial number of voids N, which is a parameter in our model, defines the number of steps in the staircase. When the sizes of the voids are randomly chosen, the model repro-duces the behavior pretty well.
In order to test the model, nonrandom situations have been tested. Two cases have been considered and shown in Fig.7. They correspond to orderings of the blocks. The upper curve with negative curvature corresponds to an increasing local packing fraction downward in the pile. This means that we sort the blocks and the interstices in order that the pack-ing fraction at the top of the pile is lower than the local packing fraction at the bottom of the pile. The curve with positive curvature represents the other extreme organization, which means decreasing local packing fraction from top to bottom.
One understands that the monolayer behavior defines a region in the"!!" plot between the limiting curves described
above. The area of this region is inversely proportional to the number of domains in the packing. Indeed, random distribu-tions of blocks will always lead to staircase trajectories be-tween those curves. These random organizations of the pile are experimental artifacts due to the initialization of the monolayer: it is impossible to reproduce exactly the same monolayer a second time, considering the fact that the num-ber of beads is very important!about 2800".
Of course, the model proposed herein is quite simple but it has the advantage of evidencing the main physical
ingre-FIG. 6. Probability distribution function of &h. The curve gives the theoretical probability function !P/!&h with N=12.
FIG. 7. The normalized packing fraction "*as a function of the tilt angle !*for N=12 blocks. Three staircases illustrate different initial organizations of the blocks. The different curves represent increasing !decreasing" packing fraction downward in the pile #negative !positive" curvature curve$, and random distribution through the pile.
dients of the studied phenomena. We suspect that the granu-lar monolayer could also exhibit more complex physical mechanisms such as aging and memory effects#16,17$. This will be examined in our future work.
CONCLUSIONS
In summary, we have evidenced reorganizations of a granular monolayer before an avalanche occurs. Those pre-cursors are modeled as stop-and-go motions of domains due to the competition between the Janssen effect and friction.
The size of the events follows the statistics of the fragmen-tation process in one dimension. Of course, the dynamics of a granular monolayer is more complicated than described in this work: rotation of beads, internal arches, and other mechanisms should interfere. However, the proposed model reflects the observed phenomena.
ACKNOWLEDGMENTS
Part of this work has been supported by the ARC Contract No. 02/07-293. Fruitful discussions with T. Gilet and J. Wen-genroth are acknowledged.
#1$ J. Durand, Sands, Powders, and Grains: An Introduction to the
Physics of Granular Materials !Springer-Verlag, New York, 2000".
#2$ N. Lecocq and N. Vandewalle, Phys. Rev. E 62, 8241 !2000". #3$ D. A. Robinson, and S. P. Friedman, Physica A 311, 97 !2002". #4$ M. A. Aguirre, N. Nerone, A. Calvo, I. Ippolito, and D.
Bideau, Phys. Rev. E 62, 738!2000".
#5$ A. Daerr and S. Douady, Nature !London" 399, 241 !1999". #6$ A. J. Forsyth, S. Hutton, M. J. Rhodes, and C. F. Osborne,
Phys. Rev. E 63, 031302!2001".
#7$ A. Samadani and A. Kudrolli, Phys. Rev. E 64, 051301 !2001".
#8$ H. M. Jaeger, C. H. Liu, and S. R. Nagel, Phys. Rev. Lett. 62, 40!1989".
#9$ L. Staron, J. P. Vilotte and F. Radjai, Phys. Rev. Lett. 89,
204302!2002".
#10$ I. S. Aranson and L. S. Tsimring, Phys. Rev. E 64, 020301!R" !2001".
#11$ S. Courrech du Pont, P. Gondret, B. Perrin, and M. Rabaud, Phys. Rev. Lett. 90, 044301!2003".
#12$ R. Albert, I. Albert, D. Hornbaker, P. Schiffer, and A.-L. Barabási, Phys. Rev. E 56, R6271!1997".
#13$ S. Dorbolo, Eur. Phys. J. E 17, 77 !2005".
#14$ S. Siavoshi, A. V. Orpe, and A. Kudrolli, Phys. Rev. E 73, 010301!R" !2006".
#15$ G. Lumay and N. Vandewalle, Phys. Rev. Lett. 95, 028002 !2005".
#16$ C. Josserand, A. Tkachenko, D. M. Mueth, and H. M. Jaeger, Phys. Rev. Lett. 85, 3632!2000".