Towards Development of Fuzzy Spatial Datacubes:
Fundamental Concepts with Example for Multidimensional Coastal
Erosion Risk Assessment and Representation
Thèse
Amaneh Jadidi Mardkheh
Doctorat en Sciences Géomatiques
Philosophiae Doctor (Ph.D.)
Québec, Canada
Résumé
Les systèmes actuels de base de données géodécisionnels (GeoBI) ne tiennent généralement pas compte de l'incertitude liée à l'imprécision et le flou des objets; ils supposent que les objets ont une sémantique, une géométrie et une temporalité bien définies et précises. Un exemple de cela est la représentation des zones à risque par des polygones avec des limites bien définies. Ces polygones sont créés en utilisant des agrégations d'un ensemble d'unités spatiales définies sur soit des intérêts des organismes responsables ou les divisions de recensement national. Malgré la variation spatio-temporelle des multiples critères impliqués dans l’analyse du risque, chaque polygone a une valeur unique de risque attribué de façon homogène sur l'étendue du territoire. En réalité, la valeur du risque change progressivement d'un polygone à l'autre. Le passage d'une zone à l'autre n'est donc pas bien représenté avec les modèles d’objets bien définis (crisp).
Cette thèse propose des concepts fondamentaux pour le développement d'une approche combinant le paradigme GeoBI et le concept flou de considérer la présence de l’incertitude spatiale dans la représentation des zones à risque. En fin de compte, nous supposons cela devrait améliorer l’analyse du risque. Pour ce faire, un cadre conceptuel est développé pour créer un model conceptuel d’une base de donnée multidimensionnelle avec une application pour l’analyse du risque d’érosion côtier. Ensuite, une approche de la représentation des risques fondée sur la logique floue est développée pour traiter l'incertitude spatiale inhérente liée à l'imprécision et le flou des objets. Pour cela, les fonctions d'appartenance floues sont définies en basant sur l’indice de vulnérabilité qui est un composant important du risque. Au lieu de déterminer les limites bien définies entre les zones à risque, l'approche proposée permet une transition en douceur d'une zone à une autre. Les valeurs d'appartenance de plusieurs indicateurs sont ensuite agrégées basées sur la formule des risques et les règles SI-ALORS de la logique floue pour représenter les zones à risque. Ensuite, les éléments clés d'un cube de données spatiales floues sont formalisés en combinant la théorie des ensembles flous et le paradigme de GeoBI. En plus, certains opérateurs d'agrégation spatiale floue sont présentés.
En résumé, la principale contribution de cette thèse se réfère de la combinaison de la théorie des ensembles flous et le paradigme de GeoBI. Cela permet l’extraction de connaissances plus compréhensibles et appropriées avec le raisonnement humain à partir de données spatiales et non-spatiales. Pour ce faire, un cadre conceptuel a été proposé sur la base de paradigme GéoBI afin de développer un cube de données spatiale floue dans le system de Spatial Online Analytical Processing (SOLAP) pour évaluer le risque de l'érosion côtière. Cela nécessite d'abord d'élaborer un cadre pour concevoir le modèle conceptuel basé sur les paramètres de risque, d'autre part, de mettre en œuvre l’objet spatial flou dans une base de données spatiales multidimensionnelle, puis l'agrégation des objets spatiaux flous pour envisager à la représentation
multi-iv
échelle des zones à risque. Pour valider l'approche proposée, elle est appliquée à la région Perce (Est du Québec, Canada) comme une étude de cas.
v
Abstract
Current Geospatial Business Intelligence (GeoBI) systems typically do not take into account the uncertainty related to vagueness and fuzziness of objects; they assume that the objects have well-defined and exact semantics, geometry, and temporality. Representation of fuzzy zones by polygons with well-defined boundaries is an example of such approximation. This thesis uses an application in Coastal Erosion Risk Analysis (CERA) to illustrate the problems. CERA polygons are created using aggregations of a set of spatial units defined by either the stakeholders’ interests or national census divisions. Despite spatiotemporal variation of the multiple criteria involved in estimating the extent of coastal erosion risk, each polygon typically has a unique value of risk attributed homogeneously across its spatial extent. In reality, risk value changes gradually within polygons and when going from one polygon to another. Therefore, the transition from one zone to another is not properly represented with crisp object models.
The main objective of the present thesis is to develop a new approach combining GeoBI paradigm and fuzzy concept to consider the presence of the spatial uncertainty in the representation of risk zones. Ultimately, we assume this should improve coastal erosion risk assessment. To do so, a comprehensive GeoBI-based conceptual framework is developed with an application for Coastal Erosion Risk Assessment (CERA). Then, a fuzzy-based risk representation approach is developed to handle the inherent spatial uncertainty related to vagueness and fuzziness of objects. Fuzzy membership functions are defined by an expert-based vulnerability index. Instead of determining well-defined boundaries between risk zones, the proposed approach permits a smooth transition from one zone to another. The membership values of multiple indicators (e.g. slop and elevation of region under study, infrastructures, houses, hydrology network and so on) are then aggregated based on risk formula and Fuzzy IF-THEN rules to represent risk zones. Also, the key elements of a fuzzy spatial datacube are formally defined by combining fuzzy set theory and GeoBI paradigm. In this regard, some operators of fuzzy spatial aggregation are also formally defined.
The main contribution of this study is combining fuzzy set theory and GeoBI. This makes spatial knowledge discovery more understandable with human reasoning and perception. Hence, an analytical conceptual framework was proposed based on GeoBI paradigm to develop a fuzzy spatial datacube within Spatial Online Analytical Processing (SOLAP) to assess coastal erosion risk. This necessitates developing a framework to design a conceptual model based on risk parameters, implementing fuzzy spatial objects in a spatial multi-dimensional database, and aggregating fuzzy spatial objects to deal with multi-scale representation of risk zones. To validate the proposed approach, it is applied to Perce region (Eastern Quebec, Canada) as a case study.
Table of Content
Résumé ... iii
Abstract ... v
Table of Content ... vii
List of Tables ... xi
List of Figures ... xiii
Acronym ... xv Acknowledgments ... xix Preface ... xxi Introduction ... 1 Chapter 1 1.1 Research Context ... 1 1.2 Problems Statement ... 5 1.3 Objective of Thesis ... 11
1.3.1 Developing a GeoBI-Based Conceptual Framework Applied to CERA ... 11
1.3.2 Developing a Novel Approach Based on Fuzzy Set Theory to Improve the Representation of Uncertainty Inherent to Risk Zones Representation ... 11
1.3.3 Formalizing Fuzzy Spatial Data Aggregation in Fuzzy Spatial Datacubes ... 12
1.4 Research Method ... 12
1.4.1 Defining Research Project ... 12
1.4.2 Proposing a Spatial Multidimensional Conceptual Model (SMCM) for Coastal Erosion Risk Assessment ... 13
1.4.3 Proposing a Novel Approach to Improve Spatial Risk Representation Based on Fuzzy Set Theory 15 1.4.4 Formalizing Fuzzy Spatial Data Aggregation in Fuzzy Spatial Datacubes ... 16
1.4.5 Validating the Research Results ... 16
1.5 Thesis Structure ... 17
Literature Review ... 19
Chapter 2 2.1 Introduction ... 19
2.2 Advance in Geospatial Technologies for Decision-Making ... 19
2.2.1 Spatial On-Line Analytical Processing (SOLAP) ... 21
2.2.2 Spatial Data Integration ... 24
viii
2.3 Risk, Risk Assessment, and Risk Representation ... 27
2.3.1 Risk Characteristics: Hazard, Elements at Risk, and Vulnerability ... 28
2.3.2 Risk Assessment Methods ... 35
2.3.3 Spatial Risk Representation ... 38
2.4 Spatial Uncertainty: Characteristics and Methods to Deal with ... 40
2.4.1 Characteristics ... 40
2.4.2 Methods to Deal with Spatial Uncertainty ... 44
(Molenaar 2000; Cheng 2002; Cheng et al. 2005; Fisher et al. 2010; Cheng et al. 2009; Dilo et al. 2007) ... 45
2.5 Spatial Data Model ... 46
2.5.1 Fuzzy Set Theory: An Approach to Deal with Spatial Uncertainty ... 48
2.5.2 Fuzzy Membership Function ... 53
2.5.3 Fuzzy Operators ... 54
2.6 Conclusion ... 55
Using Geospatial Business Intelligence Paradigm to Design a Multidimensional Conceptual Chapter 3 Model for Efficient Coastal Erosion Risk Assessment ... 57
3.1 Preface ... 57
3.2 Abstract ... 58
3.3 Introduction ... 58
3.4 Related Works ... 59
3.5 Geospatial Business Intelligence Paradigm ... 62
3.6 An Analytical Conceptual Framework for Coastal Erosion Risk Assessment... 64
3.7 Results: Development of Spatial Multidimensional Conceptual Model ... 69
3.7.1 Identify Dimension ... 69
3.7.2 Identifty Measures ... 75
3.7.3 Formal Presentation of Spatial Multidimensional Conceptual Model ... 76
3.8 Discussion ... 78
3.9 Conclusion ... 81
Spatial Representation of Coastal Risk: A Fuzzy Approach to Deal with Uncertainty ... 83
Chapter 4 4.1 Preface ... 83
4.2 Abstract ... 83
ix
4.4 Background ... 86
4.4.1 Spatial Representation of Coastal Erosion Risk ... 86
4.4.2 Uncertainty Characterization ... 88
4.5 Fuzzy Representation ... 90
4.6 Fuzzy Representation of Coastal Erosion Risk: A Conceptual Framework ... 92
4.6.1 Tessellation ... 93
4.6.2 Fuzzy Representation... 94
4.7 Results: A Case Study ... 99
4.7.1 Study Site ... 99
4.7.2 Implementing Proposed Framework on Study Site ... 101
4.7.3 Results Interpretation ... 103
4.8 Discussion and Remarks ... 103
4.9 Conclusions ... 105
Fuzzy Spatial Datacube for Multi-Scale Coastal Risk Assessment: Towards Fuzzy Spatial Chapter 5 Aggregation to Support Geospatial Decision Models ... 107
5.1 Preface of Chapter ... 107
5.2 Abstract ... 108
5.3 Introduction ... 108
5.4 Background ... 109
5.5 Handling Information Vagueness: A Fuzzy Approach ... 111
5.6 Fuzzy Spatial Datacube ... 113
5.7 Fuzzy Aggregation in Spatial Datacube: A Multi-scale Representation ... 119
5.7.1 Fuzzy Overlay ... 119
5.7.2 Fuzzy Fusion ... 125
5.7.3 Five Possible Scenarios of Aggregation in a Fuzzy Spatial Datacube ... 126
5.8 Discussion ... 127
5.9 Conclusion ... 129
Conclusion and Future Work ... 131
Chapter 6 6.1 Contributions and Discussion ... 132
6.1.1 Spatial Multidimensional Conceptual Model (SMCM) for CERA ... 132
6.1.2 Fuzzy Spatial Representation of Risk Zones ... 134
x
6.2 Research Perspectives ... 139
Reference ... 143
Appendix A: Fuzzy Membership Function ... 157
Appendix B: Mathematical Definition of Fuzzy Data Model ... 159
Appendix C: Implementation: Matlab Code ... 165
xi
List of Tables
Table 2.1: Summary of coastal vulnerability indices, their geographical application and the variables needed to
implement them (adapted from (Abuodha & Woodroffe 2006)). ... 34
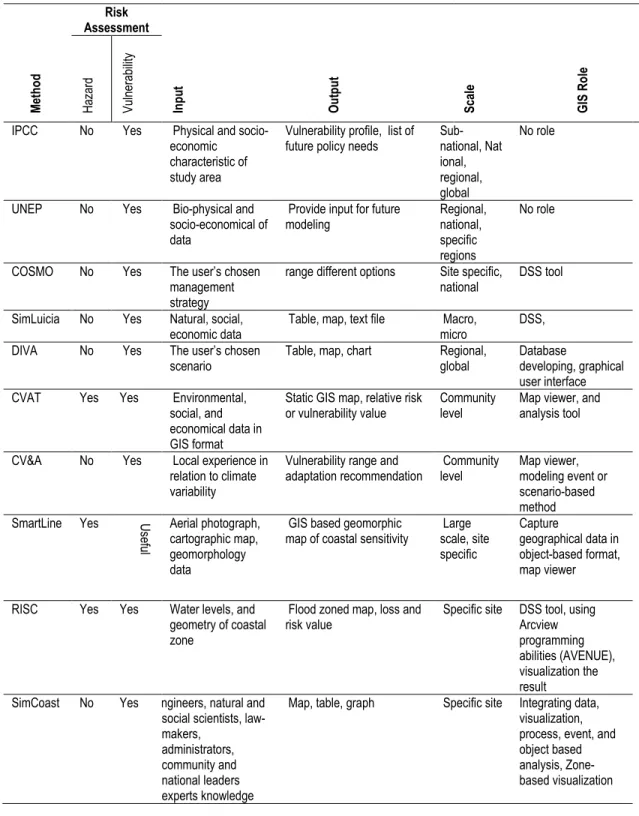
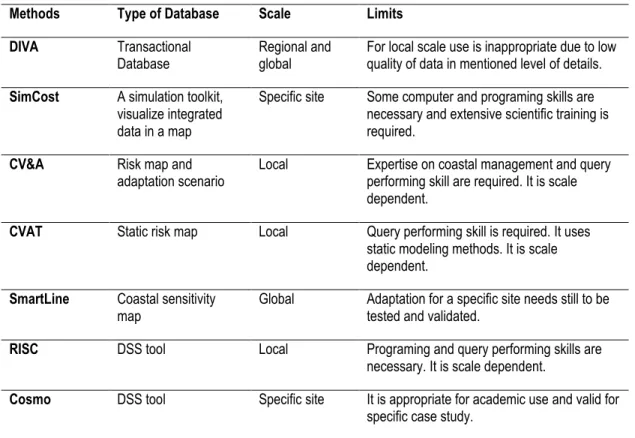
Table 2.2: Most common used methods and tools for risk assessment, especially in coastal zone management. ... 36
Table 2.3: A summary of different types of uncertainties and the respective modeling solutions... 45
Table 2.4: Mathematical definition of spatial type fuzzy operators (Dilo 2006)... 54
Table 3.1: A summary of GIS-based methods developed for coastal issues. ... 61
Table 3.2: Adapted vulnerability index for coastal erosion, their categories, and the ranking score of vulnerability indicators. ... 68
Table 3.3: “Spatial” dimensions, their members, their hierarchies, and their formal representation in UML. .... 71
Table 3.4: “Time” dimension, its members, its hierarchies and its formal representation in UML. ... 72
Table 3.5: “Thematic” dimensions, their members, their hierarchies, and their formal representation in UML. . 73
Table 3.6: The list of potential measures based on developed SMCM ... 76
Table 3.7: Some typical examples of complex queries that can be executed within developed SMCM... 79
Table 4.1: Applied algorithm for spatial fuzzy representation of coastal risk zones. ... 93
Table 4.2: An example of fuzzy IF-THEN rules ... 97
Table 4.3: Defuzzification result for final risk classification ... 99
Table 4.4: The list of data sets used for erosion risk assessment ... 101
Table 4.5: Associated weights of vulnerability indicators used in case study (adapted from (Xhardé R. 2007)) ... 102
Table 5.1: The formal definitions of fuzzy union, example of numerical values and their geometrical representations ... 121
Table 5.2: The formal definitions of fuzzy intersection, example of numerical values and their geometrical representations ... 122
Table 5.3: Fuzzy difference, Mean and Weighted Mean, their formal definitions and examples of numerical values and their geometrical representations ... 123
Table 5.4: The formal definitions of fuzzy fusion operators, example of numerical values and their geometrical representations ... 125
Table 6.1: Formal definition of fuzzy spatial datacubes’ elements ... 136
Table 6.2: The formal syntax of fuzzy aggregation operators ... 138
Table AppC.1: Draw grid ... 165
Table AppC.2: Prepare the information for each indicator (center of cells, membership value) and represent risk degree for a specific indicator ... 165
Table AppC.3: Union of multiple layers of fuzzy grids ... 166
Table AppC.4: Intersection of multiple layers of fuzzy values ... 167
Table AppC.5: Calculate Mean weighted of multiple layers of fuzzy values... 167
Table AppC.6: Mean of multiple fuzzy grids ... 167
Table AppC.7: Difference of two fuzzy grids ... 168
Table AppC.8: Fusion of two fuzzy grids toward a multi-scale representation ... 168
xiii
List of Figures
Figure 1.1: Examples of disasters caused by coastal erosion, floods and storms along the Canadian coasts. .. 2
Figure 1.2: Integrated Coastal Zone Management cycle scheme ... 3
Figure 1.3: Scheme of existing information systems (adapted from (Bédard et al. 2007)) ... 4
Figure 1.4: An example of risk zone representation ... 8
Figure 1.5: UML activity diagram of research methods. ... 13
Figure 2.1: SOLAP architecture ... 22
Figure 2.2: Key elements of SOLAP ... 22
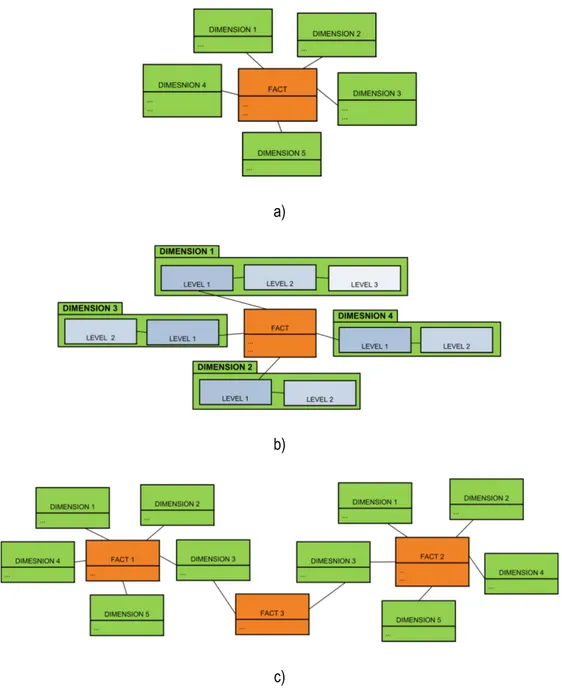
Figure 2.3: Spatial Dimension: a) non-geometric, b) geometric, and c) mixed ... 23
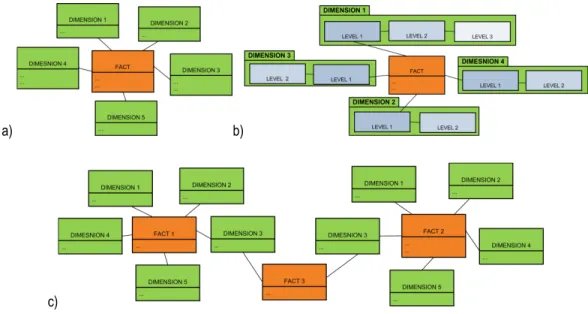
Figure 2.4: SOLAP Structure defined using three different methods: a) star schema, b) snowflake schema, and c) mixed schema ... 24
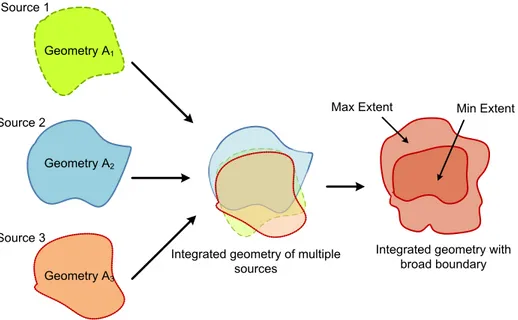
Figure 2.5: Representation of the integrated geometry of an object from different sources (adapted from (Bejaoui 2009)) ... 25
Figure 2.6: Risk scheme and the related components and their relation. ... 28
Figure 2.7: Different reference lines for coastal erosion modeling ... 32
Figure 2.8: Traditional way to represent risk zones through a risk map (adapted from (Manche 2000)) ... 39
Figure 2.9: Coastal Erosion Risk Representation along the coast (after (McHugh et al. 2006)) ... 40
Figure 2.10: Level of uncertainties (Bédard 1988) ... 43
Figure 2.11: Hierarchy of uncertainty in spatial data model (Fisher et al. 2010) ... 45
Figure 2.12: Three levels of the real world modeling (adapted from (Burrough & Frank 1996)) ... 47
Figure 2.13: A simple fuzzy object model (Zhan & Lin 2003) ... 49
Figure 2.14: Four ways to represent fuzzy objects: (a) Fuzzy areas; (b) α-cut boundaries; (c) Fuzzy-Crisp object; and (d) Fuzzy-Crisp-Fuzzy object (Cheng 2002) ... 50
Figure 2.15: Fuzzy Object definition based on Schneider’s method (Schneider 2003a) ... 51
Figure 2.16: Fuzzy point object: (a) a fuzzy point, and (b) a fuzzy multipoint (Dilo 2006) ... 52
Figure 2.17: Fuzzy Line Objects: (a) Fuzzy line and (b) Fuzzy Multiline (Dilo 2006) ... 52
Figure 2.18: Fuzzy Region Objects: Left: Fuzzy Region, Right: Fuzzy Multi-region (Dilo 2006) ... 53
Figure 2.19: A fuzzy tessellation of space based on Voronoi diagram ... 53
Figure 3.1: Datacube and its key elements i.e. Dimension, Member (e.g. Site 01, 2004, and Erosion Rate), Measures (e.g. numerical value 0.45), and Fact (e.g. the erosion rate of Site 01 in 2004 is 0.45 m/yr.). 62 Figure 3.2: Three Types of Spatial Dimensions: (a) Non-Geometric, (b) Geometric, and (c) Mixed. ... 63
Figure 3.3: SOLAP data structure: a) Star schema, b) Snowflake schema, and c) Mixed schema. ... 64
Figure 3.4: Analytical conceptual framework proposed for coastal erosion risk assessment. ... 65
Figure 3.5: Risk elements i.e. hazard, vulnerability, targets and their interactions. ... 66
Figure 3.6: Formal presentation of spatial multidimensional conceptual model for CERA ... 78
Figure 3.7: Star query model of simplified SMCM ... 78
Figure 4.1: Representation of a spatial object, its geometry and attributes through vector and raster data structures ... 87
Figure 4.2: An example of coastal erosion risk representation (McHugh et al. 2006) ... 87
Figure 4.3: A comprehensive UML class diagrams of spatial uncertainty in spatial data modeling and the methods to hand it ... 89
Figure 4.4: UML activity diagram of conceptual framework for spatial fuzzy representation of coastal risk zones ... 92
Figure 4.5: UML class diagram of vulnerability index for coastal erosion risk assessment adapted from (Jadidi et al. 2013) ... 94
Figure 4.6: A graphical Example of membership functions of some indicators and their crisp classifications: (a) “Elevation” and (b) “Erosion Rate”. ... 96
xiv
Figure 4.7: (a) Proposed approach based on fuzzy model. (b) Fuzzy representation. ... 96
Figure 4.8: UML class diagram of Fuzzy Aggregation Operators ... 98
Figure 4.9: The representation of five different indicators in each layer. (b) Fuzzy aggregation of these indicators: an overlay operation (union, intersection, mean, and mean weighted)... 98
Figure 4.10: Geographical view of Perce, Eastern Quebec, Canada ... 100
Figure 4.11: Fuzzy representation of coastal erosion risk zones on the study site. ... 102
Figure 5.1: Spatial fuzzy representation of risk: (a) Regular tessellation, (b) and (c) Fuzzy spatial risk zones representations of indicator 1 and 2, and (d) the result of fuzzy Spatial Aggregation. ... 113
Figure 5.2: A Star schema of spatial multidimensional model for CERA (Jadidi et al. 2013)... 116
Figure 5.3: Spatial Analysis Unit in presented model for CERA (Jadidi et al. 2013). ... 117
Figure AppD.1: The workflow of using LP360 to prepare LiDAR data for erosion analysis ... 171
Figure AppD.2: The workflow of DSAS... 175
Acronym
BI Business Intelligence CER Coastal Erosion Risk
CERA Coastal Erosion Risk Assessment CVI Coastal Vulnerability Index CSoVI Coastal Social Vulnerability Score DBMS Database Management Systems DSS Decision Support Systems DTM Digital Terrain Models DEM Digital Elevation Modeling ETL Extract-Transfer-Load
GeoBI Geospatial Business Intelligence GIS Geographical Information Systems HWL High Water Line
ICZM Integrated Coastal Zone Management IC Integrity Constraints
MHWL Mean High Water Line MSL Mean Sea Level QMM Qualified Min-Max
OLAP Online Analytical Processing SDSS Spatial Decision Support Systems SOLAP Spatial Online Analytical Processing SoVI Social Vulnerability Index
SI Sensitivity Index
SCI Sustainable Capacity Index SLR Sea Level Rise
SMCM Spatial Multidimensional Conceptual Model SQL Structure Query Language
xvii
Dedicated to those to whom I always belong
for their love, endless support, and
encouragement
To:
my best friend and husband: Kyarash,
my sweetheart daughter: Amytis,
my beloved parents: Masi and Reza,
my sisters: Malahat, Matine, Mahsa, Rezvan,
and, finally, to the World that respects
xix
Acknowledgments
I must begin this section by thanking all of the people whom I have been blessed to work with over the past five years!
To my supervisor, Dr. Mir Abolfazl Mostafavi, I am so happy we started this thesis with lots of doubts and have finished it with strong confidence and assurance. However, the degree of uncertainty exists in everywhere and cannot be completely avoided. I would like to thank you for the five years of key advices kindness, and support you provided despite your tight schedule. I appreciated so much to work with you and having such experience.
Dr. Yvan Bédard, having you as co-supervisor was the best thing that happened during my thesis. Not only I learned tremendous amounts about geospatial domain but also you left me with the legacy of never giving up. This is a lesson of life that will always be with me. Your office was always opened for all my crazy questions and surprises. You have my deepest gratitude, Yvan. Someday, I hope to become someone that you are proud of having had as a student. Thank you!
I would like to thank Dr. Bernard Long his important role in building this Ph.D. project. I am sure that without his thoughtful advice at the beginning, we could not have realized the complexity of the application under study. A special thank goes to also to Dr. Eliane Proppek for her advices in risk analysis. Great thanks also belong to Dr. Stephan Roche, for accepting to be “pre-Lecture” of this thesis and later in Jury and to Dr. Marc Cocard for his support as graduate program director and president of jury.
Thanking Ms. Carmen Couture is really difficult. She served as more than an Educational Agent on my dossier. She became my second family in Quebec. I did not feel lonely when she was around at tough times. Carmen, you have earned the deepest gratitude of my heart. You changed my life when I was nearly lost in this white Snow-Land.
Once I asked my father what treasure I would inherit from him. He answered me: “You”! For a long time, I was baffled by his unexpected response. Now, I am able to see that indeed the richest inheritance from my parents is to be ME! Mom and Dad, thank you for your sacrifices and unending support. You are always with me, even when we are separated by thousands of kilometers. Your hearts are always with me and mine is yours! Please accept this manuscript as a token of my appreciation of all your sacrifices.
xx
My little sisters, Malahat, Matine, Mahsa, Rezvan: I know I was not there for you every time you needed me and I could not fulfill all of my sisterly duties. However, you dwell in my heart forever and nothing is more important than you. Thank you for your years of patience and encouragement.
To you my best friend and husband, Kyarash: since our eyes met in that beautiful Alpine valley of Grenoble, you assured me of your everlasting support, love, honesty, and confidence. You taught me how much the real life is fuzzy and how should we be prepared for an optimum solution. We had many tough periods all these years, but your positive belief in my aptitude always drives me to improve. Saying only thank you is so cliché. I prefer to say that--without you--it would have been impossible to make my dreams come true! I will do my best to always be the ONE you’ve searched for.
Now, some words for my sweetie, Amytis: I know that I sacrificed precious time with you to work on this thesis and I keenly felt your absence. I hope that someday all the hard work I put into it and hereafter in my career makes you proud of your Mommy. I will be so relieved when that day comes.
To my dearest friends: Atiyeh, Jessie and Alborz: Merely saying only “thank you” is inadequate for all you’ve done for me over these five years. Your encouragement, your presence, and your support have been remarkable. Also, I would like to thank all my colleagues at Center for Research in Geomatics: Eve, Hedia, Mathieu, Abbas, Marc, Elodie, Vincent, Guillaume, Tania, Eric, Sonia, and Eveline. Well-deserved gratitude goes to Ms. Danielle Goulet for her incredible work to streamline financial procedure. In closing, I would like to thank all the people in my life who have taught me new things. Each of those lessons has contributed to the achievement of this lifelong goal.
xxi
Preface
The results of this research project have been published and communicated in three international scientific journals and five international and national conferences on Geospatial Information Science. These papers have been written by the author of this thesis under supervision of Dr. Mostafavi and Dr. Bedard and wit the collaboration of Dr. Long, Dr. Shahriari and Ms. Grenier.
Journal Papers:
Jadidi A., Bédard Y., Mostafavi M.A., Fuzzy Spatial Datacube for Multi-scale Coastal Risk Assessment: Towards Fuzzy Spatial Aggregation to Support Geospatial Decision Models, International Journal of Geographical Information Science, Submitted.
Jadidi A., Mostafavi M.A., Bédard Y., Shahriari K., Spatial Representation of Coastal Risk: A Fuzzy Approach to Deal with Uncertainty, ISPRS International; Journal of Geo-Information, In process.
Jadidi A., Mostafavi M.A., Bédard Y., Long B., Grenier E., Using Geospatial Business Intelligence Paradigm to Design a Multidimensional Conceptual Model for Efficient Coastal Erosion Risk Assessment, International Journal of Coastal Conservation, 17 (3), 527-543, 2013.
Conference Papers and Communications:
Jadidi A., Mostafavi M.A., Bédard Y., Fuzzy-based Spatial Knowledge Discovery in Service of Efficient Coastal Erosion Risk Assessment, Spatial Knowledge Information Conference, Banff, 7-9 Feb 2014.
Jadidi A., Mostafavi M.A., Bédard Y., Dealing with Uncertainty in Coastal Risk Assessment: Fuzzy Representation of Coastal Risk Zones, GSDI 13 Geospatial Conference, Quebec, 14-17 May 2012
Jadidi A., Mostafavi M.A., Bédard Y., Long B., Toward an Integrated Spatial Decision Support System to Improve Coastal Erosion Risk Assessment: Modeling and Representation of Risk Zones, FIG Working Week 2012, Rome, Italy, 6-10 May 2012
Jadidi A., Mostafavi M.A., Bédard Y., Long B., Développement d'un outil géo-décisionnel pour améliorer l'évaluation du risque d'érosion côtière, Géomatique 2011, 12-13 oct. Montréal
Jadidi A., Mostafavi M.A., Long B., Where are we in Coastal Erosion Risk Assessment Using GIS?, Géomatique 2009, 22-23 Oct., Montréal.
Introduction
Chapter 1
1.1 Research Context
Recent advances of Geospatial Business Intelligence (GeoBI) technologies, in handling large amounts of data led to intense growth in the adoption of such technologies for decision-making and integrated risk assessment processes. This growth has been powered by the decreasing cost of acquiring and storing large amount of data coming from multiple sources. Reducing the gap between data acquisition and decision-making is the main objective of business intelligence technologies (Chaudhuri et al. 2011). However, spatial uncertainty, which is an inherent characteristic of spatial data limits efficient decision-making process using GeoBI technologies (Kentel & Aral 2007; Bejaoui 2009). Spatial uncertainty can be propagated during integration and aggregation processes and hence in the decision-making process. Ignoring spatial uncertainty may result in unrealistic or misleading conclusions and decisions that yield undesired or even catastrophic consequences. For instance, confronting a disaster situation involves always with analyzing, and interpreting large amounts of spatiotemporal data and information from multiple sources with different types and levels of detail and uncertainty in a minimum time period. Therefore, coping with any undesired situation in our lives due to a natural or human-induced disaster requires an integrated analytical system such as GeoBI technologies. Hence, developing any system for such situations necessitates understanding and characterizing of phenomenon and related parameters and then conceptualizing the system. In this regard, an undesirable natural situation is described with some issues and limits to adapting GeoBI paradigms and handling spatial uncertainty are emphasized.
“Making the simple complicated is commonplace; making the complicated simple, awesomely simple, that's creativity.” Charles Mingus
2
The earth with its natural climate variability is always coping with hazards caused by natural phenomena. However, not every natural hazard leads to a disaster. Whether natural hazards cause a disaster or not depends on their magnitude and the socio-economic and environmental vulnerabilities of the region being affected (ISDR 2004). Coastal regions are good examples in which natural hazards severely affect human-life and the present and future socio-economic activities of the people living along the coast (see Figure 1.1). Coastal regions are usually densely populated. It is claimed that 21% of the world’s population install their accommodation, assets, and socio-economic activities less than 30 Km away from of coastline (IPCC 2007). Coastal communities are therefore increasingly concerned with the risk associated with coastal hazard, especially coastal erosion, given the fact that 70% of coastal regions around the world are subject to severe erosion (IPCC 2007). Canada specifically is a remarkable region with almost 240 000 Km of coastline-more than any other country in the world (Shaw et al. 1998). 7 000 Km of Canadian coasts are highly sensitive to climate change and Sea Level Rise (SLR) (Shaw et al. 1998; Stanton et al. 2010). Moreover, most of Canada’s coastal zones are home to a concentrated population, economic centers, and valuable ecosystems which are excessively vulnerable to coastal erosion (Stanton et al. 2010). Furthermore, 38.3% of Canadians (seven millions) live within 20 km of a coast and their living expenses depend directly on the marine resources and tourism industry (Stanton et al. 2010). Considering that, an accurate modeling and presentation of risk associated to coastal erosion in the sensitive regions are crucial from socio-economic and environmental points of view.The misunderstanding of the risk may cause illusory protections or restrictions which may lead to natural, social, and economic disasters or unnecessary constraints on the development of regions. A sustainable development plan is consequently designed for optimal use of available resources while protecting people and socio-economic and environmental values of these regions.
3 A sustainable development plan for coastal regions requires a significant understanding of the phenomena spatiotemporally. To do so, an integrated information system is required to perform necessary computation and representation spatiotemporally to convince human perception about the necessity of this plan (Goodchild & Glennon 2008). Several plans are elaborated on community, municipality, regional, national, and global scales to protect people and their assets from coastal risk. One of the most popular plans is Integrated Coastal Zone Management (ICZM) that emphasizes the sensitivity of coastal zones and their management (Varghese et al. 2008).
ICZM comprises information collection, planning, decision-making, management, and monitoring (Cheng et al. 2009). The schematic framework of ICZM is shown in Figure 1.2. Risk assessment is then a predominant sub-stage of any sustainable development plan and decision-making processes by providing a comprehensible estimation of damage and loss in terms of human, socio-economic, and environmental aspects. Risk assessment and representation provide necessary knowledge and essential guidelines for risk management and policy-making purposes. Coastal Erosion Risk Assessment (CERA) is thus defined as developing methods to determine the nature and extent of risk. To do so, analyzing the probability of hazard (erosion) and evaluating the existing vulnerable conditions of elements at risk, such as people, infrastructures, houses, etc. in given time periods is required within an integrated information system (Cutter et al. 2000; Cutter 2002; Karvetski et al. 2011; Boruff et al. 2005; Alexander 2000).
4
Coastal regions are managed by multiple stakeholders under the authority of different organizations in local, provincial and federal governments. These organizations are the main actors to make decisions for response option practices (i.e. protection, adaptation, and retreat) (Linham & Nicholls 2012). The main challenge arises when each organization prefers to take its own criteria and its own sources of data to assess the risk. The data and the criteria are often in conflict and it becomes difficult to provide a coherent vision of the overall risk, as well as support an efficient decision-making process. In other words, multiple interests are involved to evaluate risk and to make appropriate decisions. In this context, CERA is characterized as a complex, multi-criteria, spatiotemporal, and multi-scale process (Cutter et al. 2008; Cutter et al. 2003; Boruff et al. 2005; Blaikie et al. 2004). Therefore, assessing risk requires dealing with multidisciplinary studies, with multiple interests, and handling large amounts of data and information from multiple sources with different types, multiple scales and multi-epochs. On the other hand, the main challenge in decision-making processes especially in the case of disaster management and risk assessment is to shorten the time lag between data acquisition and decision-making. This requires a system to perform analytical analysis, fast-synthesis, complex queries, aggregated information, spatial comparisons, cross-tabulated, and interactive knowledge discovery.
From a technological point of view, an information system is required to manage large amounts of heterogeneous data from multiple sources, with different levels of details, various reference systems and different types (i.e. spatial, non-spatial, and temporal). This system has to handle analytically different types of data in multiple levels of details and perform complex queries within an interactive knowledge discovery. The system should also allow on-the-fly aggregation, analysis, and synthesis, then, report the resulting information to the users and decision-makers. Considering the technical specification for such a situation, a revision of the existing technological advances is necessary (see Figure 1.3).
5 Database Management Systems (DBMS) are primary technologies hosting non-spatial data that does not support aggregation operations (Longley et al. 2005). On the other hand, Decision Support Systems (DSS) are mainly designed to deal with decision-making processes by handling non-spatial data at different levels of details (Van Kouwen et al. 2007; Roca et al. 2008). DSS also play also a major role in anticipating the outcomes of alternate management plans and fulfilling what-if analyses. DSS help the mangers and authorities to visualize long-term consequences of their decisions and evaluate possible solutions for the issues under study (Varghese et al. 2008). As mentioned, neither DBMS nor DSS handle spatial data. Indeed, 80% of data have a spatial component (Franklin et al. 1992). Geographical Information Systems (GIS) provide a wide range of capabilities to store, manipulate, classify, integrate, process, and represent spatiotemporal data (Longley et al. 2005). However, GIS marginally support transactional systems for scales, epochs, and multi-themes analysis. Moreover, on-the-fly multidimensional analysis can hardly be performed by today’s GIS. Current advances in Decision Support Systems (DSS) and their integration with GIS provide interesting solutions for efficient integrated processes. Of particular interest are those advances coming from the field of Business Intelligence (BI), where a category of Spatial Decision Support Systems (SDSS) called Spatial Online Analytical Processing SOLAP technology (SOLAP) has been developed (Bédard et al. 1997). SOLAP is designed specifically to overcome the previously listed limitations of GIS and to allow rapid ad hoc multi-scale, multi-epoch, and multi-theme information retrieval and to perform complex querying by simply clicking on the desired level of information detail for given regions, epochs, and themes.
1.2 Problems Statement
Indeed, in adapting a GeoBI system for CERA, some issues and limits are important to be carried out which are characterized in our research projects as follows:
Requirement for an Integrated Framework
Coastal Erosion Risk has an inherently complex, multidimensional, and continuous nature which depends on several criteria, time periods, and scales of information in the presence of uncertainty at different levels. Risk assessment is not therefore as straightforward as one might imagine. Numerous frameworks and methods have already been developed for coastal risk assessment (IPCC 2007; ISDR & Nations 2004; Klein & Nicholls 1999; UNFCCC 1999; NOAA (National Oceanic & Atmospheric Administration) 2003; Mai & Liebermann 2002; Hinkel 2005; McFadden et al. 2007). These approaches are mostly scale dependent for one spatial scale and are unsuitable to be used for multi-scale analysis purposes. The main challenges in the stated methods are:
6
Performing fast synthesis, fast summarizing, easy comparisons and multi-level querying (on-the-fly analysis) in emergency cases for efficient decision-making processes.
Integration and aggregation of large amounts of data compel many of the stated methods and frameworks in any ICZM plans to focus only on single-oriented or few components involved in risk assessment, such as risk for people or infrastructure- not an integrated approach. Hence, a comprehensive tool for multi-scale representation of risk- not only in various spatial and temporal resolutions, but also in different levels of abstraction in thematic characteristics of risk for any aggregation or detailed information levels- is crucial for sustainable development of coastal regions.
Need to Deal with Large Amounts of Spatiotemporal Data in Multiple Scales
The key challenge in CERA is integrating and analyzing conflicting data in various time periods and spatial scales through dissimilar environmental, social, and economic criteria. Each organization carries out its own data acquisition based on its needs and standards. The resulting data are, therefore, generally heterogeneous and hence difficult to integrate, analyze and share. Available data are generally dissimilar in type, having been acquired based on different standards in different spatial and temporal scales. For instance, socio-economic data are available at the census level of detail whereas environmental data are at coastline-segment scale (Hegde & Reju 2007). In addition, the environmental data include both long-term (such as Sea Level Rise) as well as daily tide average while social data represent a snapshot of one census year (Boruff et al. 2005). Adapting geospatial BI paradigms for risk assessment is not straightforward. This includes characterizing all related risk components (i.e. hazard, vulnerability, and elements at risk) and translating them into multiple hierarchical dimensions.
Need to Deal with Expert-Based Knowledge and Existing Uncertainty
Available data and information for CERA are mainly expert-based and are classified with respect to decision-makers or stakeholders’ interests. This can bring the problem of semantics of interested criteria or object for their classification. In other words, risk, by itself, is a definition which is given to demonstrate the impact of a physical or human-induced phenomenon causing disasters or harming human-life. Spatial modeling and representing risk through risk zones (as crisp object) bring up the issue of dealing with the fiat nature of risk which is based on some interested criteria introduced by stakeholders and experts. In this regard, the issue of information vagueness appears in definition of risk zones as well as geometries. Therefore, representing risk zones is a challenge due to the complex nature of risk and the existence of data uncertainty and information vagueness. This complicates the adequate communication of risk values and their consequences to
7 stakeholders and authorities. The proposed information system should also be able to manage the existence of uncertainty and vagueness at different data levels.
Extending the concept of spatial object modeling from crisp to broad boundaries, two types of spatial objects are distinguished that are fiat (poorly-defined) and bona fide or crisp (well-defined) objects (Fisher et al. 2010; Smith & Varzi 2000). A fiat object has a broad boundary that cannot be observed and measured or is not known precisely (Fisher et al. 2010; Smith & Varzi 2000). For example, the spatial extent of a forest stand cannot be determined without any uncertainty. Bona fide object represent an object with a sharp-line boundary (Fisher et al. 2010; Smith & Varzi 2000). This is typically the case for the objects that are built by humans. Examples are buildings and roads. However, since every map and database is a model or representation of reality made for a specific purpose, they all carry some level of uncertainty (Bédard 1988). The difference between fiat and bona fide objects is more a matter of degree than a matter of absolute difference depending on the applications. Nevertheless, for the purpose of this thesis and in accordance with day-to-day practice, it is useful to note this difference.
Requirement for Fuzzy Representation of Risk Zones
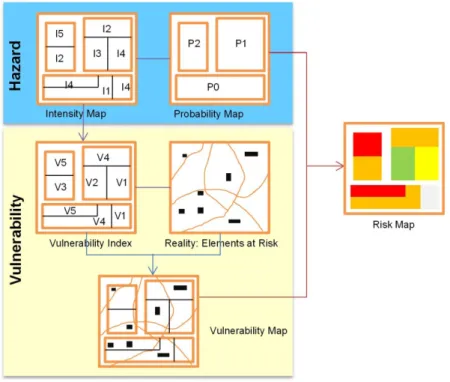
Traditionally, coastal risk zones are represented by polygons that result from the aggregation of a series of spatial units defined with respect to stakeholders/authorities’ interests or are based on national census parcels (Hegde & Reju 2007; Boruff et al. 2005; McFadden et al. 2007; Vafeidis et al. 2008). The spatial units may have different forms and sizes and may be distributed regularly or irregularly. The area and shape of these units may vary from a specific infrastructure to a very small cadastral parcel, municipality, state, or even a country. For each unit, a vulnerability index and a degree of risk is assigned (ISDR & Nations 2004; Abuodha & Woodroffe 2006; McFadden et al. 2007; Vafeidis et al. 2008; Füssel & Klein 2006). Polygons are separated by well-defined boundaries while the degree of risk is attributed homogenously within each polygon considering multiple criteria (Cheng et al. 2009; Bruce 2004; Burrough & Frank 1996). In fact, risk zones can be obtained from an overlay of vulnerability indicators’ maps derived from elements at risk and hazard maps at different time periods. A typical risk representation is illustrated in Figure 1.4.
Therefore, risk zones representation is performed by simply overlaying several data layers and superimposing them into one layer yielding a risk map. This overlay operator is well implemented in existing GIS tools. However, the problem arises when different types of uncertain and vague information with different levels of details in different time periods should be overlaid and aggregated. In this case, any simple query becomes
8
complex and its execution is a time-consuming task; whereas in risk assessment, fast synthesis and rapid analysis are essential.
Figure 1.4: An example of risk zone representation
Furthermore, the way that the geometry of polygons is defined differs among experts depending on their interests (Hegde & Reju 2007; McFadden et al. 2007; Cutter et al. 2003). It should also be noted that risk has multi-scale characteristics, due to inherent needs and interests of different participants on different organizational levels and their interests in one object or another (e.g. ports, buildings, census segment, city, state, or country). In this regard, risk zones are complex objects with uncertain boundaries and vague definitions in multi-scale space (Cheng et al. 2009; Molenaar 2000; Molenaar & Cheng 2000). The transition from one zone to another with a well-defined boundary provides therefore misleading insights of the degree of risk for decision-makers of any strategic actions.
Considering the fact that coastal erosion risk is a function of several continuous parameters (such as erosion rate, land cover change, and climate change), the transition from one spatial unit to another can loosely be explained with a crisp line and risk value changes gradually from a place to another (Cheng et al. 2009). For instance in Figure 1.4, the transition from red to yellow zone is sharp whereas in reality, risk level changes smoothly and continuously. This problem led us to explore and develop a more flexible method to represent continuous risk values.
Uncertainties exist and propagate from the collection, analysis, and representation of spatial data to interpretation and decision-making. This often appears in modeling environmental systems. By “uncertainty” we generally mean the vagueness in boundary zones, ambiguities in linguistic terms, discord in semantics of a class or object, fuzziness in process interpretation or existence degree of a spatial object, or a mix of them (Fisher et al. 2010). Semantics uncertainty comes from the fact that a person wants to describe a given phenomenon with different vocabularies or the same words in different ways (Fisher 2008). Vagueness, fuzziness, and ambiguity (discord, and non-specificity) are the principal factors in semantics uncertainty
9 (Fisher et al. 2010). Moreover, uncertainty increases from a natural sub-system to a human sub-system i.e. the key components of risk, with the large amounts of uncertainties concerning their interaction (Forth report of (IPCC 2007). This necessitates evaluating any imperfection or uncertainty in any level of risk assessment procedure from data and information to modeling techniques.
Indeed, handling and modeling uncertainties have recently become a major concern in risk assessment studies (Darbra et al. 2008; Kentel & Aral 2007; Skanata & Byrd 2007; Szemesova & Gera 2010; Xie et al. 2011). Probabilistic models based on Probability Theory and possibilistics models based on Possibilitics Theory have commonly been used to accommodate uncertainty associated with risk modeling and representation (Darbra et al. 2008; Bruce 2004; Molenaar & Cheng 2000; Choa et al. 2003; Aerts et al. 2003; Fisher et al. 2010; Cheng et al. 2005). Probabilistic models basically use ellipsoid error to deal with positional and measurement uncertainties (Pfoser & Tryfona 2001; Aerts et al. 2003). Exact, rough and fuzzy models are the example of possibilistics models. Exact models are the extension of the crisp spatial models such as Egg-Yolk (Randell et al. 1992; Cohn et al. 1997; Clementini & DiFelice 1997; Erwig & Schneider 1997; Cohn & Hazarika 2001; Cohn & Gotts 1996). Rough models are based on the Rough Set Theory to represent a spatial object as a pair of its maximum and minimum approximations (Worboys 1998; Fisher et al. 2010; Bejaoui et al. 2008). Fuzzy models are based on Fuzzy Set Theory that deal with inherent fuzziness and uncertainty related to modeling an object or identifying criteria through a membership function (Zadeh 1965; Robinson 2003; Fisher et al. 2010; Dilo et al. 2007; Pauly & Schneider 2010). Exact and rough models have commonly been used by scientists and practitioners due to their simplicity and straightforwardness in implementation (Pauly & Schneider 2010; Kanjilal et al. 2010). However, these models have their inherent limitations to represent continuous phenomenon. An example in this regard is coastal erosion. A detailed literature review reveals that the exact and rough models are not the ultimate solution to overcome the inherent uncertainty due to vague and fuzzy nature of spatial objects. This is more significant when the continuity of an object needs to be taken into account. Contrary to exact and rough models, fuzzy models promote stirring results. However, handling uncertainty using the stated methods needs more investigation to identify a way to adapt such methods. Lack of a Formal Definition of Fuzzy Spatial Datacube
From the technological point of view, existing SDSS systems do not provide built-in capabilities to deal with semantic uncertainty. The need to handle imperfect data, either uncertain or imprecise, and run flexible queries on a spatial datacube is a challenge in performing CERA though current SDSS. SDSS such as SOLAP use multiple indicators that are translated into datacube dimensions to perform risk assessment. The choice of indicators is typically based on participants’ interests while the level of details, classification and semantics of
10
these indicators depend on available data from different sources as well. Semantics of objects, geometry, and temporality are often assumed to be exact or good enough in these spatial datacubes for the decision-makers’ requirements. As a result, they depict major weaknesses when it comes to accurate analysis of phenomena (such as coastal risk) in the presence of uncertain and vague data and information. Hence, there is a strong willingness to propose a comprehensive solution for this problem. A promising approach that has been explored for almost two decades is fuzzy logic (Schneider 2010).
Several works have already been initiated to deal with the problem of uncertainty and vagueness issued from the definition of objects in On-line Analytical Processing (OLAP) and Spatial OLAP (SOLAP) systems (González et al. 2009; Laurent 2010; Péres et al. 2007; Molina et al. 2006; English et al. 2004; Pedersen & Jensen 2001; Kaya & Alhajj 2006). Nevertheless, the idea of a fuzzy spatial data model is still a young topic in the geospatial community. In addition, several efforts have already been made to embed fuzzy objects in SOLAP through extended crisp models i.e. exact and rough models (Bejaoui 2009; Siqueira & Ciferri 2012). In recent works, (Gervais et al. 2009; Levesque et al. 2007; Edoh-alove et al. 2013) propose two risk-aware approaches to face spatial fuzziness and uncertainties in which the user is informed about the existence of low-quality data. However, none of the cited works use Fuzzy Set Theory explicitly to characterize spatial uncertainty and to integrate it into SOLAP in a systemic way. Embedding spatial uncertainty in the multidimensional model requires formally redefining the principal elements of the spatial datacube.
Requirement for Multi-Scale Fuzzy Representation of Risk Zones
Risk is analyzed in a hierarchical manner due to the needs and interests of different participants at different levels of government (local, regional, national) for risk assessment and management. However, to our knowledge, there are no methods to aggregate and represent spatial measures resulting from uncertain data and vague information into multiple hierarchical dimensions. Thus, a multi-scale fuzzy representation of risk is necessary based on fuzzy objects.
By “aggregation” in the Geospatial BI community, we mean the grouping of data geometrically, thematically, or semantically to a coarser level of detail (Pedersen et al. 2001; Gomez et al. 2009). In other words, aggregation is a summarization process of fuzzy or crisp values or geometries in a datacube. However, the methods and procedures depend directly on the data model used (Péres et al. 2007; Laurent 2010; Gomez et al. 2009; Pedersen et al. 2001). Using fuzzy concept to define appropriate operators for data aggregation in a datacube has been initiated by Laurent (2010) and Molina et al. (2006). A series of operators (such as roll-up, drill-down, slice, dice, and pivot) have also been defined for fuzzy datacubes in Molina et al. (2006) and
11 Martin-bautista et al. (2013) using both quantitative and qualitative data. This permits a qualitative representation of results on charts and tables. However, the geometric aggregation of fuzzy objects requires redefining fuzzy operators (such as overlay and fusion) for fuzzy objects. More investigation is required in this regard to design a fuzzy spatial datacube.
1.3 Objective of Thesis
In order to provide an adequate solution for the stated problems, the general objective of this thesis consists of developing an approach combining GeoBI paradigm and fuzzy concept to consider the presence of the spatial uncertainty in the representation of risk zones. Ultimately, we assume this should improve coastal erosion risk assessment. To achieve the overall objective of this research project, three specific objectives are elaborated as follows:
1.3.1 Developing a GeoBI-Based Conceptual Framework Applied to CERA
The first specific objective focuses mainly on developing an analytical approach thanks to GeoBI paradigms to design a fuzzy Spatial Multidimensional Conceptual Model (SMCM) for efficient assessment of coastal erosion risk. As well, dealing with information vagueness coming from data modeling is carried out. In this regard, identifying key elements of a fuzzy spatial datacube are required. Conceptualizing such model is the main goal in this step with a reference to the main components of coastal erosion risk (hazard, vulnerability and elements at risk).
1.3.2 Developing a Novel Approach Based on Fuzzy Set Theory to Improve the
Representation of Uncertainty Inherent to Risk Zones Representation
Based on the stated arguments, the main concern in this research project is the indeterminate nature of coastal erosion risk and associated uncertainty, characterized as information vagueness. More precisely, one of the focuses of this research project is on the inherent uncertainty and vagueness mostly arisen from data modeling. In CERA, the first step is the tessellation of the coastal region to determine analysis units. Traditionally, this step is an expert-knowledge based (qualitative) procedure. The tessellation strongly depends on stakeholders/authorities’ interests. That introduces the first level of uncertainty. A vulnerability index based on expert-knowledge rules is then assigned in the second step to each unit introducing additional uncertainty. Indeed, the associated uncertainties of a vulnerability index stored as attributes of each unit leads to geometric vagueness. The aggregation of spatial units represents risk zones in the third step. The associated uncertainties are propagated through the first, second, and third steps in CERA and finally appear in the
12
geometry of risk zones. On the other hand as stated above, the continuous characteristics of risk indicate that the risk zones are linked to each other with gradual transition zones (Fisher et al. 2007; Cheng et al. 2009). The second specific objective focuses on characterizing the nature and level of spatial uncertainty appeared as information vagueness and handling it through coastal risk assessment process using Fuzzy Set Theory. A systematic approach to link key elements of CERA and fuzzy membership function concept needs to be taken into account. Extracting IF-THEN rules from the traditional classification of experts and practitioners to elaborate vulnerability index and elaborating risk formula is a major challenge in this step. Once, the IF-THEN rules and risk formula are elaborated, the multiple layers of fuzzy objects are aggregated to represent risk zones.
1.3.3 Formalizing Fuzzy Spatial Data Aggregation in Fuzzy Spatial Datacubes
The third specific objective focuses formalizing a fuzzy-based approach spatial data aggregation to deal with information vagueness in spatial datacubes. The developed approach is tested within an application of multi-scale risk assessment.1.4 Research Method
To achieve the stated objectives and to obtain the expected results, the following steps are taken during the course of this thesis. The UML activity diagram describing the details of major phases, sub-phases, and their connection is illustrated in Figure 1.5.
1.4.1 Defining Research Project
A deep investigation of relevant works is begun by scrutinizing the fundamental concepts for a better understanding of the research context and elaborating the main objectives of this research project. The main concepts to be covered are:
1) Geospatial Business Intelligence paradigm;
2) Characteristics of risk and its components and assessment; 3) Risk assessment under uncertainty;
4) Spatial data modeling and representation of an object with vague shape and formal definition of fuzzy object, and finally
13
Figure 1.5:UML activity diagram of research methods.
1.4.2 Proposing a Spatial Multidimensional Conceptual Model (SMCM) for
Coastal Erosion Risk Assessment
An analytical conceptual framework based on a geospatial BI paradigm is proposed in this phase to elaborate a Spatial Multidimensional Conceptual Model (SMCM) to perform CERA. The model is an example for a comprehensive solution integrating multiple environmental, social, and economic criteria as well as their interactions at various spatial scales and epochs on different themes. It also takes into account multiple elements at risk such as people, infrastructure, and built environments as different dimensions of the analysis. Bear in mind that the main steps followed are listed hereafter and detailed in the upcoming sub-sections:
1) Performing need analysis based on application under study to identify the stakeholders and their needs. This step is done based on literature and consulting the expert of applications such as
14
(McHugh et al. 2006; Bernatchez, Fraser, Friesnger, et al. 2008; Bernatchez, Fraser & Lefaivre 2008; Xhardé R. 2007);
2) Performing data inventory based on application under study to have an idea about data availability, data types, level of details, metadata, etc. The main sources of data in this step were ETE-INRS, Quebec Province Transport, GeoBase, and erosion projects done by the Industrial Chair of Geospatial Database for Decision Support at Université Laval;
3) Identifying coastal erosion risk key components: a. Identifying hazard:
i. Choosing a method to determine the border of coast and land; ii. Calculating erosion rates from coastline changes for different periods. b. Identifying elements at risk;
c. Elaborating an integrated vulnerability index by considering both environmental and socio-economics features;
d. Elaborating risk equations;
4) Translating the key components of coastal erosion risk into key elements of a spatial datacube; a. Determining datacube dimensions (spatial, temporal, and thematic) derived from key
components of coastal erosion risk;
b. Determining datacube measures (spatial and non-spatial) based on risk equations;
c. Choosing the schema of data structure in spatial datacube for CERA, for instance star schema;
15
1.4.3 Proposing a Novel Approach to Improve Spatial Risk Representation Based
on Fuzzy Set Theory
A fuzzy-based approach is developed in this phase to deal with the uncertainty related to the object and its geometry, or its vagueness. A conceptual framework is also proposed to deal with the problem of spatial uncertainty of risk zones using membership functions. Instead of determining the crisp and sharp boundaries between risk zones, the proposed approach permits a smooth transition from one zone to another. Membership functions are derived from the knowledge of experts. This phase is divided into two main steps, where results from the previous phase can be reused to achieve the determined objectives:
1) Tessellation of the region under study:
a. Identifying hazard (results reused from the previous phase);
b. Elaborating vulnerability index (results reused from the previous phase);
c. Classifying based on erosion rate into five categories (very high, high, medium, low and very low rate of erosion) ;
d. Loading data related to vulnerability index;
e. Detecting hotspots of vulnerable indicators and erosion rates; f. Defining the size and shape of grid i.e. regular or irregular; g. Drawing the grid on the region under study.
2) Fuzzy representation:
a. Performing fuzzification;
i. Defining fuzzy membership functions based on the vulnerability index for each layer of indicator;
ii. Assigning membership value to each cell;
iii. Calculating the risk value in each cell using respective membership value; iv. Representing the risk value for each indicator.
16
b. Performing fuzzy aggregation operators; i. Elaborating risk Formula; ii. Extracting IF-THEN rules;
iii. Aggregating multiple indicators based on elaborated risk formula and rules using the aggregation operators (union, intersection, difference, etc.);
iv. Representing the risk zones.
1.4.4 Formalizing Fuzzy Spatial Data Aggregation in Fuzzy Spatial Datacubes
In the fourth phase, the fuzzy-based approach developed in the previous phase is embedded into a spatial datacube through redefining the spatial datacube elements (dimensions, members, hierarchy, and facts) and required fuzzy aggregation operators (union, intersection, difference, overlay, and fusion). It is then applied to a spatial datacube with a reference to the CERA multidimensional model. The appropriate methods are proposed to aggregate and represent risks’ measures into multiple hierarchical dimensions spatially or numerically. Possible fuzzy spatial aggregation scenarios within a spatial datacube are also presented. This phase is divided into three main steps:1) Redefining elements of a fuzzy spatial datacube; 2) Proposing fuzzy spatial aggregation methods, and
3) Presenting possible scenarios for spatial aggregation that can be performed in the proposed fuzzy spatial datacube.
1.4.5 Validating the Research Results
Testing the validity of the research results obtained from previous phases is carried out in a case study on the East Coast of Quebec, Canada. This step is partially performed in precedent phases. The validation phase is composed of:
1) Conceptualizing:
17 b. Performing need analysis based on technical reports of different ministers and
organizations;
c. Performing data inventory; and
d. Conceptualizing a spatial datacube adapted for risk assessment;
2) Developing and implementing a Matlab code to accommodate the proposed fuzzy spatial objects adapted to risk assessment methods;
3) Comparing the results obtained in this research project to those of existing approaches. This step provides the similarities and differences between the obtained results and those existing before; 4) Proposing the perspective for future research opportunities based on lessons learned and limits of
our contributed approaches.
1.5 Thesis Structure
The results of this 5-years research to fulfill the requirements of this doctoral research work are presented in six chapters. However, this thesis is paper-based. Hence, three Chapters 3, 4, and 5 are the versions of submitted and published in three peer-reviewed scientific journals. Thus, there are some redundancies between these chapters and Chapter 2.
In Chapter 1, the research context including the problem statement, the research objectives (general and specific), and the research method to realize the proposed research work have been presented.
In Chapter 2, the relevant works identified in the literature review regarding the fundamental key concepts of this research project are discussed.
In Chapter 3, the characteristics of coastal erosion risk assessment and in particular, and the multidimensionality aspect of the risk itself are explained. A conceptual framework to model the spatial and non-spatial data required for risk assessment in a SDSS as SOLAP is also proposed. The main contribution of this chapter is a comprehensive multidimensional data model serving as an innovative example to improve the assessment of coastal erosion risk using the SOLAP approach. As a result, a spatial multidimensional conceptual model is presented whilst a deep investigation of the hierarchy model for each analysis axis is discussed. Indeed, the main achievement of this chapter is part of the first specific objective of this research project.
18
In Chapter 4, the spatial fuzzy representation of phenomenon in order to deal with inherent information vagueness due to data modeling as well as semantic definition is presented. Fuzzy Set Theory is then chosen due to its flexibility with human reasoning and perception to deal with this problem. The main contribution of this chapter is to characterize the source and nature of uncertainty appearing as information vagueness in an integrated risk assessment procedure and then handling it in an optimum way. Indeed, this chapter covers the second specific objective of this research project.
In Chapter 5, the integration of the fuzzy-based approach within a spatial datacube is explained and the possibility of incorporating fuzzy concept in defining a spatial datacube’s elements is discussed. The main contribution of this chapter is therefore to formalize a fuzzy spatial datacube by redefining its key elements and the fuzzy spatial aggregation methods. This allows for dealing with the multidimensionality and hierarchy characteristics of risk assessment. This chapter covers part of first objective and the third specific objective of the current search project.
19
Literature Review
Chapter 2
2.1 Introduction
In this chapter, fundamental concepts related to the current research work are reviewed. These include geospatial business intelligence technologies for decision-making, spatial datacubes, spatial data models and spatial data integration methods in a spatial datacube, spatial uncertainty and the methods to deal with it, such as fuzzy set theory. For application purposes, a deep review is done on the assessment and representation of risk with a focus on its spatial characteristics. These concepts are essential to understand the main objectives of this thesis that lead to the fulfillment the expected results. The recent advances in geospatial technologies to handle data modeling and integration are discussed in section 2.2. In Section 2.3, risk assessment and representation with a focus on risk characteristics is introduced. Uncertainty, its nature, and its impact level in the context of decision-making and risk assessment are described in Section 2.4. Also, how data uncertainty and information are handled in a spatial datacube is discussed in this section. The fundamental of spatial data model is discussed in section 2.5 with a focus on fuzzy set theory dealing with uncertainty. This chapter is concluded with a resume of the materials provided in Section 2.6. Since, this thesis manuscript is paper-based; accordingly, there are some redundancies between this chapter and Chapters 3, 4, and 5.
2.2 Advance in Geospatial Technologies for Decision-Making
Geospatial technologies and more specifically GIS provide a wide range of functionality for collection, storage, management, integration, analysis, visualization, and diffusion of spatial and non-spatial data for decision-making. Despite these functionalities, GIS has some limitations for efficient decision-decision-making. For instance, the“Somewhere, something incredible is waiting to be known.” Carl Sagan
20
complex multidimensional characteristics of natural phenomenon and the need to carry out on-the-fly multidimensional analysis are the main challenges of the current GIS.
From another perspective, an essential characteristic of an information system as a decision support system is interconnecting the data from natural processes and human activities into a fast and intuitive solution, by avoiding any prior knowledge about the whole system. In this perspective, the recent evolutions of DSS and the compatibility with GIS leading to SDSS are regarded as a potential solution. In particular, SDSS technology relying on spatial datacubes, which evolved from the field of Business Intelligence (BI), has been rapidly gaining popularity over the last couple of years in several fields.
Most of recent SDSS deal adequately with the majority of conceivable situations by allowing fast synthesis, easy comparisons, and multi-level querying of information for decision-making. It allows decision-makers to focus only on specific criteria and their interactions, intelligently control the overall process, and employ all available data, information, and knowledge into a hierarchical system. It also provides a user-friendly environment for the decision-makers to easily and rapidly navigate within a geospatial database toward the elaboration of an optimal sustainable management and prevention/protection plan (Rivest et al. 2001). Consequently, possible scenarios become rapidly clear and can be presented to decision-makers by creating new relations based on emerged options. Using SDSS technology such as SOLAP and Spatial dashboard, decision-makers are no longer involved in creating complex Structure Query Language (SQL) queries. Non-expert users are able to carry out their analysis with a few mouse clicks and display the results in detail in the form of maps, detailed or aggregated histograms, and detailed or summarized tables (Bédard et al. 2007). Transactional and analytical databases are two main categories of spatial databases (Salehi et al. 2010). Regardless of its category as either transactional or analytical , the integration of data from different sources is the key functionality of any database (Bejaoui 2009). Transactional databases are most often used due to their facility for storing, integrity checking, manipulation, and visualization of a spatial phenomenon. Analytical spatial databases support fast and efficient decision-making within an interactive spatiotemporal analysis interface. These types of databases are mainly used in application, such as Business Intelligence. Data Warehouses and Data Marts are the typical analytical databases (Kimball & Ross 2002). A data warehouse is a subject-oriented, integrated, time-variant, and non-volatile database that aims to support decision-making processes (Inmon 1992). The multidimensional structures such as a datacube or a hypercube are the main analytical data structures that are employed in analytical databases (Chaudhuri et al. 2011).