WITHIN AND ACROSS BREEDS DIFFERENCES IN FATTY ACIDS PROFILES OF MILK AND MILK FAT IN DAIRY COWS
H. Soyeurt1,5, P. Dardenne2, P. Mayeres1,3, C. Croquet1,4, S. Vanderick1, C. Bertozzi3 and N. Gengler1,4
1Gembloux Agricultural University, B-5030 Gembloux, Belgium
2Walloon Agricultural Research Centre, Quality Departement, B-5030 Gembloux, Belgium
3Walloon Breeders Association, B-5530 Ciney, Belgium
4National Fund for Scientific Research, B-1000 Brussels, Belgium
5F.R.I.A., B-1000 Brussels, Belgium
INTRODUCTION
A typical milk contains on average 70% saturated fatty acids (SAT), 25% monounsaturated fatty acids (MONO) and 5% polyunsaturated fatty acids (POLY) (Grummer, 1991). However, a composition of milk favourable to human health would be around 30% SAT (Pascal, 1996), 60% MONO and 10% POLY (Hayes et al., 1992). So, the fatty acid contents are far away from the optimal profile. However, the observed variability in fatty acids suggests that by influencing factors linked to this variation one can alter it. If many results are currently available describing the influence of feeding, much less is available for breed and individual differences, even if variation of overall milk fat between breeds is well known.
Studying the genetic of nutritional quality in milk requires a lot of data. Many genetic studies have used chromatographic analysis to estimate the fatty acid contents in milk. This method is efficient but requires a long time for analysis, expensive reagents and well skilled staff. Therefore generally these studies used a restrictive number of animals and samples. Mid-Infrared Spectrometry is a faster method to estimate different components of milk. This technology is already currently integrated into milk recording to estimate the percentage of fat and protein in milk. Because of a lack of adapted calibration equation, it is only used for major components. A recent previous study by Soyeurt et al. (2005) obtained calibration equations to estimate the different fatty acid contents in milk.
the objective of this research was to study the variation of fatty acids contents in milk and milk fat within and across breeds using Infrared. By estimating the ratio of product / substrate (Lock et al., 2003), the difference in delta-9 desaturase activity within and across breeds was also studied owing to its implication in the variation of fatty acid profile.
MATERIAL AND METHODS
Animal population. Milk samples were taken on each milked cow present in 7 herds. During
3 months (April, May and June) in 2005, 600 samples were taken for 275 cows from 5 breeds (Dual Purpose Belgian Blue (DPB), Holstein-Friesian (HOL), Jersey (JER), Montbeliarde (MON) and non Holstein Meuse-Rhine-Yssel type Red and White breeds (RED)).
Predicted concentrations. These samples contained 50 % of morning milk and 50 % of
evening milk produced by the studied cows. Samples were then analysed by Mid-Infrared FOSS Milkoscan FT6000, an instrument that provides also the standard milk recording analyses. Calibration equations used, were those obtained by Soyeurt et al. (2005). We considered only those reasonably reliable with cross validation coefficients of determination that were above or equal to 0.60.
Differences of fatty acids profiles. Predicted results were analysed by using the following
single trait mixed model: y = X + Zu + e where y is the vector of observations (fat, fatty acids contents in milk or milk fat) ; is the vector of fixed effects (herd * test date, number of lactation, stage of lactation, regressions on breed composition as a lot of animals were crossbred, when fatty acids contents in milk fat were analysed a regression of milk fat percentage was added to prevent a bias due to the variation of fat percentage in milk ); u is the vector of random repetition on animal effect; X, Z are incidence matrices; e is the vector of random residual effects. Animals were considered unrelated as tests using the relationships matrix and separated genetic and permanent environmental effects did not converge. Computations were done with SAS PROC MIXED, and variance components were estimated by REML. Results for regression on breed composition were reported compared to the reference Holstein breed. In order to allow comparisons across traits, differences were also expressed on a standardized scale by dividing them by the total standard deviation obtained as the square root of the sum of the animal and residual variances. In this study, we will report essentially on these standardized scales. Animal repeatability was estimated from the ratio between animal and total variances. The overall individual effects were estimated from the sum of the breed and animal effects. These individual effects should be considered as corrected phenotypic values for the different cows.
RESULTS AND DISCUSSION
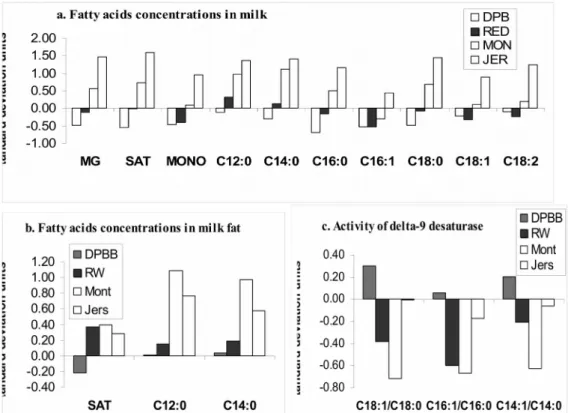
By comparing total milk fat with fatty acids on a standardized scale one notices that the values obtained were not constant. For example, DPB had the lowest concentration in milk fat. So, results were clearly lowest for SAT and MONO in milk. Also the concentrations in C18:1 and C18:2 9-cis, 12-cis obtained were not the lowest concentrations for these fatty acids (Figure 1a). Therefore, the proportion of unsaturated fatty acids in milk fat might be high. In fact, the fat of DPB contained the lowest proportion in SAT (Figure 1b). These observations might be explained by the higher activity of delta-9 desaturase for this breed (Figure 1c). Similarly, the fat of RED and MON contained a high proportion of SAT. This might be explained by a low delta-9 activity. Few publications have compared the fatty acids compositions for milk produced by different breeds. Palmquist et al. (1992) showed that the proportion of SAT in JER milk fat was higher than the one produced by the HOL animals, a result that our results confirmed. However, SAT in milk fat of JER was not the highest although the milk fat percentage was the highest.
The repeatabilities for all studied traits were calculated to estimate the differences within breed, The obtained results were high with values between 43 and 61 % (Table 1). Future studies should show if these are an indication for reasonable high heritabilities.
Finally, the individual variation for each fatty acid contained in milk was estimated (Table 2). The high values obtained might suggest that the individual effect is more important than
the breed effect. The same conclusion might be formulated with the individual effect calculated for fatty acids contents in milk fat (results not shown).
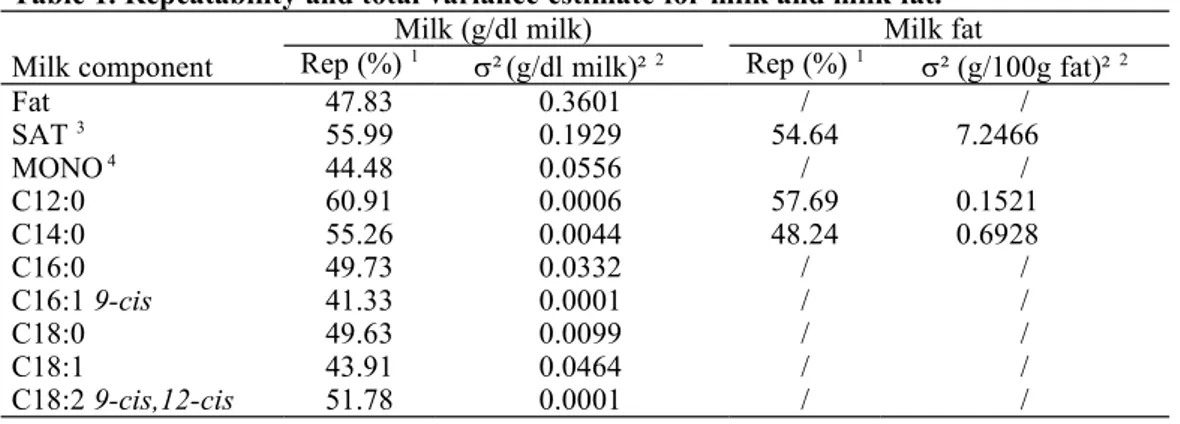
Table 1. Repeatability and total variance estimate for milk and milk fat.
Milk component
Milk (g/dl milk) Milk fat
Rep (%) 1 ²(g/dl milk)² 2 Rep (%) 1 ² (g/100g fat)² 2
Fat 47.83 0.3601 / / SAT 3 55.99 0.1929 54.64 7.2466 MONO 4 44.48 0.0556 / / C12:0 60.91 0.0006 57.69 0.1521 C14:0 55.26 0.0044 48.24 0.6928 C16:0 49.73 0.0332 / / C16:1 9-cis 41.33 0.0001 / / C18:0 49.63 0.0099 / / C18:1 43.91 0.0464 / / C18:2 9-cis,12-cis 51.78 0.0001 / /
1 Rep = Repeatability; 2 ² = Total variance; 3 SAT = Saturated fatty acids; 4 MONO = monounsaturated fatty acids.
Table 2. Estimated individual variation for each studied component in milk (g/dl milk).
Component
Individual variation (g/dl milk)
Minimum Maximum Fat -1.34 2.69 SAT 1 -1.43 3.03 MONO 2 -1.44 2.79 C12:0 -1.88 3.29 C14:0 -1.41 2.98 C16:0 -1.54 2.33 C16:1 9-cis -1.49 2.61 C18:0 -1.23 2.63 C18 :1 -1.45 2.76 C18 :2 9-cis,12-cis -1.34 3.40
1 SAT = Saturated fatty acids; 2 MONO = Monounsaturated fatty acids.
Figure 1. Across breeds difference in fatty acids profile in milk (a), milk fat (b) and in activity of delta-9 desaturase (c).
CONCLUSION
The differences in fatty acids of milk across the selected breeds have been shown. It might suggest the possibility to obtain milk products with differentiated quality by the choice of breed. The differences within breed have also been shown and suggest a high heritability for each component of fatty acids profile. Finally the individual animal effect on the fatty acids profile was also shown. With the probability of high heritability for each fatty acid, these results suggest the possibility to improve the nutritional quality of milk by animal selection.
REFERENCES
Grummer, R.R. (1991) J. Dairy Sci. 74 : 3244-3257.
Hayes, K.C. and Khosla, D.R. (1992) FASEB J. 6 : 2600-2607.
Lock, A.L. and Garnsworthy, P.C. (2003) Livestock Production Science 79 : 47-59. Palmquist, D.L. and Beaulieu, A.D. (1992) J. Dairy Sci. 75(Supll. 1) : 292 (Abstr.). Pascal, G. (1996) OCL 3 : 205-210.
Soyeurt, H., Dardenne, P., Lognay, G., Veselko, D. and Gengler, N. (2005) J. Dairy Sci. (submitted).