HAL Id: hal-01778465
https://hal-ensta-paris.archives-ouvertes.fr//hal-01778465
Submitted on 16 Jan 2019HAL is a multi-disciplinary open access archive for the deposit and dissemination of sci-entific research documents, whether they are pub-lished or not. The documents may come from teaching and research institutions in France or abroad, or from public or private research centers.
L’archive ouverte pluridisciplinaire HAL, est destinée au dépôt et à la diffusion de documents scientifiques de niveau recherche, publiés ou non, émanant des établissements d’enseignement et de recherche français ou étrangers, des laboratoires publics ou privés.
Vapor–Liquid Equilibrium of Ethyl Lactate Highly
Diluted in Ethanol–Water Mixtures at 101.3 kPa.
Experimental Measurements and Thermodynamic
Modeling Using Semiempirical Models
Cristian Puentes, Xavier Joulia, Patrice Paricaud, Pierre Giampaoli, Violaine
Athès, Martine Esteban-Decloux
To cite this version:
Cristian Puentes, Xavier Joulia, Patrice Paricaud, Pierre Giampaoli, Violaine Athès, et al.. Vapor– Liquid Equilibrium of Ethyl Lactate Highly Diluted in Ethanol–Water Mixtures at 101.3 kPa.
Experimental Measurements and Thermodynamic Modeling Using Semiempirical Models.
Jour-nal of Chemical and Engineering Data, American Chemical Society, 2018, 63 (2), pp.365-379. �10.1021/acs.jced.7b00770�. �hal-01778465�
OATAO is an open access repository that collects the work of Toulouse
researchers and makes it freely available over the web where possible
Any correspondence concerning this service should be sent
to the repository administrator:
tech-oatao@listes-diff.inp-toulouse.fr
This is an author’s version published in:
http://oatao.univ-toulouse.fr/21142
To cite this version:
Puentes, Cristian and Joulia, Xavier
and Paricaud, Patrice and Giampaoli, Pierre and
Athès, Violaine and Esteban-Decloux, Martine
Vapor–Liquid Equilibrium of Ethyl
Lactate Highly Diluted in Ethanol–Water Mixtures at 101.3 kPa. Experimental
Measurements and Thermodynamic Modeling Using Semiempirical Models. (2018)
Journal of Chemical & Engineering Data, 63 (2). 365-379. ISSN 0021-9568
Vapor
−Liquid Equilibrium of Ethyl Lactate Highly Diluted in
Ethanol
−Water Mixtures at 101.3 kPa. Experimental Measurements
and Thermodynamic Modeling Using Semiempirical Models
Cristian Puentes,
†Xavier Joulia,
‡Patrice Paricaud,
§Pierre Giampaoli,
†Violaine Athès,
⊥and Martine Esteban-Decloux*
,††Unité Mixte de Recherche Ingénierie Procédés Aliments, AgroParisTech, INRA, Université Paris-Saclay, F-91300 Massy, France ‡Laboratoire de Génie Chimique, Université de Toulouse INPT-ENSIACET, CNRS, F-31030 Toulouse, France
§Unité de Chimie et Procédés, ENSTA ParisTech, Université Paris-Saclay, F-91762 Palaiseau, France
⊥Unité Mixte de Recherche Génie et Microbiologie des Procédés Alimentaires, AgroParisTech, INRA, Université Paris-Saclay,
F-78850 Thiverval-Grignon, France
*
S Supporting InformationABSTRACT: A thermodynamic study of the vapor−liquid equilibrium for the ternary system ethyl lactate−ethanol−water was performed at 101.3 kPa and infinite dilution regarding ethyl lactate, for boiling temperatures ranging from (352.3 to 370.0) K. The experimental measurements were carried out with a recirculation still and the equilibrium compositions of ethyl lactate were determined by gas chromatography. The volatility of ethyl lactate decreases when the ethanol content in the liquid phase is increased. The investigated system was correctly correlated by the NRTL and UNIQUAC models, with an average absolute relative deviation below 10%. The comparison with the results obtained from interaction parametersfitted to experimental data of the binary systems ethyl lactate− ethanol and ethyl lactate−water at 101.3 kPa, proves that the parameters calculated in this work give a better description of the ethyl lactate volatility, a key parameter in distillation, at low concentrations. These latter parameters are therefore recommended for process simulation and optimization in alcoholic beverages production.
■
INTRODUCTIONProcess simulation is a powerful tool to design, analyze, and optimize chemical and biochemical processes. For the correct simulation of separation units, there are two factors of crucial importance: (1) a reliable and accurate knowledge of the phase equilibria, and (2) a suitable choice of thermodynamic models to correctly describe the volumetric behavior of the involved phases.1−7
In alcoholic distillation, some simulation studies have been performed over the last 50 years with the aim of identifying and predicting the influence of operating parameters on process variables such as product quality and efficiency.6,7 These researches have been focused on continuous processes for the production of whisky,8 neutral alcohol,6,7,9 bioethanol,10−12 cachaça,13and anhydrous fuel ethanol.14 In batch distillation, simulation has been applied for the analysis of the recovery process of ethanol produced from banana culture waste,15as well as the production of pisco,16,17cachaça in a lab-scale pot still,18,19 whisky,7 pear distillates,20 and bitter orange distillates.6 The simulations were performed by either implementing mathemat-ical models of mass and energy balances or using commercial software as AspenPlus, Aspen Dynamics, BatchColumn, ChemCAD, Pro/II, and ProSimPlus.
The common point among these studies is that the feedstock was modeled as a simplified mixture of ethanol and water with several minor volatile species, known as congeners or aroma compounds. The number of aroma compounds considered varies between 0 and 16 and the chemical families included are acetals (acetal), alcohols (methanol, propan-1-ol, propan-ol, propen-1-ol, methylpropan-1-ol, butan-1-ol, butan-ol, 2-methylbutan-1-ol, 3-2-methylbutan-1-ol, pentan-1-ol, pentan-2-ol, hexan-1-pentan-2-ol, 2-phenylethanol), carbonyl compounds (acetal-dehyde, acetone), carboxylic acids (acetic acid, propionic acid, octanoic acid), esters (methyl acetate, ethyl acetate, ethyl hexanoate, ethyl decanoate), furanes (furfural), and terpenes (pinene, limonene, linalool, linalool oxide). Carbon dioxide has also been considered in some researches, in order to analyze its influence on the product composition.7,10,11,14
In alcoholic beverages production, the understanding of aroma compounds behavior in distillation is fundamental since they are responsible for the product quality. Several hundred of aroma compounds are mainly generated at low concentrations during the fermentation step and a lower proportion during distillation
and maturation.21−26The simulation studies from the literature have included some of the most representative species. However, other important aroma compounds, such as ethyl lactate, have never been analyzed.
Ethyl 2-hydroxypropanoate, commonly known as ethyl lactate, is produced by the reaction of lactic acid, from malolactic fermentation, with ethanol. This compound has been quantified in wine and distilled beverages at very different concentration levels. In wine from traces to 500 mg·L−1and in distillates up to 400 mg·L−1.27−29Together with ethyl acetate, they constitute the main esters found in distillates.30From a sensory point of view, ethyl lactate may act as a stabilizer of the distillateflavor as well as a softener of the harshflavor characteristics if it is present at low concentrations. However, at higher concentration levels, caused by lactic acid bacteria spoilage, this compound deteriorates the organoleptic quality of distillates.28,30 In this case, process simulation may represent a useful tool to predict and control the concentration of this aroma compound to the desired levels.
As part of a confidential study carried out in our research group about cognac distillation,31the composition profiles of ethanol and 23 aroma compounds, including ethyl lactate, were simulated using the commercial software BatchColumn provided by ProSim. The thermodynamic models chosen for the representation of the vapor and liquid phases were respectively the ideal gas equation and the predictive model UNIFAC 1993.32,33 According to Figure 1, in which simulation is compared to validated experimental data from a distillation campaign at atmospheric pressure,34the temporal evolution of ethyl lactate concentration in the distillate is not at all well represented during the two series batch distillations of the traditional process, known as Charentaise distillation. In thefirst distillation,Figure 1a, the concentration is highly overestimated and follows a strongly decreasing trend, against a rather constant path of the experimental data. In the second one,Figure 1b, the composition profile has a maximum in the middle of the distillation period, whereas the experimental data follow an increasing trend before the depletion of ethyl lactate in the boiler, toward the end of the operation. From these experimental data, one can conclude that ethyl lactate is mainly found in the tails fraction (last cut of the second distillation), even if it is also present in the core distillate fractions, and that its volatility is therefore presumably low.
In this context, the knowledge of vapor−liquid equilibrium data of this aroma compound and a better thermodynamic model choice are indispensable to correctly describe and predict its
behavior in distillation. To our knowledge vapor−liquid equilibrium data for ethyl lactate highly diluted in ethanol− water mixtures at 101.3 kPa have not been reported in the literature. Only binary equilibrium data have been generated: (1) at isobaric conditions for the ethyl lactate (EL)−ethanol (Et) system at 101.3 kPa35and (2) isothermal conditions for the ethyl lactate (EL)−ethanol (Et) system (at 313.15, 333.25, and 353.35 K) and for the ethyl lactate (EL)−water (W) system (at 313.15 K, 333.15 K).36Isobaric equilibrium data for the ethyl lactate (EL)−lactic acid (LA)−ethanol (Et)−water (W) quaternary system at 101.3 kPa has also been reported.37For the binary measurements, the whole liquid composition range of ethyl lactate was considered, xEL= (0 to 1) mole fraction, whereas for
the quaternary system, the interval is more reduced, xEL= (0.02 to 0.20) mole fraction. In both cases the number of experimental data in the vicinity of xEL= 0 is very reduced. Concerning the
ternary mixture ethyl lactate−ethanol−water, only experimental distillation data are available, including those presented inFigure 1for cognac distillation34and some composition profiles of ethyl lactate concentration in the distillate as a function of the ethanol volume fraction in armagnac distillation.38
The objective of this work is thus to generate experimental vapor−liquid equilibrium data of ethyl lactate highly diluted over a composition range of the ethanol−water solution correspond-ing to a temperature interval from (352.3 to 370.0) K at 101.3 kPa. The equilibrium measurements are performed with a recirculation Gillespie-like still,39a device based on a dynamic method recommended in the literature for measurements at temperatures higher than 298.15 K. This procedure provides a direct and simple way to determine the equilibrium behavior of dilute mixtures, when coupled to an accurate quantitative analysis of the liquid and condensed vapor composition40,41and has been used to estimate activity coefficients of methanol and ethanol highly diluted in water40as well as partition coefficients of aroma compounds in hydroalcoholic mixtures.42,43In both cases, the results proved to be consistent with respect to distillation data and model correlation.
The equilibrium data are then correlated with the NRTL and UNIQUAC models in order to determine the interaction parameters required in process simulators for the simulation of the ethyl lactate composition profiles in both continuous and discontinuous distillation of alcoholic beverages. These models have been used to correlate with satisfactory results the equilibrium data for ethanol−water system44 as well as some
Figure 1.Evolution of the ethyl lactate concentration (CEL) in the distillate at 20°C over time (t) during the (a) first batch distillation and (b) second batch distillation. (○) Experimental data from Cantagrel et al.34(···) Simulation using UNIFAC 1993 and the ideal gas equation.
binary (aroma compound−ethanol and aroma compound water)35,36,45,46and multicomponent aroma systems.42,43,47
■
EXPERIMENTAL STUDYMaterials. The chemical compounds studied in this work are listed inTable 1, which includes the suppliers and some of their physicochemical properties. Deionized water was obtained using a Milli-Q system (Millipore waters. Molsheim, France). Concerning the total volatile compounds content, a supple-mentary purity test for ethyl lactate and ethanol was performed by gas chromatography with flame ionization detection (GC-FID). No further purification of both compounds was needed since their experimental purities were estimated to be higher than 99.8%.
The initial ternary mixtures for equilibrium measurements were prepared by precisely weighing known quantities of the three compounds. Because of the important quantity required for each equilibrium measurement (85 mL per ternary mixture, without considering the mixingflask mass), two weighing scales were used: one for ethyl lactate with an accuracy of±0.0001 g and a maximum capacity of 100 g (Mettler AE240S weighing scale. L.P. Pesage. Angervilliers, France), and another for ethanol
and water with an accuracy of±0.01 g and a maximum capacity of 1000 g (Sartorious A2612. L.P. Pesage. Angervilliers, France).
Seventeen solutions with initial ethanol mass fractions ranging from zmEt= (6.2× 10⁻²to 9.1× 10⁻¹) (or in mole fractions zEt=
(2.5× 10⁻²to 8.0× 10⁻¹)) were independently brought into equilibrium. The concentration of ethyl lactate wasfixed in every initial solution to xmEL= 1.0× 10⁻³, which corresponds to a mole composition interval xEL= (1.4× 10⁻⁴to 3.5× 10⁻⁴).
Measurements of Vapor−Liquid Equilibrium. Vapor− liquid equilibrium measurements were carried out by using the apparatus Labodest VLE 602 (i-Fischer Engineering GmbH. Waldbüttelbrunn, Germany), an all-glass still of the Gillespie type based on a dynamic method at adiabatic and isobaric conditions, with recirculation of both liquid and vapor phases.
This equipment, Figure 2, has been previously used in our laboratory to measure vapor−liquid equilibria data for other aroma compounds.42,43A detailed description has been already reported.42,48,49Some elements are recalled below.
Each ternary mixture (a charge of 85 mL) is heated and partially evaporated in the boiler. The rising vapor, carryingfine boiling droplets, goes through a contact path and arrives to a chamber where phase separation takes place, owing to a reduction of the flow velocity. Both phases, liquid and vapor Table 1. Some Properties of the Compounds Studied in This Work
compound CAS
molecular
formula MM/g·mol−1 Tb/Kb supplier
supplier purity % mass experimental purityc (R,S)-ethyl 2-hydroxypropanoatea 97-64-3 C5H10O3 118.31 427.65 Sigma-Aldrich
(Saint-Quentin Fallavier, France) ≥98.00%
99.81% ethanol 64-17-5 C2H6O 46.07 351.44 Carlo Erba (Val de Reuil, France) ≥99.90% 99.98%
water 7732-18-5 H2O 18.01 373.15
aA racemic mixture ofL- andD-enantiomers, thereafter designed as ethyl lactate.bRiddick et al.70cThis experimental volatile purity was calculated as the ratio between the surface area of the gas chromatographic peak associated to the chemical compound and the total area of all peaks detected. MM is the molar mass and Tbthe boiling point at 101.3 kPa.
Figure 2.(a) Schema of the Labodest VLE 602. Adapted from Dias et al.49(b) Schema of the pressure control system. (1) Boiler, (2) Electrical resistance, (3) Contact path, (4) Separation chamber, (5) Mixing chamber, (6) Pt100 liquid probe, (7) Pt100 vapor probe, (8) Liquid sample port, (9) Vapor sample port, (10), Solenoid valves, (11) connection to the pressure control system, (12) control center, (13) solenoid valve VN2‑auto, (14) manual needle valve VN2‑man, (15) expansion valve, (16) on−off valve, (17) expansion valve, (18) solenoid valve VVent‑auto, (19) manual needle valve VVent‑amn. (dark gray solid arrow) vapor−liquid, (blue dashed arrow) liquid (L), (red dotted arrow) vapor (V), (pink dotted arrow) condensed vapor, (light gray solid arrow) refrigerant.
(after condensation), circulate separately back to a mixing chamber connected to the boiler until thermodynamic equilibrium is reached. They arefinally sampled for chromato-graphic analysis.
Two parameters were considered to ensure the equilibrium state: temperature, governed by the binary system ethanol− water (components in largest proportion), and composition. The time needed to reach a stable temperature (with a maximal standard uncertainty of±0.3 K) was 30 min, whereas the time to reach composition equilibrium for this ternary system was determined by gas chromatography analysis to be about 2 h, once the temperature was constant.
The equilibrium temperature was measured by means of two Pt100 platinum probes (accuracy of ±0.05 K. i-Fischer Engineering GmbH. Waldbüttelbrunn, Germany), periodically calibrated against a reference platinum resistance thermometer (Pt100 Testo 735, accuracy of±0.05 K; GFF. Chilly-Mazarin, France). To promote a continuous and smooth evaporation of the mixtures, the heating power was adjusted in such a way that the condensed vapor rate was 2 drops·s−1.
Concerning the total pressure, it was monitored using a digital manometer (P-10 WIKA, accuracy of ± 0.1 kPa. i-Fischer Engineering GmbH. Waldbüttelbrunn, Germany) and con-trolled to the desired value with an electronic pressure controller (i-Fischer Engineering GmbH. Waldbüttelbrunn, Germany). This controller, presented in Figure 2 is composed of a pressurizing circuit with dry nitrogen and a venting circuit. The nitrogen circuit is used to increase the pressure, and comprises an expansion valve at the outlet of the storage bottle (where the pressure is set around 100 to 200 kPa), an on−off valve close to Labodest, a second expansion valve (for adjusting the pressure to 50 kPa maximum), a manual needle valve (VN2‑man) to vary the intakeflow, and finally a solenoid valve (VN2‑auto) activated by the
control center. A decrease of pressure is achieved by the activation of the vent valve (VVent‑auto) and the adjustment of this
leakage by the manual valve needle (VVent‑man). In this study, the set point was maintained at 101.3 kPa with a maximal standard uncertainty of± 0.5 kPa.
Determination of Equilibrium Compositions. Ethyl Lactate Mass Fractions. The analysis of ethyl lactate in the coexistent liquid and condensed vapor phases was performed by gas chromatography at the UNGDA laboratory. The equipment, a chromatograph 5890 series II, Hewlett-Packard (Agilent Technologies. Ulis, France) was coupled to aflame ionization detector (T = 220 °C, H2, 40 mL·min−1; air, 450 mL·min−1;
make-up gas He, 45 mL·min−1. Agilent Technologies. Ulis, France). A polar, polyethylene glycol capillary column (DB-WAX. 60 m linear length, 0.50 mm internal diameter, 0.25μm film thickness. Agilent Technologies. Ulis, France) was used as stationary phase for the analysis. Hydrogen was used as the carrier gas at constantflow rate of 2.1 mL·min−1. A 2μL aliquot of sample was directly injected with a split ratio of 1/30.
The initial oven temperature was set at 45°C, followed by a linear increase rate of 5°C·min−1to 130°C and a final linear increase rate of 15°C·min−1to 210°C. The total running time per analysis was 22 min. The chromatographic data were acquired with the Hewlett-Packard Chemstation software B 0204 from Agilent Technologies.
The mass compositions of ethyl lactate were determined through calibration curves including butan-1-ol (CAS 71-36-3; mass purity, 99.50%; Carlo Erba. Val de Reuil, France) as internal standard to minimize variability. The calibration curves were established by diluting ethyl lactate in two different solvents:
absolute ethanol and an ethanol−water mixture (ethanol mass fraction zmEt= 0.5), in order to take account of the variations of
injections and column performances due to matrix effects. In both calibration curves, the ethyl lactate mass fraction range varies from xmEL= (0.2× 10⁻⁴to 50.0× 10⁻⁴), suitable for the
analysis of the equilibrium samples. Seven calibration points were considered in both solvents.
The calculated detection and quantification limits derived from the analytical treatment of the calibration results were, respectively, DL = 6.5× 10⁻⁶g·g−1and QL = 50.0× 10⁻⁶g·g−1in absolute ethanol, and DL = 2.0× 10⁻⁵g·g−1and QL = 14.0× 10⁻⁵g·g−1in the ethanol−water mixture.
For mixtures with ethanol mass fractions lower than 0.50, a quantitative dilution in ethanol was done to reach zmEt= 0.50 and
the ethyl lactate compositions were calculated by using the calibration curve in the mixed solvent. For mixtures with higher ethanol fractions, the ethyl lactate compositions were calculated without any dilution. The calibration curve in absolute ethanol was used for mixtures with ethanol mass fractions between 0.75 and 1.00, and that in the mixed solvent, for mixtures with ethanol mass fractions between 0.50 and 0.75.
Each equilibrium sample as well as each calibration point was injected in triplicate. The relative standard uncertainty of the ratio between the ethyl lactate peak area and that of butan-1-ol, ur(RAEL‑IS), varies from 0.05% to 5.03% with an average value of
0.44%. This result enables validation of the analysis repeatability, and therefore of the precision of the composition calculated with the calibration curves.
The initial ternary mixtures, before equilibrium, were also analyzed in order to validate the accuracy of the analysis. The relative deviation (AD%) between the mass fractions of ethyl lactate determined by weighing (zmEL‑EXP), and the analytical values estimated by gas chromatography (zmEL‑ANA) varies
between 0.69% and 10.46%. Nonetheless, except for this upper limit, the deviations are inferior to 6.41% and the overall relative deviation (AAD %) is only around 4.62%. This value is quite acceptable in relation to the analysis technique and to the concentration level of ethyl lactate in the ternary solutions.
Ethanol Mass Fractions. The ethanol mass compositions in the liquid and vapor phases were computed from the following experimental data: temperature (T), pressure (P), and global initial composition of the mixed solvent (zEt), by considering that
the bubble temperature and compositions of ethanol and water depend exclusively on the ethanol−water binary equilibrium. This assumption is valid because the concentration of ethyl lactate in both phases is significantly low (maximum liquid mole fraction on the order of 10−4), which means that its influence on the thermal and mechanical equilibriums of the system is negligible.43
The calculation was carried out using the Flash TP algorithm of the Simulis Thermodynamics Package by ProSim, which computes equilibrium compositions at fixed temperature, pressure, and global composition. The thermodynamic model used to represent the vapor−liquid equilibrium of the binary system ethanol−water at 101.3 kPa was NRTL, with the interaction parameters reported by Kadir.50 The reliability of these parameters was verified by fitting the experimental data measured by different authors.44,51−53 The average relative deviation between the experimental and the calculated temper-atures was 0.2% and that of mole fractions in the vapor phase around 1.24%. The equilibrium diagram including the experimental data and the NRTL representation is presented
The calculation of ethanol mass fractions, instead of a measurement with a specific instrumental technique can be considered to be an acceptable approach for two reasons: (i) the experimental values of temperature and pressure are reliable enough and (ii) the NRTL model represents accurately the phase behavior of the mixed solvent. Moreover, it is important to point out that the real interest of our research is to represent the equilibrium distribution of ethyl lactate for simulation purposes, hence the analytical ef fort was focused on the quantification of this minor compound.
Mole Fractions. The mass fractions of water were calculated by difference. The mole fractions of the liquid and vapor phases were then computed from the mass fractions and the molar masses of the three compounds.
Computation of Uncertainties. The uncertainties of the equilibrium variables were calculated by using the law of propagation of uncertainties, as they were not measured directly but determined from other quantities through a functional relation.54 The propagation of standard uncertainties is associated with four main factors: (1) the mass measurements with the weighing scales (u(m1) = 0.00006 g for thefirst one and
u(m2) = 0.006 g for the second one), (2) the repeatability of the
injections in chromatographic analysis, expressed in terms of the area ratio between the ethyl lactate and internal standard peaks (0.001≤ u(RAEL‑IS)≤ 0.081), (3) the temperature measurements
(0.1 K≤ u(T) ≤ 0.3 K), and (4) the pressure measurements (0.2 kPa≤ u(P) ≤ 0.5 kPa), both during the equilibrium experiments. The calculation was simplified by assuming that the estimates of the input quantities to calculate each equilibrium variable were uncorrelated. The computed values are presented in theresults
sections.
■
THERMODYNAMIC MODELINGIn this section, some elements about the thermodynamic models used in this work are presented. A suitable choice of these models is fundamental in process simulation for a correct representation of the aroma compound behavior during distillation and other separation processes. For aroma compounds−ethanol−water systems at low pressures, the deviations from ideal behavior are usually associated with the liquid phase and can therefore be described with the excess Gibbs energy approach, widely used
and recommended in the literature. Among the models of this approach, the semiempirical methods are considered in this work since they are easy for implementation and are available in most process simulators.
Fundamental Equation of Phase Equilibrium. Vapor− liquid phase equilibria are computed by satisfying the equality of fugacities of all components i present in the two phases:55,56
=
fiV( , , )T P y fiL( , , )T P x (1) Here fiVand f
i
Lare the vapor and liquid fugacity of the species i,
respectively. This property is a function of the temperature (T), the pressure (P), and the corresponding vector of mole composition (y or x).
Since the pressure is low (<1000 kPa) and always below the critical pressure of the pure components, the vapor phase can be assumed as an ideal gas mixture and the properties of the liquid phase are pressure independent. As a result, eq 1 can be approximated as
γ
=
yPi i( , )T x x P Ti io( ) (2)
Ineq 2,γiis the activity coefficient of the species i in the liquid
phase, Pio(T) is the vapor pressure of pure compound, and y iand
xiare the respective equilibrium mole fractions in the vapor and
liquid phases.
The equilibrium behavior of an aroma compound (AC) in hydroalcoholic mixtures depends not only on the physical conditions (T, P) but also on the solvent composition (ethanol and water), and can be described by means of two properties: the partition coefficient and the relative volatility.
The partition coefficient (KAC), also known as physical equilibrium constant or absolute volatility, represents the aroma compound distribution between the vapor and liquid phases and is defined as
= K y x AC AC AC (3)
The relative volatility with respect to ethanol (αAC/Et), is an
indicator of the species behavior during the distillation of aroma compounds−ethanol−water mixtures:57
α = K = = K y x y x y x y x / / / / AC/Et AC Et AC AC Et Et mAC mAC mEt mEt (4)
By combiningeqs 2and3, the partition coefficient can also be computed as γ = = K y x T P T P x ( , ) ( ) i i i i i o (5)
In the current study, it is useful to consider that ethyl lactate is placed in the region of infinite dilution, as this compound is present at very low concentrations (maximum liquid mole fraction on the order of 10−4).
In this case, the Henry constant,/iis defined by the following
relation:58 = → T P f T P x x x ( , , ) lim ( , , ) i x i L i 0 i / (6)
At low pressures, this variable can also be written as a function of Pio(T) andγ
i(T,x) at infinite dilution or γi∞(T,xs), which depends
on the temperature and solvent composition, xs:
Figure 3.Equilibrium diagram of the binary system ethanol−water at 101.3 kPa: (◇) data by Lai et al, 2014;44(□) data by Arce et al, 1996;51 (△) data by Yang and Wang, 2002;52(○) data by Kamihama et al, 2012;53() NRTL model using the interaction parameters calculated by Kadir.50 T is the equilibrium temperature, xEtthe ethanol mole fraction in the liquid phase, and yEtis the ethanol mole fraction in the vapor phase.
γ = ∞ T x T x P T ( , ) ( , ) ( ) i s i s i o / (7)
The activity coefficient at infinite dilution, γi∞, provides accurate
information about the aroma compound−mixed solvent interactions and therefore about the deviation from the ideal solution.59
In this work, the vapor pressure of the three compounds have been calculated with the Riedel equation,60an extended version of the Antoine equation:
= ⎜⎛ + + + ⎟ ⎝ ⎞ ⎠ P T A B T C T D T ( ) 1 1000 exp ln( ) io i i i i Ei (8)
where Pio(T) is given in kPa and T in K. Ai, Bi, Ci, Di, and Eiare
coefficients specific for each compound. They were taken from the DIPPR Database, available through the Simulis
Thermody-namics Package, and are summarized inTable 2. According to the values of Tminand Tmax, the coefficients are valid for the three
compounds in the temperature range of the equilibrium measurements (from 352.3 to 370.0) K.
Calculation of Activity Coefficients. With regard to the activity coefficient, two semiempirical models of the excess Gibbs energy (GE) approach were used in this work: NRTL and UNIQUAC. Both models provide pressure-independent activity coefficients as a function of temperature and composition.61The main working equations are presented in this section. The reader is directed to the principal references indicated for each model for further details about their theoretical basis.
The non-random two liquid (NRTL) and universal quasichemical (UNIQUAC) models of liquid solution are based on the concept of local composition as introduced by Table 2. Coefficients of the Riedel Equation for Calculating Vapor Pressures in kPa at a Given Temperature in Ka
component Ai Bi Ci Di Ei Tmin/K Tmax/K ethyl lactate 78.774 −6715.3 −9.5666 1.4993× 10⁻² 1 247.2 588.0 ethanol 73.304 −7122.3 −7.1424 2.8853× 10⁻⁶ 2 159.1 514.0 water 73.649 −7258.2 −7.3037 4.1653× 10⁻⁶ 2 273.2 647.1
aT
minand Tmaxdefine the temperature interval of validity of the empirical equation. Information is available in Simulis thermodynamics package.
Table 3. Activity Coefficient (γi) Equations of NRTL and UNIQUAC Modelsa
reference equations parameters
NRTL Model
Renon and Prausnitz63
∑ γ τ τ τ = ∑ ∑ + ∑ − ∑ ∑ = = = = = = ⎛ ⎝ ⎜ ⎜ ⎞ ⎠ ⎟ ⎟ T G x G x G x G x G x G x x ln ( , )i j n ji ji j k n ki k j n ij j k n kj k ij k n kj kj k j n kj k 1 1 1 1 1 1 (3.1)
•Binary interaction parameters Aij0, AijT, cij0, cijT
τ = − Gij exp( cij ij) (3.2) = + − cij cij0 c TijT( 273.15) (3.3) τ = − = + − g g RT A A T RT ( 273.15) ij ij jj ij ij 0 T (3.4) UNIQUAC Model γ = γ + γ ln Ti( , )x lniC lniR (3.5) combinatorial contribution, lnγiC Staverman−Guggenheim term ∑ γ φ θ φ φ = + + − = x Z q l x x l ln ln 2 ln i i i i i i i i i j n j j C 1 (3.6) = − − − l Z r q r 2( ) ( 1) i i i i (3.7) •Coordination number, Z = 10
Abrams and Prausnitz71 φ =
∑= rx r x i i i j n j j
1 (3.8) •Van der Waals volume, ri
Anderson and Prausnitz72 residual contribution, lnγ
iR •Van der Waals surface, •qiand qi′
∑ ∑ γ θτ θ τ θ τ = ′ − ′ − ′ ′ ∑ ′ = = = ⎛ ⎝ ⎜ ⎜ ⎞ ⎠ ⎟ ⎟ q q q ln i i iln j n i ji i j n i ji k n k kj R 1 1 1 (3.9)
•Binary interaction parameters Aij0, AijT
θ = ∑= ′ q x q x i i i j n j j 1 (3.10) θ′ = ′ ∑= ′ q x q x i i i j n j j 1 (3.11) τ = − − = − + ⎛ ⎝ ⎜ ⎞ ⎠ ⎟ ⎛ ⎝ ⎜⎜ ⎞ ⎠ ⎟⎟ g g RT A A T RT exp exp ij ij jj ij0 ijT (3.12) aτij, g
ij, Gijare binary interaction variables between species i and j in both activities models.φiis a volume fraction,θiandθi′ are surface fractions and li a supplementary parameter of the combinatorial contribution in the UNIQUAC model. R is the ideal gas constant (1.9872 cal·mol−1·K−1) and n is the number of chemical species in the system, three in this work.
Wilson.62They are valid at low pressures (<1000 kPa) and are widely recommended for the description of hydroalcoholic solutions. The activity coefficient of a component i as a function of composition and temperature is given by the equations summarized in Table 3. The UNIQUAC pure compound parameters for the three species studied in this work are presented inTable 4.
In both semiempirical models, the temperature dependence of cij and τij is evaluated according to the original formalisms, included in the Simulis Thermodynamics package. The variables Aij0, A ij T (non-symmetric), c ij 0 and c ij
T (symmetric) are binary
interaction parameters specific to each system. They must be
obtained by regression of experimental equilibrium data and/or other thermophysical properties of the liquid phase. The estimation of these parameters for the studied system is presented in theresultssection.
■
RESULTS AND DISCUSSIONExperimental Data. The vapor−liquid equilibrium data of the ternary system at 101.3 kPa are given in Table 5. To characterize the behavior of ethyl lactate in the hydroalcoholic medium, the values ofγEL∞,/EL, KEL, andαEL/Etare reported in
Table 6. Activity coefficients and Henry constants derive from
the equilibrium relations, eq 2 andeq 7, and volatilities were directly calculated from composition data, according toeq 3and
eq 4. For the measurements of temperature and pressure, the values are reported with their respective standard uncertainties. For the other equilibrium variables, the reported uncertainties are the combined expanded ones, using a confidence level of 95% that corresponds to a coverage factor of k = 2.
The evolution of absolute and relative volatilities as a function of ethanol composition in the liquid phase is presented inFigure 4. According to thisfigure, the volatility of ethyl lactate decreases with the increasing ethanol concentration in the liquid phase. Table 4. UNIQUAC Parameters for the Studied System
component ria qia qi′b
ethyl lactate 4.4555 3.9280 3.9280 ethanol 2.1055 1.9720 0.9600 water 0.9200 1.4000 1.0000
aDelgado et al.37bAnderson and Prausnitz.72r
iis the van der Waals volume, and qiand qi′ are the van der Waals surfaces.
Table 5. Vapor-Liquid Equilibrium Data of the System Ethyl Lactate Highly Diluted (EL)−Ethanol (Et)−Water (W) at P = 101.3 kPaa
mole composition of liquid phase (x) mole composition of vapor phase (y)
T/K u(T) /K u(P) /kPa xEL Uc(xEL) xEt Uc(xEt) xW Uc(xW) yEL Uc(yEL) yEt Uc(yEt) yW Uc(yW)
exp calc calc exp calc calc calc calc calc exp calc calc calc calc calc 370.0 0.3 0.2 1.38× 10⁻⁴ 1.08× 10⁻⁶ 0.012 3.35× 10⁻⁴ 0.988 3.35× 10⁻⁴ 3.81× 10⁻⁴ 7.85× 10⁻⁶ 0.117 3.40× 10⁻³ 0.882 3.40× 10⁻³ 365.6 0.1 0.2 1.62× 10⁻⁴ 8.29× 10⁻⁷ 0.035 6.40× 10⁻⁴ 0.965 6.40× 10⁻⁴ 3.02× 10⁻⁴ 2.10× 10⁻⁶ 0.264 4.84× 10⁻³ 0.735 4.84× 10⁻³ 363.8 0.1 0.2 1.64× 10⁻⁴ 1.26× 10⁻⁶ 0.049 9.03× 10⁻⁴ 0.951 9.03× 10⁻⁴ 2.44× 10⁻⁴ 5.89× 10⁻⁶ 0.321 5.91× 10⁻³ 0.678 5.91× 10⁻³ 363.7 0.1 0.2 1.55× 10⁻⁴ 1.36× 10⁻⁶ 0.050 9.59× 10⁻⁴ 0.950 9.59× 10⁻⁴ 2.31× 10⁻⁴ 5.48× 10⁻⁶ 0.323 6.26× 10⁻³ 0.677 6.26× 10⁻³ 362.0 0.1 0.2 1.82× 10⁻⁴ 1.24× 10⁻⁶ 0.066 1.23× 10⁻³ 0.934 1.23× 10⁻³ 2.37× 10⁻⁴ 2.07× 10⁻⁶ 0.375 6.92× 10⁻³ 0.624 6.92× 10⁻³ 362.0 0.2 0.3 1.77× 10⁻⁴ 6.38× 10⁻⁶ 0.066 1.69× 10⁻³ 0.934 1.69× 10⁻³ 2.34× 10⁻⁴ 3.31× 10⁻⁶ 0.376 9.50× 10⁻³ 0.623 9.50× 10⁻³ 360.0 0.1 0.2 1.78× 10⁻⁴ 8.96× 10⁻⁷ 0.095 1.76× 10⁻³ 0.905 1.76× 10⁻³ 1.30× 10⁻⁴ 1.14× 10⁻⁶ 0.432 8.00× 10⁻³ 0.567 8.00× 10⁻³ 359.1 0.1 0.5 1.83× 10⁻⁴ 9.4410−7× 0.111 2.0610−3× 0.889 2.0610−3× 1.1610−4× 1.7010−6× 0.457 8.4710−3× 0.543 8.4710−3× 358.9 0.1 0.4 1.76× 10⁻⁴ 3.03× 10⁻⁶ 0.114 2.12× 10⁻³ 0.886 2.12× 10⁻³ 1.21× 10⁻⁴ 1.20× 10⁻⁶ 0.461 8.55× 10⁻³ 0.539 8.55× 10⁻³ 358.3 0.1 0.3 1.92× 10⁻⁴ 1.07× 10⁻⁶ 0.129 2.40× 10⁻³ 0.871 2.40× 10⁻³ 7.23× 10⁻⁵ 7.33× 10⁻⁷ 0.479 8.89× 10⁻³ 0.521 8.89× 10⁻³ 358.2 0.1 0.5 1.80× 10⁻⁴ 9.48× 10⁻⁷ 0.130 2.44× 10⁻³ 0.869 2.44× 10⁻³ 7.72× 10⁻⁵ 1.04× 10⁻⁶ 0.481 8.93× 10⁻³ 0.519 8.93× 10⁻³ 357.8 0.1 0.4 2.17× 10⁻⁴ 2.84× 10⁻⁶ 0.143 2.66× 10⁻³ 0.857 2.66× 10⁻³ 8.56× 10⁻⁵ 1.01× 10⁻⁶ 0.494 9.17× 10⁻³ 0.506 9.17× 10⁻³ 357.7 0.1 0.4 2.02× 10⁻⁴ 2.18× 10⁻⁶ 0.146 2.72× 10⁻³ 0.854 2.72× 10⁻³ 8.28× 10⁻⁵ 1.65× 10⁻⁶ 0.496 9.22× 10⁻³ 0.503 9.22× 10⁻³ 353.9 0.1 0.5 2.68× 10⁻⁴ 2.70× 10⁻⁵ 0.392 7.35× 10⁻³ 0.608 7.35× 10⁻³ 2.89× 10⁻⁵ 1.32× 10⁻⁶ 0.615 1.15× 10⁻² 0.385 1.15× 10⁻² 353.9 0.1 0.3 2.71× 10⁻⁴ 6.06× 10⁻⁶ 0.401 7.52× 10⁻³ 0.599 7.52× 10⁻³ 3.21× 10⁻⁵ 1.11× 10⁻⁶ 0.618 1.16× 10⁻² 0.382 1.16× 10⁻² 352.3 0.1 0.5 3.45× 10⁻⁴ 3.76× 10⁻⁶ 0.624 1.18× 10⁻² 0.375 1.18× 10⁻² 2.75× 10⁻⁵ 3.81× 10⁻⁷ 0.714 1.35× 10⁻² 0.286 1.35× 10⁻² 352.3 0.1 0.4 2.82× 10⁻⁴ 3.10× 10⁻⁶ 0.626 1.18× 10⁻² 0.374 1.18× 10⁻² 2.38× 10⁻⁵ 6.96× 10⁻⁷ 0.715 1.35× 10⁻² 0.285 1.35× 10⁻²
aT and the equilibrium temperature of the vapor and liquid phases; u is the standard uncertainty, and U
cis the expanded combined uncertainty (95% level of confidence, k = 2). Notation: exp, experimental value (directly or indirectly measured with in an instrument); calc, calculated value (analytical estimation from experimental values).
This behavior, already identified for other aroma compounds highly diluted,42,43can be explained by two reasons: (1) the equilibrium temperature of the system decreases as the ethanol liquid concentration is increased (according to the Txy diagram,
Figure 3) which leads to a reduction of the vapor pressure of the
aroma compound and (2) the chemical nature of the aroma compound is closer to ethanol (presence of a carbon chain and of
a C−OH (carbon−hydroxyl) bond) than to water. Thus, when the system is enriched with the organic solvent (ethanol), the difference between the cohesive forces (like molecules) and adhesive forces (unlike molecules) in the liquid phase is reduced and the transition of ethyl lactate to the vapor phase becomes less favorable.
According to Figure 4a, the vapor phase is richer in ethyl lactate (KEL> 1) when the liquid ethanol mole fraction is lower than xEt= 0.1. For higher fractions, the phenomenon is reversed and the aroma compound becomes 2 to 10 times more abundant in the liquid phase. Concerning the relative volatility, ethanol is more volatile than ethyl lactate over the entire concentration range of the solvent, as evidenced inFigure 4b. This volatility ratio varies by a factor of 4, from 0.27, when xEttends to 0, to 0.07,
when xEttends to 1.
Modeling with Semiempirical Models. Experimental equilibrium data were correlated by using the NRTL and UNIQUAC models. The objective was to determine the interaction parameters for the binary subsystems: ethyl lactate (1)−ethanol (2), ethyl lactate (1)−water (3) and ethanol (2)− water (3), which corresponds to 18 parameters for the NRTL model and 12 for the UNIQUAC model.
To reduce the number of parameters, the following assumptions were considered:
• For the NRTL model, the non-randomness parameter, cij0,
was set to 0.3 for all binaries. This assumption is valid for systems in vapor−liquid equilibrium containing water and polar non-associated substances.63
• For the ethyl lactate−ethanol and ethyl lactate−water binaries, AijT, the temperature-dependent parameters ofτij,
were neglected. Two factors justify this approximation: (1) the number of experimental data is limited and (2) the equilibrium temperature interval is reduced (from 352.3 to 370.0) K.
Table 6. Equilibrium Variables Describing the Behavior of Ethyl Lactate Highly Diluted in Hydro-alcoholic Mixtures atP = 101.3 kPaa
activity coefficients Henry constants absolute volatility relative volatility T/K xEt γEL∞ Uc(γEL∞) /EL/kPa Uc(/EL)/kPa KEL Uc(KEL) αEL/Et Uc(αEL/Et)
exp calc calc calc calc calc calc calc calc calc 370.0 0.012 18.89 0.66 278.97 12.31 2.75 6.07× 10⁻² 0.27 1.18× 10⁻² 365.6 0.035 15.19 0.22 189.50 3.54 1.87 1.61× 10⁻² 0.25 5.61× 10⁻³ 363.8 0.049 12.98 0.37 150.18 4.59 1.49 3.78× 10⁻² 0.23 7.37× 10⁻³ 363.7 0.050 13.03 0.37 151.05 4.77 1.48 3.75× 10⁻² 0.23 7.49× 10⁻³ 362.0 0.066 12.41 0.20 133.88 2.68 1.30 1.44× 10⁻² 0.23 5.08× 10⁻³ 362.0 0.066 12.21 0.55 131.88 6.66 1.32 5.12× 10⁻² 0.23 1.09× 10⁻² 360.0 0.095 7.42 0.12 73.91 1.47 0.73 7.35× 10⁻³ 0.16 3.29× 10⁻³ 359.1 0.111 7.31 0.13 69.89 1.53 0.63 9.85× 10⁻³ 0.15 3.58× 10⁻³ 358.9 0.114 6.68 0.17 64.14 1.81 0.69 1.37× 10⁻² 0.17 4.48× 10⁻³ 358.3 0.129 4.10 0.07 38.19 0.79 0.38 4.36× 10⁻³ 0.10 2.06× 10⁻³ 358.2 0.130 4.67 0.09 43.33 0.98 0.43 6.17× 10⁻³ 0.12 2.56× 10⁻³ 357.8 0.143 4.58 0.09 41.59 1.00 0.39 6.94× 10⁻³ 0.11 2.73× 10⁻³ 357.7 0.146 4.38 0.12 39.91 1.18 0.41 9.32× 10⁻³ 0.12 3.36× 10⁻³ 353.9 0.392 1.55 0.15 12.01 1.16 0.11 1.14× 10⁻² 0.07 7.24× 10⁻³ 353.9 0.401 1.40 0.07 10.93 0.53 0.12 4.88× 10⁻³ 0.08 3.24× 10⁻³ 352.3 0.624 1.11 0.02 8.08 0.20 0.08 1.41× 10⁻³ 0.07 1.20× 10⁻³ 352.3 0.626 1.18 0.04 8.54 0.31 0.08 2.64× 10⁻³ 0.07 2.29× 10⁻³
aT is the equilibrium temperature of the vapor and liquid phases. x
Etis the mole fraction of ethanol in the liquid phase at equilibrium. Ucis the combined expanded uncertainty (95% level of confidence, k = 2). Notation: exp, experimental value (directly or indirectly measured with in an instrument); calc, calculated value (analytical estimation from experimental values).
Figure 4.Evolution of (a) absolute (KEL) and (b) relative volatilities (αEL/Et) of ethyl lactate at 101.3 kPa as a function of ethanol composition (xEtmole fraction) in the liquid phase: (○) experimental data, (black solid line) NRTL model, (blue short dash) UNIQUAC model, (red long dash) UNIQUAC model with literature interaction parameters,fitted to binary data.35,37T is the corresponding equilibrium temperature.
• The interaction parameters of the binary ethanol (2)− water (3) are fixed to the values presented in the literature50 and reported in Table 7. In this case, the temperature dependency is considered (AijT ≠ 0) as this
major binary governs the thermal equilibrium of the ternary system. As previously stated, the reliability of the interaction parameters was verified by fitting different experimental data sets.44,51−53 The deviations of the temperature and vapor mole fractions calculated with NRTL and UNIQUAC models are also reported inTable 7. According to this information, the experimental data from the literature are well correlated by both models, with average relative deviations of 0.2% for temperature and lower than 1.3% for ethanol mole fractions in the vapor phase. A detailed procedure to assess the thermodynamic consistency of the reference data is presented inAppendix
1.
In this way, the model identification for the ternary system is reduced to the regression of four parameters:
• two associated with the binary ethyl lactate (1)−ethanol (2): A120, A
21 0.
• two associated with the binary ethyl lactate (1)−water (3): A130, A
31 0.
The parameters were fitted by minimizing an objective function with the generalized reduced gradient method.64The regressed properties were KELandαEL/Et. These parameters will be considered for the simulation of distillation units, in which the separation performance is directly based upon the difference of volatilities between the chemical species.
Two objective functions were evaluated:
∑
α = α −α = w OF( ) ( ) i N i i i 1EL/Et Exp EL/Et Model2
(9)
∑
= − = K w K K OF( ) ( ) i N i i i 1 EL Exp EL Model 2 (10)where N is the number of data and wi is a weighting factor
depending on the uncertainty of the experimental data (αEL/Et
i Exp, KEL i Exp). An experimental value having a high standard
uncertainty is supposed to be less reliable and has therefore a lower weighting factor than an experimental value with a low uncertainty.
The weighting factors were normalized (∑wi = 1) and calculated as = ∑= w U i U i 1/ ( ) 1/ ( ) i i N c 1 c (11)
where Ucis the estimated expanded combined uncertainty for each experimental value.
The calculation of equilibrium properties (αEL/Et i Model, KEL i Model) was carried out using the bubble temperature
algorithm of the Simulis Thermodynamics package, at the experimental pressure (P) and composition in the liquid phase (x). The algorithms allow computation of the saturated temperature (T), and the composition of the vapor phase (y) in equilibrium.
Thefitting quality was judged with respect to four variables (E): T, yEt, and yEL, KEL, and αEL/Et. Two deviations were calculated:
• Average absolute relative deviation (AAD%):
∑
= − = N E E E AAD% 1 100 i N i i i 1 Exp Model Exp (12)• Root-mean-squared deviation (RMSE):
∑
= − = ⎡ ⎣ ⎢ ⎢ ⎤ ⎦ ⎥ ⎥ N E E RMSE 1 ( ) i N i i 1 Exp Model 2 1/2 (13)The results obtained are summarized inTable 8. The evaluation of the thermodynamic consistency of the experimental data set reported in this work is complicated as one of the species is present at very low concentrations. No specific consistency tests have been reported in the literature for this type of system. The area test proposed by Kurihara et al.65cannot be used as the ethyl lactate does not cover the entire composition range. Therefore, only the point-to-point test, developed by Van Ness et al.66was considered for validation. This test should be regarded as a modeling capability test, which shows how the NRTL and UNIQUAC model can accurately reproduce the experimental data. After completion of the model identification, the approved criteria applied in this work are the AAD% values of yEL, KEL, and
αEL/Et. To pass the test the values of those criteria must be less
than a selected tolerance,fixed at 10% by Faundez et al.67As a result, comparing the statistics reported in Table 8, one can conclude that for both models, only the regressions based on OF(αEL/Et) are consistent.
To complete the consistency test, the absolute (Δ) and relative (AD%) residuals of the equilibrium variables are plotted
inFigure 5 as a function of the ethanol mole fraction xEt. As
suggested by Van Ness et al.66the data set passes the test if the residuals show a rather random distribution about the zero line with low deviations. In this case, even though it is difficult to define whether the scatter distribution is actually random due to a limited number of points, the point-to-point consistency of the experimental data can be validated as the residuals do not follow any tendency or correlation with the liquid phase composition. The residual values are not negligible but they remain acceptable if one considers the difficulty to quantify with high accuracy the composition of ethyl lactate highly diluted.
Table 7. Interaction Parameters for the Binary Ethanol (2)− Water (3) and Fitting Quality Statistics with Respect to Five Experimental Data Sets Obtained from Literaturea
T/K yEt
model A230/cal·mol−1 A″320 /cal·mol−1 A230/cal·mol‑1·K−1 A32T/cal·mol−1·K−1 AAD% RMSE AAD% RMSE
NRTLb 34.02 850.12 −1.8 5.65 0.2 0.3 1.24 0.01
UNIQUACc 1448.61 −1504.21 −3.68 4.96 0.2 0.3 1.27 0.01
aThese parameters arefixed for the correlation of equilibrium data of the ternary system ethyl lactate highly dilutedethanolwater.bKadir.50
cDelgado et al.37Notation: T, equilibrium temperature; y
Et, ethanol mole fraction in the vapor phase; AAD%, average absolute deviation; RMSE, root-mean-squared deviation.
In this way, using the interaction parameters derived from OF(αEL/Et), the obtained evolution of KEL and αEL/Et as a
function of ethanol composition is shown in Figure 4. Both models correlate correctly the experimental data. A very slight difference is noted only at high ethanol concentrations, from xEt
= 0.6.
Comparison with Literature Data. Concerning the informa-tion from the literature, the interacinforma-tion parameters for ethyl lactate−ethanol and ethyl lactate−water pairs have been reported for the UNIQUAC model by Peña-Tejedor et al35 and Delgado et al.37The values are presented inTable 9. They were estimated from isobaric experimental data of the corresponding binary systems, in which ethyl lactate is present over the entire composition range, from xEL= (0 to 1).
The volatility curves of ethyl lactate as a function of ethanol composition, calculated with these latter parameters, are shown
inFigure 4. The values of RMSE and AAD% for the different
equilibrium values are summarized inTable 9. One can observe that the representation of the experimental data for the ternary system is globally acceptable, but the evolution ofαEL/Etwith
respect to ethanol composition exhibits some non-negligible differences: the volatility is underestimated at low ethanol concentrations (xEt ≤ 0.1), with an average error of 16%, and
overestimated from xEt= 0.1, with a mean error of about 29%. As
a result, for simulation purposes in alcoholic beverages distillation, where relative volatility is the key parameter of separation, the interaction parameters proposed in this work
(Table 8) are recommended.
Evolution ofγEL∞and/ELwith Temperature and Ethanol
Composition. The evolution of the activity coefficient of ethyl lactate,γEL∞, as a function of temperature and ethanol composition is shown inFigure 6. The activity coefficient is always higher than unity. In this case, the positive deviation from ideality (γEL∞ > 1) means that the interactions forces between the solvent molecules and the ethyl lactate molecules are unfavorable, especially with water. It is observed that γEL∞ increases as the equilibrium
temperature is increased and decreases when the liquid phase is enriched in ethanol. Both trends are linked since the activity coefficient is determined along the ethanol−water vapor−liquid equilibrium curve. The increase of γEL∞ indicates that the interaction forces between the ethyl lactate molecules are reduced, which leads to an increase of its partial pressure and therefore of its volatility. This behavior is logical since the volatility of ethyl lactate is higher in the low ethanol concentration region, where equilibrium temperatures are higher.
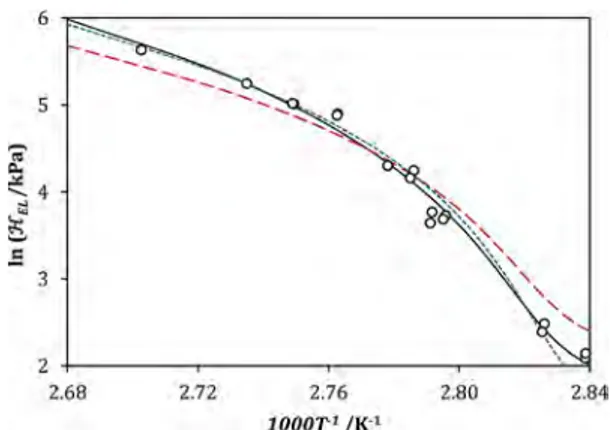
Concerning the Henry constant, the evolution of ln/ELas a function of 1/T (plotted inFigure 7), calculated with the NRTL and UNIQUAC models, exhibits not a linear trend but a concave decreasing behavior. This can be explained by the fact that the temperature and the composition of the liquid phase are not independent at boiling conditions: a change in boiling temper-ature corresponds to a variation in the liquid composition and vice versa. As noted in eq 7, /EL is a function of both temperature and composition, as the solvent is not a pure compound but a mixture of ethanol and water.
■
CONCLUSIONSThe vapor−liquid equilibrium of ethyl lactate highly diluted in ethanol−water mixtures at 101.3 kPa for boiling temperatures from (352.3 to 370.0) K was investigated in this work. The experimental results showed that the volatility of ethyl lactate
Table 8. Binary Interaction Parameters for the Ternary System Ethyl Lactate Highly Diluted (1) − Ethanol (2) − Water (3) and Fitting Quality Statistics a T /K yEt yEL KEL αEL/Et OF binary i− jA ij 0/cal ·mol − 1 Aji 0/cal ·mol − 1 AAD% RMSE AAD% RMSE AAD% RMSE AAD% RMSE AAD% RMSE NRTL Model aEL/Et (1) − (2) 455.52 − 343.55 0.0 0.1 0.34 1.94 × 10 − 3 9.63 1.70 × 10 − 5 9.63 1.00 × 10 − 1 9.59 1.79 × 10 − 2 (1) − (3) − 349.32 2758.14 KEL (1) − (2) 54.97 − 639.44 0.0 0.1 0.34 1.94 × 10 − 3 15.51 1.57 × 10 − 5 15.51 8.43 × 10 − 2 15.49 2.10 × 10 − 2 (1) − (3) 386.75 1969.48 UNIQUAC Model aEL/Et (1) − (2) 458.20 − 213.76 0.0 0.1 0.43 1.72 × 10 − 3 9.09 1.76 × 10 − 5 9.09 1.08 × 10 − 2 8.98 1.76 × 10 − 2 (1) − (3) − 184.94 575.61 KEL (1) − (2) 448.13 − 363.72 0.0 0.1 0.44 1.73 × 10 − 3 14.34 1.61 × 10 − 5 14.34 8.77 × 10 − 2 14.37 2.07 × 10 − 2 (1) − (3) 276.67 117.55 a OF is the objective function used to determine the interaction parameters, T is the equilibrium temperature, yEt is the ethanol mole fraction in the vapor phase, yEL is the ethyl lactate mole fraction in the vapor phase, KEL is the ethyl lactate absolute volatility, αEL/Et is the ethyl lactate relative volatility with respect to ethanol, AAD% is the average absolute deviation, and RMSE is the root-mean-squared deviation.
decreases when the ethanol content in the liquid phase is increased. Ethyl lactate is less volatile than ethanol and its relative volatility is reduced by a factor of four over the entire solvent composition range in the liquid phase. The ternary system exhibits positive deviation from ideality (γi> 1).
Good agreement between the measured data and the NRTL and UNIQUAC models was verified, with overall average relative
deviations between 0.3% and 9.63%. The parameters calculated in this work can be used for simulation purposes in alcoholic beverages distillation, where ethyl lactate is present at low concentrations. Furthermore, the methodology of data acquis-ition and model identification here proposed can be used when dealing with other volatile aroma compounds in hydroalcoholic mixtures.
Figure 5.Plot of absolute (Δ) and relative (AD%) residuals of (a) yEL(ethyl lactate mole fraction in the vapor phase), (b) KEL(ethyl lactate absolute volatility) and (c)αEL/Et(ethyl lactate relative volatility with respect to ethanol) at 101.3 kPa as a function of ethanol composition (xEtmole fraction) in the liquid phase: (○) residuals for the NRTL model, (×) residuals for the UNIQUAC model.
Table 9. Interaction Parameters of UNIQUAC Models for the Binaries Ethyl Lactate (1)−Ethanol (2) and Ethyl Lactate (1)− Water (3) from the Literature. Fitting Quality Statistics of the Equilibrium Data Measured in This Worka
T/K yEt yEL KEL αEL/Et
binary i−j Aij0/cal·mol−1 Aji0/cal·mol−1 AAD% RMSE AAD% RMSE AAD% RMSE AAD% RMSE AAD% RMSE
(1)−(2)b 679.2 −295.4 0.1 0.1 0.44 1.77E× 10−3 23.11 3.15× 10⁻⁵ 23.11 1.92× 10⁻¹ 23.34 3.41× 10⁻²
(1)−(3)c 198.3 128.2
aT is the equilibrium temperature, y
Etis the ethanol mole fraction in the vapor phase, yELis the ethyl lactate mole fraction in the vapor phase, KELis the ethyl lactate absolute volatility,αEL/Etis the ethyl lactate relative volatility with respect to ethanol, AAD% is the average absolute deviation, and RMSE is the root-mean-squared deviation.bPeña-Tejedor et al.35cDelgado et al.37
Figure 6.Evolution of the activity coefficient of ethyl lactate (γEL∞) with respect to (a) equilibrium temperature (T) at 101.3 kPa and (b) ethanol composition in the liquid phase (xEt): (○) experimental data, (black solid line) NRTL model, (blue short dash) UNIQUAC model, (red long dash) UNIQUAC with interaction parametersfitted to binary data.35,37
■
APPENDIX 1Test of Thermodynamic Consistency for Experimental Vapor−liquid Data of Binary Ethanol−water at 101.3 kPa
The thermodynamic consistency of the experimental data used as reference to validate the interaction parameters for the binary ethanol−water was assessed by means of two tests: area test by Kurihara et al.65and point-to-point test proposed by Van Ness et al.66 The aim of these tests is to validate the quality of experimental data and to perform preliminary data reduction.
Area Test. The area test is derived from the integration of the Gibbs−Duhem relation.68At isobaric conditions, the following expression is used:
∫
γγ∫
ε * = × x + x A 100 ln d d W 0 1 Et Et 0 1 Et (A1)ε is a function of the excess enthalpy (HE) and temperature: ε = − ∂ ∂ H RT T x E 2 Et (A2)
The experimental data pass the area test if the value of A* is lower than 3.65 In this work, the arguments of the integral were calculated as follows:
• The activity coefficients γEtandγWwere directly obtained
from equilibrium data by using the fundamental equilibrium relation,eq 2: γ = yP x P T( ) i i i i o (A3)
The vapor pressures were computed witheq 8, using the coefficients gathered inTable 2.
• The excess enthalpy were estimated by means of the empirical correlation proposed by Larkin,69based on the adjustment of several experimental data sets:
∑
= − = HE x (1 x ) a x i m i i Et Et 0 Et (A4)Where HEis given in J·mol−1, i is a non-integral counter
(i = 0, 0.5, 1.5, 2.5, 4.5) and aiare temperature-dependent
coefficients, computed as follows:
= + +
ai bi c Ti d Ti 2 (A5)
The values of bi, ci, and diare reported by Larkin.
69 • The relation between T and xEtwas evaluated by adjusting
the experimental equilibrium data to a polynomial-type correlation with order 6, in the form ofeq A6(n = 6), with a coefficient of determination (R2) higher than 0.99. F
iare
coefficients determined from regression, by minimizing
Figure 7.Representation of Ln/ELwith respect to 1/T at 101.3 kPa:
(○) experimental data, (black solid line) NRTL model, (blue short dash) UNIQUAC model, (red short dash) UNIQUAC model with interaction parameters fitted to binary data.35,37 /EL is the Henry
constant of ethyl lactate and T is the equilibrium temperature.
Figure A1.Plot of the area test for the reference equilibrium data of binary ethanol−water: (a) representation with all the experimental points, without data rejection; (b) representation after data rejection; (c) representation of rejected data, with appreciable deviation from global trend. (◇) Data by Lai et al, 2014.44(□) data by Arce et al, 1996.51(△) data by Yang and Wang, 2002.52(○) data by Kamihama et al, 2012;53() smoothing of the experimental data with a polynomial correlation.
the sum of quadratic errors between the experimental value and the respective calculated value.
∑
= = T Fx i n i i 0 Et (A6)Afirst representation of the integral argument as a function of xEt
is presented inFigure A1a. From this plot, it is possible to identify that several experimental points are slightly shifted from the main decreasing trend, which suggests that they are probably inconsistent. A new plot, presented inFigure A1b, is obtained by rejecting those specific data. The integral is finally calculated by smoothing this set experimental data with a polynomial correlation with order 3 (eq A6with n = 3), ensuring a coefficient of determination (R2) over 0.99. The value of A* obtained in this case is 0.7, which means that the experimental data used as reference in this work pass the area test. Following the same procedure for the set of rejected data, plotted inFigure A1c, the value of A* is 18.3, thus confirming that, in the light of this test, those data are not thermodynamically consistent.
Point-to-Point Test. The point-to-point test proposed by Van Ness et al.66is a modeling capability test, which assesses whether an activity coefficient model can accurately reproduce the experimental data. For isobaric sets, the approving criteria correspond to the average relative deviations (AAD%) of T and yEt. The experimental set passes this test if the AAD% value for T
is lower than 1% and that for yEtdoes not exceed 10%.
67 In this context, according toTable 7, the test is verified for the NRTL (AAD% T = 0.2% and AAD% yEt = 1.24%) and UNIQUAC
models (AAD% T = 0.2% and AAD% yEt = 1.27%), which represent the reference data set with the same high accuracy. The AAD% values were calculated without taking into account the inconsistent data identified in the area test.
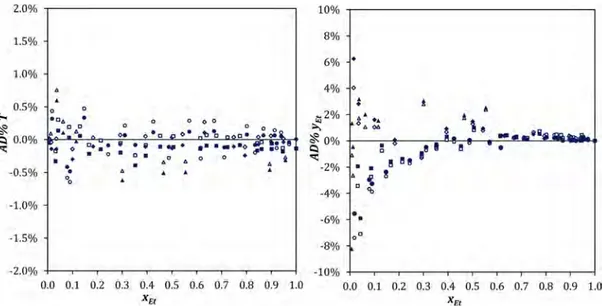
This test is completed with an analysis of the relative residuals (AD%) for T and yEt, presented inFigure A2as a function of xEt. The data set can be considered as consistent since the residuals are randomly scattered about the zero line.68From these residual plots, one can also confirm that the quality of data fitting obtained with both models is equivalent. They are equally
recommended for the estimation of thermodynamic properties of ethanol−water mixtures.
■
ASSOCIATED CONTENT*
S Supporting InformationThe Supporting Information is available free of charge on the
ACS Publications websiteat DOI:10.1021/acs.jced.7b00770.
Computation of combined standard uncertainties (uc) for the equilibrium variables (PDF)
■
AUTHOR INFORMATION Corresponding Author*Tel.: + 33 169 93 50 92. E-mail: martine.decloux@
agroparistech.fr.
ORCID
Cristian Puentes:0000-0001-7126-1193
Patrice Paricaud:0000-0003-4028-7133
Funding
This work was funded by the ABIES Doctoral School (AgroParisTech, Université Paris-Saclay; doctoral contract 2014-7).
Notes
The authors declare no competingfinancial interest.
■
ACKNOWLEDGMENTSThis work was supported by the ABIES Doctoral School (AgroParisTech, Université Paris-Saclay) and was carried out within the framework of the RMT FIDELE (Réseau mixte technologique Produits fermentés et distillés). The authors would also like to thank Elodie Phan (Université Pierre et Marie Curie) and Xuefan Song (AgroParisTech, Université Paris-Saclay) for their technical help in the Labodest experiments. Finally, the authors are grateful to the UNGDA laboratory, particularly to Sydney Cohen, as well as Nicolas Descharles (AgroParisTech, Université Paris-Saclay) for the training provided for the use of the GC-FID instrument.
Figure A2.Plot of relative residual (AD%) for T and yEtas a function of xEt: (◇) Data by Lai et al, 2014;44(□) data by Arce et al, 1996; (△) data by Yang and Wang, 2002;52(○) data by Kamihama et al, 2012.53The empty symbols correspond to the residuals for the NRTL model, and thefilled ones correspond to the residuals for the UNIQUAC model.