HAL Id: hal-00582825
https://hal-mines-paristech.archives-ouvertes.fr/hal-00582825v2
Submitted on 27 Apr 2011A note on Hubbert’s hypotheses and techniques
Pierre-Noël Giraud
To cite this version:
CERNA WORKING PAPER SERIES
A note on Hubbert’s hypotheses and techniques
Pierre-Noël Giraud
Working Paper 2011-03
Cerna, Centre d’économie industrielle MINES ParisTech
60, boulevard Saint Michel 75272 Paris Cedex 06 – France
Tél. : 33 (1) 40 51 90 00 April 2011
A note on Hubbert’s hypotheses and techniques
Pierre-Noël Giraud
Professor of Economics at Mines ParisTech and Paris-Dauphine
Submitted to “Energy Bulletin” 04/04/11
Summary
Many have attempted to forecast the date of the production peak and the volume of the ultimate reserves of a mineral commodity, using techniques derived from Hubbert’s thesis. This note aims at exploring the scientific foundations and therefore the scope of validity of these forecasting techniques. Looking at the basic assumptions of Hubbert’s thesis, it concludes that these techniques should not be used to forecast neither the peak (or plateau) of the annual production rate, nor the ultimate reserves of any mineral, unless given exceptional conditions.
Introduction
It is undeniable that the production rate of any mineral resource will peak and then decrease till the exhaustion of the economically recoverable reserves. Debate rather surrounds the date of this peak, as if the peak is bound to happen in the coming decades, it is time to support and speed up resource substitutions and recycling. The debate about the date of the peak continues to burn concerning oil, most recently phosphate rocks.
Many experts have attempted to forecast the date of the production peak and the volume of the ultimate reserves of a mineral commodity, using techniques derived from Hubbert‟s thesis (see, for example, Peak phosphorus, by Patrick Déry and Bart Anderson, published Aug 13 2007 by Energy Bulletin).
The present note attempts to briefly explore the scientific foundations and therefore the scope of validity of these forecasting techniques.
1. Hubbert’s thesis
Hubbert‟s thesis can be formulated as follows: “The annual production over time of a mineral resource is bound, for purely geological reasons, to follow a bell-shaped symmetrical curve. The annual production therefore reaches a „peak‟ when half of the reserves have been produced, then it declines while the remaining half of reserves, more expensive to exploit, is being depleted”.
Fig. 1: Rate of production/ time for any mineral resource, according to Hubbert
2. Hubbert’s basic assumptions
According to Hubbert‟s papers, and papers by his partisans, the three underlying assumptions of the Hubbert‟s thesis are:
Assumption 1: The curve: (cumulative discoveries) = f (cumulative exploration effort) is a
pure logistic curve. (Fig 2)
Fig. 2: Cumulative discoveries /Cumulative exploration effort: Hubbert‟s assumption
Production rate
Time
Cumulative exploration effort Cumulative discoveries
If these three assumptions are accepted, then Hubbert‟s thesis is logically true. As the exploration effort over time is constant, the above pure logistic curve
(cumulative discoveries) = f ( cumulative exploration effort) can be rewritten as a second pure logistic curve: (cumulative discoveries) = f ( time).
Thus, the rate of discovery is the derivative of this pure logistic curve of cumulative discoveries over time, which is a symmetrical bell curve. As for the rate of production, it is obtained by merely translating the rate of discovery by the constant time-lag between discovery and production, equally a symmetrical bell curve. CQFD.
3. How is the Hubbert’s thesis used?
A pure Hubbert‟s curve is defined by three parameters:
1. The amount of ultimate reserves (the surface below the curve) 2. The date of the peak
3. A shape parameter
The curve can be extrapolated using standard econometric methods, as long as a significant portion of the curve is already known. This is used to forecast the date of the peak.
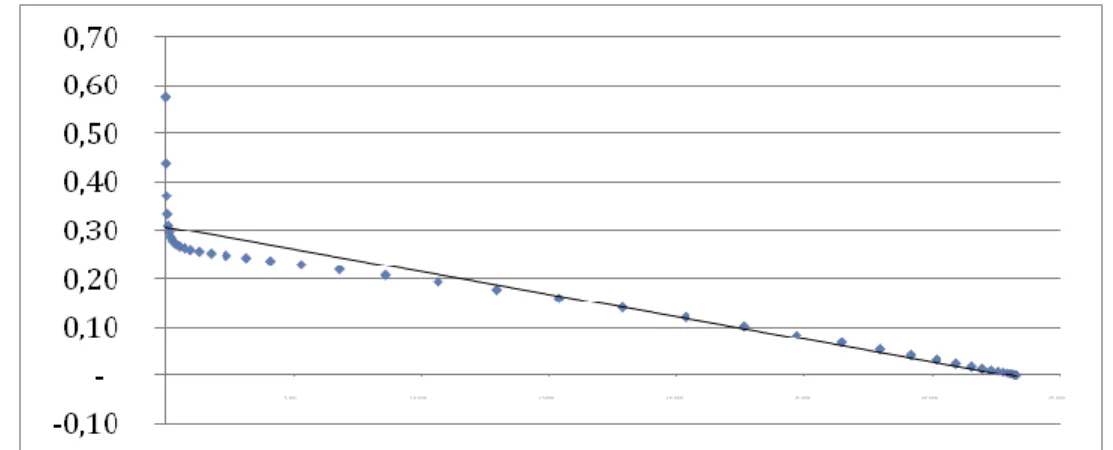
4. A derived technique: « Hubbert’s linearization »
Hubbert‟s linearization is principally used to forecast the amount of ultimate reserves.
This process consists of linearizing the curve: (production/cumulative production) = f
(cumulative production)
Figure 3 presents an example of a Hubbert‟s linearization of a pure Hubbert‟s production profile:
5. A radical criticism
A radical criticism can be made against Hubbert‟s thesis and the derived forecasting techniques: two out of its three base assumptions can be seen as highly unrealistic.
Assumption 1 is purely technico-geological. It remains to be assessed by geologists. Let‟s however accept it as true in the following.
Assumptions 2 and 3 are unrealistic as they ignore the rational behavior of economics agents facing price variations.
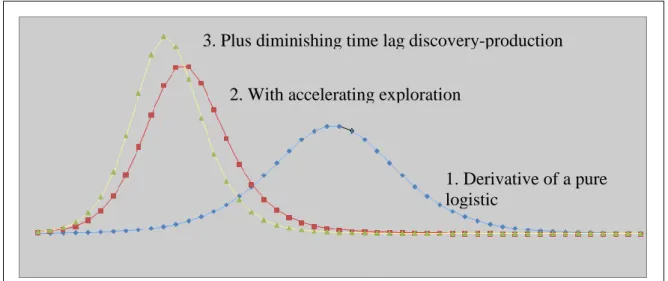
Refusing assumptions 2 and 3, we assume, for example, that an increasing price trend:
Accelerates the pace of exploration: moving from the blue to the red curve in Fig 4.
Reduces the time-lag between discovery and production: moving from the red to the yellow curve.
We are left with dissymmetrical production curves. Further, the timing of the „peak‟ varies widely, depending on the price profile.
Fig 4: Production curves with exploration effort and time-to-production dependent on prices
Hubbert‟s thesis should not, therefore, be used in forecasting except when we approach the end of the economically recoverable reserves... However if that is the case, we no longer really need it….
Above all, it should not be used when cumulative production is below one third of the proven reserves (hence even farther below the ultimate reserve levels), as is the current case for many mineral reserves, with the exception of conventional oil (where we probably are at around 50%).
This simply result from the fact that whatever the method used, one cannot extrapolate a curve when its parameters depend on prices that cannot be forecasted in the very long run…
1. Derivative of a pure logistic
2. With accelerating exploration
The linearization technique, even when applied to a pure Hubbert‟s production curve, gives different results depending on the period of linearization. The following table shows the result of linearization of: the whole of the theoretical pure Hubbert‟s curve; the first 50%; and the first 30% of the curve.
Linearization applied to : Estimative reserves R2
100% of the curve 100 0,88
The first 50% 75 0,40
The first 30% 60 0,32
The shorter the estimation period, the lower the quality of the linearization (R2), and the more reserves are underestimated. Even with a pure Hubbert‟s curve, the results and their quality depends heavily on the period of estimation. Again, the linearization method, like the classical Hubbert‟s forecasting methods, should not be used before close to the end of the resource reserves.
7. Conclusion:
Hubbert‟s thesis and the derived forecasting techniques should not be used to forecast the peak (or plateau) of the annual production rate of a mineral resource, unless it can be proven that neither the exploration efforts nor the time lag between discovery and production are sensitive to price variations. Moreover, Hubbert‟s linearization technique should not be used to forecast the ultimate reserves, unless the peak has already occured.
An intriguing question remains: why then did Hubbert so successfully forecast the peak of production of oil in lower 48 state in the US? The interested reader will find an attempt to answering this question in a working paper by the author: “Hubbert‟s Oil Peak Revisited by a Simulation Model”, Pierre-Noël Giraud, Aline Sutter