Polyphenol Content in Cider Apple
Cindy F. Verdu1,2,3,4*, Sylvain Guyot5, Nicolas Childebrand1,2,3, Muriel Bahut1,2,3, Jean-Marc Celton1,2,3, Sylvain Gaillard1,2,3, Pauline Lasserre-Zuber6, Michela Troggio7, David Guilet4, Franc¸ois Laurens1,2,3 1 INRA, UMR1345 Institut de Recherche en Horticulture et Semences, Beaucouze´, France, 2 Universite´ d’Angers, UMR1345 Institut de Recherche en Horticulture et Semences, SFR 4207 QUASAV, PRES L’UNAM, Angers, France,3 AgroCampus-Ouest, UMR1345 Institut de Recherche en Horticulture et Semences, Angers, France, 4 Universite´ d’Angers, EA921 Laboratoire de Substances d’Origine Naturelle et Analogues Structuraux, SFR 4207 Quasav, PRES L’UNAM, Angers, France, 5 INRA, UR1268 Biopolyme`res, Interactions & Assemblages, Equipe « Polyphe´nols, Re´activite´ & Proce´de´s », Le Rheu, France,6 INRA-UBP, UMR1095 Genetics, Diversity and Ecophysiology of Cereals, Clermont-Ferrand, France,7 Research and Innovation Centre, Fondazione Edmund Mach, S. Michele all’Adige, TN, Italy
Abstract
Polyphenols have favorable antioxidant potential on human health suggesting that their high content is responsible for the beneficial effects of apple consumption. They control the quality of ciders as they predominantly account for astringency, bitterness, color and aroma. In this study, we identified QTLs controlling phenolic compound concentrations and the average polymerization degree of flavanols in a cider apple progeny. Thirty-two compounds belonging to five groups of phenolic compounds were identified and quantified by reversed phase liquid chromatography on both fruit extract and juice, over three years. The average polymerization degree of flavanols was estimated in fruit by phloroglucinolysis coupled to HPLC. Parental maps were built using SSR and SNP markers and used for the QTL analysis. Sixty-nine and 72 QTLs were detected on 14 and 11 linkage groups of the female and male maps, respectively. A majority of the QTLs identified in this study are specific to this population, while others are consistent with previous studies. This study presents for the first time in apple, QTLs for the mean polymerization degree of procyanidins, for which the mechanisms involved remains unknown to this day. Identification of candidate genes underlying major QTLs was then performed in silico and permitted the identification of 18 enzymes of the polyphenol pathway and six transcription factors involved in the apple anthocyanin regulation. New markers were designed from sequences of the most interesting candidate genes in order to confirm their co-localization with underlying QTLs by genetic mapping. Finally, the potential use of these QTLs in breeding programs is discussed.
Citation: Verdu CF, Guyot S, Childebrand N, Bahut M, Celton J-M, et al. (2014) QTL Analysis and Candidate Gene Mapping for the Polyphenol Content in Cider Apple. PLoS ONE 9(10): e107103. doi:10.1371/journal.pone.0107103
Editor: Cameron Peace, Washington State University, United States of America Received January 28, 2014; Accepted August 12, 2014; Published October 1, 2014
Copyright: ß 2014 VERDU et al. This is an open-access article distributed under the terms of the Creative Commons Attribution License, which permits unrestricted use, distribution, and reproduction in any medium, provided the original author and source are credited.
Funding: This work was supported by the SFR 149 ‘Qualite´ et Sante´ du Ve´ge´tal’ through a PhD grant and the transregional INNOVACIDRE project for the consumables and travel expenses. The funders had no role in study design, data collection and analysis, decision to publish, or preparation of the manuscript. Competing Interests: The authors have declared that no competing interests exist.
* Email: [email protected]
Introduction
Apples can be separated in two main classes depending on their use: dessert and cider apples. The latter are generally bitter and astringent, more rustic, and many cider varieties are more resistant to the major pathogens of apple. Phenolic compounds are responsible for bitterness, astringency, color and may also partly contribute to aroma of cider. In relation to their tanning properties, procyanidins form aggregates with salivary proteins for astringency or receptors for bitterness, depending on their polymerization degree [1]. The color is linked to the enzymatic oxidation of phenolic compounds, mainly chlorogenic acid, procyanidins, (+)-catechin and phloridzin, by polyphenoloxydase [2–3]. Some hydroxycinnamic acids are also precursors of volatile phenols responsible for particular cider aroma that may be detrimental to the cider quality [4]. Apple consumption is inversely correlated with the development of diseases such as asthma, diabetes, cancer or cardiovascular diseases (for review see [5–6]). Their high phenolic content and antioxidant potential likely contribute to these protective effects. However, the mechanisms by which these compounds can exert this positive
effect is still unclear (for review see [7]). In addition, interaction with other protective constituents such as dietary fibers plays a major role in the protection against these diseases [8–9].
Due to their importance in human health and their contribution to organoleptic properties, phenolic compounds have been characterized both qualitatively and quantitatively in whole fruit and various processed products like apple juice [10–14]. Globally, cider varieties are richer in total polyphenols than apple dessert varieties, with hydroxycinnamic acids, monomeric flavanols (i.e. catechins) and their oligomers and polymers (i.e. procyanidins and condensed tannins), dihydrochalcones and flavonols as the main phenolic groups.
The polyphenol pathway is well known and several studies have highlighted the major enzymes involved, especially inArabidopsis (Figure 1) [15–20]. However, mechanisms involved in the biosynthesis of procyanidins remain unknown [17]. Transcription factors of this pathway such as MYC [21–22], MYB [23–24], WD40-like protein [25], WRKY, MADS and TFIIIA-like protein (for review see [17]), activated by environmental stresses such as light [26], temperature [27] or wounding [23], have been
identified in many species. So far in apple, three MYB (MdMYB1 [28]/MdMYBA [29]/MdMYB10 [30], MYB110a and MYB110b [31]), two bHLH (MdbHLH3 [32] and MdbHLH33 [30,33]) and one WD40 (MdTTG1) [33] genes have been identified for their involvement in the anthocyanin pathway regulation.
QTL detection is a first step to detect genomic regions involved in phenotypic trait variation. Although widely investigated, phenolic compounds have been the subject of very few genetic studies. Only two studies have been recently published on the genetic basis of phenolic compound content of apple [34–35]. Both studies were performed on dessert apple progenies, separating skin from flesh, with two different approaches to quantify and map phenolic compounds. Chagne´et al. reported the quantification of 16 and 23 phenolic compounds in two different harvest years using an ultra high performance liquid chromatog-raphy (UHPLC) coupled to a UV-PDA detector [34]. Seven clusters on linkage group (LG)1, LG14 and LG15 for p-coumaroylquinic acids, LG9 for anthocyanins, LG16 for flavanols, and LG17 for rutin and 5-caffeoylquinic acid were identified in this study. Khanet al. reported the quantification of 81 phenolic compounds belonging to the two groups of phenylpropanoids and polyphenols in the skin and the flesh, using a high performance
liquid chromatography (HPLC) coupled to a mass spectrometer associated with MSClust software [35]. Five QTL hotspots on LG1 for quercetin and kaempferol glycosides, LG8 for quercitrin, LG13 for isorhamnetin glycosides, LG16 for kaempferol glycosides and flavanols, and LG17 for 5-caffeoylquinic acid were identified. In both studies, the top of LG16 was identified as the region controling the flavanol content variation. A candidate gene study revealed the presence of a leucoanthocyanidin reductase (LAR) gene, involved in flavanol biosynthesis, within the support interval of the LG16 QTLs detected both in flesh and skin [34]. None of these studies have included the mean polymerization degree (DPn) of procyanidins in their analyses.
For the first time in cider apples, this study aims to identify genomic regions controlling phenolic content by a QTL mapping approach. To achieve this goal, 32 phenolic compounds were quantified by liquid chromatography in fruit and juice prepared from a cider apple progeny, during three harvest years [36]. The DPn was also estimated by phloroglucinolyse reaction performed in fruit. For major QTL regions, candidate genes for phenolic content were identifiedin silico from the apple genome sequence, and their co-localizations were confirmed by genetic mapping. Figure 1. Phenolic compounds biosynthesis [15–20] (KEGG, 2012). In bold, enzymes identified in the support interval of QTLs. 4CL: coumarate:CoA ligase; ANR: anthocyanidin reductase; ANS: anthocyanidin synthase; C3’H: p-coumarate 39-hydroxylase; C4H: cinnamate 4-hydroxylase; CHI: chalcone isomerase; CHS: chalcone synthase; D2’GT: dihydrochalcone 2-O-glucosyltransferase; DFR: dihydroflavanol 4-reductase; F3’H: flavonoid 39-hydroxylase; F3’5’H: flavonoid 3’,5’-hydroxylase; FHT: flavanone 3-b-hydroxylase; FLS: flavonol synthase; HCT: shikimate O-hydroxycinnamoyl transferase; HQT: quinate O-O-hydroxycinnamoyl transferase; LAR: leucoanthocyanidin reductase; PAL: phenylalanine ammonia lyase; TAL: tyrosine ammonia lyase; UFGT: UDP-glucose 3-glucosyltransferase.
Material and Methods Plant material
No specific permission from the French regulatory authorities was required for this study. The location of this study is not protected in any way, and the study did not involve endangered or protected species.
Three hundred and eighty-five fruiting trees were analyzed in this study. They were derived from a cross between the two hybrids X5210 and X8402 produced at the Institut National de la Recherche Agronomique (INRA) cider apple breeding program (Figure S1). X5210 was derived from ‘Kermerrien’, a well-known French cider apple variety, while X8402 is a dessert apple hybrid derived from a cross between the varieties ‘Florina’ and ‘Prima’, selected for their resistance against apple pathogens. In the selection process, early selection tests for scab (Venturia inaequalis) and powdery mildew (Podosphaera leucotricha) resistance were performed in greenhouse and nursery respectively. Four hundred and sixty-two trees (29% of the population) remained after removing individuals susceptible to scab and powdery mildew and were planted on their own roots in 2003 in the orchard of the ‘‘Horticulture Experimental Unit’’ at INRA Angers-Nantes, France (47u289390N, 0u369490W).
Fruit extracts (flesh and skin together) were prepared from 92 hybrids harvested in 2008 and 137 harvested in 2009 (later denominated as F08 and F09, respectively). Apple juices (contain-ing both flesh and skin) were prepared from 209 and 120 hybrids harvested in 2009 and 2010, respectively (later denominated as J09 and J10 respectively). All fruits were harvested from the tree at the mature stage corresponding to ‘‘50% of fallen fruits’’, which is an easy visible metric employed in commercial cider orchards. This stage also has the advantage of providing comparable fruit maturity from one year to the next. The effect of light exposure was not recorded but it was minimized by sampling fruit (60 fruits per tree) in different parts of the tree (bottom/top; inside/outside) and by randomizing them before constituting each batch.
Sample preparation and phenolic quantification
The quantification of phenolic compounds in fruit and juice was performed with a liquid chromatography system coupled with a UV-PDA detector and a mass spectrometer analyzer [36]. Compounds such as (+)-catechin, (2)-epicatechin, procyanidins B1 and B2, avicularin, hyperin, quercitrin, 5-caffeoylquinic acid, 4-p-coumaroylquinic acid and phloridzin were quantified each year and in both fruit and juice. Other compounds (procyanidins B5 and C1, 4-caffeoylquinic acid, isoquercitrin, reynoutrin, ideain, rutin and phloretin xyloglucoside) were only quantified in some experiments. Fourteen other compounds were quantified in J10: ten procyanidins, two unknown flavanols named by their molecular weight 245 and 518, the 5-p-coumaroylquinic acid and another phloretin xylohexoside (Table S1).
An acidolysis was performed on fruit extract to depolymerize procyanidins. This reaction allowed us to quantify all procyanidins present in the extract and estimate the mean polymerization degree of flavanols (DPnFlav, including monomers of flavanols) and procyanidins (DPnProc) [36]. The term ‘‘other procyanidins’’ (OP) includes all procyanidins of the extracts except procyanidins B1 and B2 quantified individually in fruit.
DNA extraction and molecular marker genotyping
DNA extractions were performed from leaves using the CTAB extraction protocol as described by Tai and Tanksley [37] with some modifications: the leaves were ground in liquid nitrogen and 400ml of the extraction buffer were added. The buffer was
composed of 60 ml of the buffer A (0.35 M sorbitol, 0.1 M Tris-HCl, 5 mM EDTA), 25 ml of the buffer B (0.2 M Tris-Tris-HCl, 0.05 M EDTA, 2M NaCl, 2% CTAB), 10 ml of sarkosyl and 0.3 g of sodiumdisulfite. After the incubation at 65uC, 400ml of chloroform were used instead of the potassium acetate. The incubation step on ice was removed.
One hundred and fifty three SSR markers available from HiDRAS project [38] and mapped by Silfverberg-Dilworthet al. [39] were amplified as described by Hibrand-Saint Oyant et al. [40] with some modifications: 0.22mM of each primers and 2 ng of genomic DNA were used with the Qiagen multiplex PCR kit (Qiagen, Courtaboeuf, France). PCR amplifications were per-formed under the following conditions: initial denaturation at 94uC for 15 min followed by 34 cycles of 94uC for 30 sec, 55uC for 1 min 30 s, 72uC for 1 min. A final elongation step at 55uC for 15 min was included. PCR products were analyzed on a capillary sequencer 3730xl (Applied Biosystems, Saint Aubin, France) at the GENTYANE platform, INRA station of Clermont-Ferrand.
Three hundred and eighty four SNP markers identified in the ‘Golden Delicious’ genome sequence (Table S2) were genotyped using the Illumina Golden Gate assay at the GENTYANE platform according to the Illumina technology manufacturer’s protocol.
Genetic linkage map construction
Parental genetic linkage maps were built using JoinMap 4 software [41]. A logarithm of the odds (LOD) score threshold of five was used for grouping. Genetic distances between markers were calculated using Kosambi mapping function as described by Liebhardet al. [42].
Statistical and QTL analysis
The broad sense heritability (h2) was calculated as follow: h2= s2g/(s2g+s2r) where s2gand s2rwere the individual genetic
and residual variances respectively.
QTL analysis was performed with the MapQTL 5 software on data obtained from the phenolic compound quantification each year on fruit and juice [43]. The DPn of flavanols and procyanidins estimated in fruit extract were also used in the analysis. Kruskal-Wallis (KW), Interval Mapping (IM) and multiple QTL mapping (MQM) functions were used to identify QTLs. Significance threshold was computed using a 1000 permutation tests, at the 95% genome-wide (GW) LOD thresh-olds. QTLs were described by their LOD score and their proportion of explained phenotypic variation (R2). The support intervals were defined as LOD-1 and LOD-2 around the maximum likelihood of QTL. The normality of residuals after QTL detection was calculated for each QTL [44] using a Shapiro-Francia normality test available in the ‘Nortest’ package of the R software version 3.0.3 [45]. MapChart software version 2.2 was used to represent confidence intervals of the mapped QTLs [46]. Epistatic effects were calculated for each trait for which more than one QTL was detected using a global model including all cofactors with the R software version 3.0.3 as described by Celton et al. [47].
Candidate gene identification
All predicted gene sequences under the support interval of major QTLs were extracted from the apple genome sequence using tools based on the Bio++ libraries [48]. A blastx analysis was performed for each sequence on the non-redundant NCBI database with a minimum Blast Expected Value of 1.1023using the BLAST2GO software version 2.5.0 [49]. The KEGG pathway tool was used to select polyphenolic pathway enzymes [50]. The
six transcription factors identified in apple for their anthocyanin pathway regulation (MdMYB1/MdMYBA/MdMYB10, MYB 110a, MYB110b, MdbHLH3, MdbHLH33, MdTTG1) were also considered as putative candidate genes.
Candidate gene mapping
PCR primers were designed based on contig sequence of the putative candidate genes. SSR were identified with the webstat software (http://wsmartins.net/webstat) and primers were de-signed with Primer3 software version 0.4.0. (http://frodo.wi.mit. edu/) using the same criteria as described by Chagne´et al. [34] except for the final product size that ranged from 100 to 350 bp. Primer sequences are listed in Table 1. The M13 sequence was added at the 59 position to analyze SSR products through a capillary sequencer as described by Hibrand-Saint Oyant et al. [40]. PCR products were analyzed on an ABI 3130xl genetic analyzer using the GeneScan 400HD ROX as size standard (Applied Biosystems, Saint Aubin, France). Electrophoregrams were analyzed with the GeneMapper 4.1 software and candidate genes were mapped to the parental maps using JoinMap 4 software.
Results
Construction of genetic maps
Of the 153 SSR markers tested, 80 (52.3%) and 64 (41.8%) were used, for the female and male linkage map construction, respectively. Of the 384 SNP markers, 170 (44.3%) were monomorphic, 30 (7.8%) did not amplify or were unreadable and 184 (47.9%) were polymorphic (98 abxaa, 57 aaxab, 29 abxab). Among the 184 polymorphic SNP markers, only 54 and 45 were kept for the female and male map construction, respectively. The female map covered 1191.6 cM over 16 LG and the male map covered 1005.3 cM over 17 LG (Figure S2). Only one SNP marker was polymorphic for the female LG7. Distortions were observed on the LG1, LG11 and LG17 of both parental maps.
QTL detection
The individual broad sense heritability was higher for compounds quantified in fruit extract than for those quantified in apple juice (Table 2). Broad sense heritability values ranged from 0.13 to 0.98. Only heritabilities of avicularin and hyperin were less than 0.5 (h2= 0.13 for avicularin in J09 and h2= 0.39 for hyperin in J10).
Sixty nine and 72 QTLs were detected at GW threshold on 14 and 11 LGs of the female and male maps, respectively, for the DPn and all phenolic compounds, except phloretin xylohexoside. Table 3 shows results for both KW and MQM (LOD and R2) analyses, since MQM detection is sufficiently robust with non-normally distributed traits [51]. Results are similar with both parametric and non-parametric tests.
Flavanols and their mean polymerization degree (DPn). Six clusters of QTL were detected on LG3, LG6, LG10, LG12, LG15 and LG16 on the female map (X5210) and four clusters on LG1, LG4, LG7 and LG15 on the male map (X8402) with a proportion of explained phenotypic variation comprised between 6 to 30% (Table 3). Clusters on LG1, LG12 and LG16 were identified for many flavanols detected in both fruit and juice independent of the harvest year. QTLs on LG3, LG4, LG6, LG7, LG10 and LG15 were specifically detected for compounds quantified in juice (Table 3). Epistatic effects were significant between QTLs on LG3 and LG10 and between LG3 and LG12 for the procyanidin B1 quantified in J09. Epistatic
effects were also significant between QTLs on LG1, LG4 and LG15 of the male map of the procyanidin Ca and between QTLs on LG9, LG12 and LG15 of the female map of the procyanidin G (Table 3).
Five QTLs were detected for the DPnFlav and DPnProc estimated in F08 on LG5, LG12, LG14 and LG16 of the female map, explaining between 13 and 24% of the phenotypic variation. Two other QTLs were detected on the male map in F08 on LG1 and LG15, explaining 16% of the phenotypic variation (Table 3). Hydroxycinnamic acid. A QTL was detected for hydro-xycinnamic acids esterified in fourth position (4-caffeoylquinic and 4-p-coumaroylquinic acids) at the top of LG14 on the female map (X5210), explaining between 4 and 46% of the phenotypic variation (Table 3). We identified a QTL for 5-caffeoylquinic acid content for fruit and juice on the LG17 of both parental maps. The proportion of phenotypic variation explained by this QTL varied from 16 to 26% (Table 3). A cluster of QTLs was detected for hydroxycinnamic acids quantified in J10 at the bottom of the LG1 of the male map grouping QTLs for the 4-caffeoylquinic acid, the 4-p-coumaroylquinic acid and the 5-p-coumaroylquinic acid, explaining between 12 and 14% of the phenotypic variation (Table 3).
Flavonols. A major region controlling flavonols concentra-tion was localized at the bottom of the female (X5210) LG15 at the same position as the flavanol cluster detected on the male map (X8402). Seven QTLs were detected for avicularin, hyperin, isoquercitrin and reynoutrin quantified each year in both fruit and juice, with a proportion of explained phenotypic variation comprised between 3 and 20% (Table 3). Another region was detected for quercitrin quantified in F09 and J10 on the LG13 of the female map, with two QTLs explaining 12 and 15% of the phenotypic variation. Significant epistatic effects were found for isoquercitrin quantified in F09 between QTLs detected on LG7 and LG17 and for reynoutrin quantified in F08 between QTLs detected on LG14 and LG16 (Table 3).
Dihydrochalcones. Two clusters of QTLs were detected on the LG1 for phloridzin and on the LG5 for phloridzin and phloretin xyloglucoside on the male map (X8402), and explained between 6 and 19% of the phenotypic variation (Table 3). Single QTLs for phloretin xyloglucoside quantified in F08 and J10 were detected on LG12 of the male map and on LG3 and LG15 of the female map, explaining 21, 17 and 24% of the phenotypic variation respectively.
Anthocyanins. Two QTLs were detected for ideain concen-tration on the LG1 female map (X5210) and on the LG5 male map (X8402), explaining 19 and 12% of the phenotypic variation, respectively (Table 3).
Putative candidate genes identification
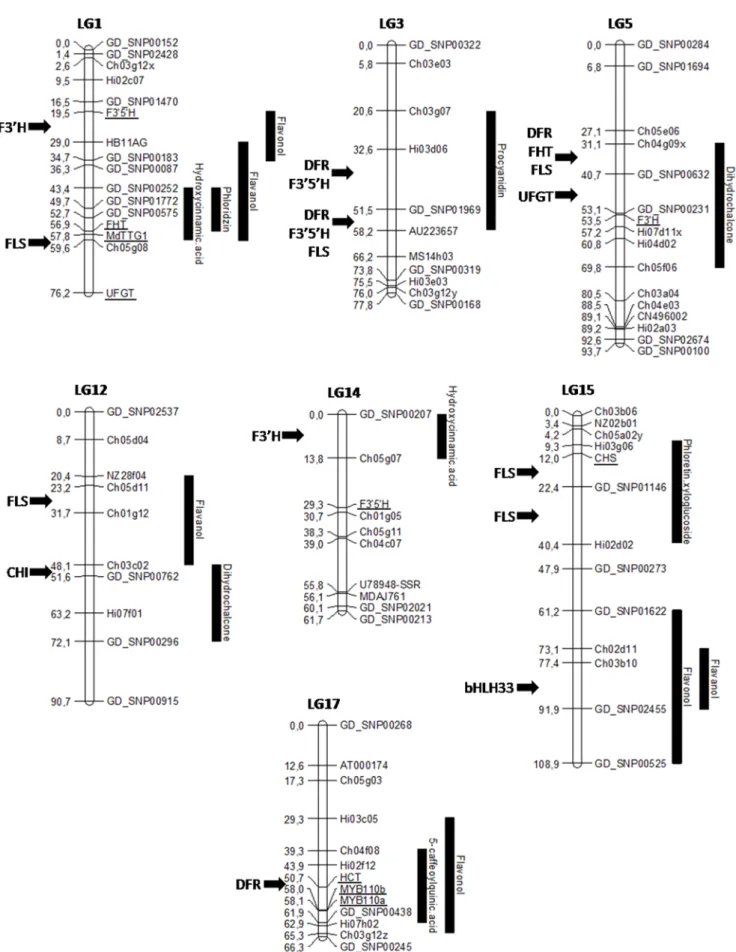
Genomic regions located on LG1, LG3, LG5, LG12, LG14, LG15 and LG17 underlying QTLs for flavanols, dihydrochal-cones, flavonols and hydroxycinnamic acid were selected for candidate gene identification. Concerning the hydroxycinnamic acids pathway, three genes homologous toflavonoid 39-hydroxy-lase (F3’H) and two homologous to flavonoids 3’,5’-hydroxy39-hydroxy-lase (F3’5’H) were identified on LG14. Four genes annotated as shikimate/quinate hydroxycinnamoyltransferase (HCT/HQT) and as dihydroflavanol 4-reductase (DFR) were identified on LG17 (Table 4). The MYB110a and MYB110b genes were also identified within the same interval on LG17. For flavanols, one gene with sequence homology toUDP-glucose 3-glucosyltransfer-ase (UFGT), three genes homologous to flavonoid 39-hydroxyl3-glucosyltransfer-ase (F3’H) and one homologous to flavonols synthase (FLS) were identified on LG1. TheMdTTG1 transcription factor was also
identified within this interval. Four genes annotated asDFR, two F3’5’H and one FLS were found on LG3. On LG12, two FLS were also identified. The bHLH33 transcription factor was localized under the cluster of flavonols on the LG15. OneF3’H and one F3’5’H were identified for flavonols on LG1. For dihydrochalcones, six genes annotated as UFGT, F3’H, FHT, DFR and FLS were identified on LG5, one chalcone isomerase (CHI) was identified on LG12 and one chalcone synthase (CHS) and oneFLS were identified on LG15.
Fifteen pairs of primers were designed to map the candidate genes (Table 1). Eleven amplified and were polymorphic in the X52106X8402 progeny. Of these, eight were mapped at the predicted position. The genes homologous toF3’5’H, FHT and MdTTG1 genes were mapped on LG1, the F3’H apple homologue on LG5, the F3’5’H apple gene homologue on LG14, the gene homologous toCHS on LG15 and the HCT/HQT apple homologues, MYB110a and MYB110b genes on LG17 (Figure 2). Of the three others, one failed to map (FLS), while two
mapped outside of thein silico expected regions (UFGT expected between GD_SNP00252 and Ch05g08, and CHI expected between GD_SNP00762 and Hi07f01).
Discussion
This study was performed with a breeding population designed for the selection of cider apple varieties. The cross of a cider with a dessert apple hybrid has maximized the diversity and could explain the higher number of QTLs detected compared with previous studies. The grandparent ‘Kermerrien’ was selected for its cider quality and the dessert ancestors of the progeny were selected for their resistance to scab and/or powdery mildew and carry some resistance genes e.g.Vf on the LG1 [52] and Pl2 on the LG11 [53], respectively. These genes were transmitted to the progeny and the early selection made for the resistance to both pathogens could explain distortions observed on linkage maps. For the QTL detection, biases caused by distortions were overcome by performing permutation tests to determine a LOD threshold for Table 1. Properties of polymorphic SSR primers developed from ‘Golden Delicious’ genomic sequence for major candidate genes.
Genea
LG Contig Expected size (bp) Primer (59-39) TM (6C)
F3’H* 1 MDC037600.14 155 F: AAGGGTAGGGCTAGAAGACACC 59 R: ATAGATGTCGGCAACGTGAA 58 F3’5’H 1 MDC034541.5 159 F: TGGTCTTGGGTGCAAATCTG 61 R: CCCTTCCCATTGATTCCTTC 60 FHT 1 MDC000829.287 169 F: GCGTGATTGGCTACGTGTAA 59 R: TCGATTCGACTCTCGCACTA 59 MdTTG1 1 MDC001845.293 223 F: AATGAGACGAAATGTCCATCG 59 R: CGGTGTTATCAGTTCACCAAAA 59 UFGT 1 MDC020818.61 249 F: CCAAAACCAAAGCATTCCAA 60 R: GCATATTCGTGTTCTTGAAACC 58 DFR 1* 3 MDC012112.258 177 F: CTAGCCGAGTCAAACCAAGC 59 R: ACTGCTGGTCCGAAAAGAAA 59 FHT/FLS* 5 MDC005520.264 225 F: CCTGAGTCTTGGGCACCTTA 59 R: TTGGCACAAACGAGCAATAG 59 F3’H 5 MDC000463.206 183 F: CACATTGGTGGAGAATGGTG 59 R: GCTTCCGTTCCAGCTAAGATT 59 CHI 12 MDC016452.88 224 F: CCACGGAGGAGTTTCTTGTC 59 R: CATTCGGGTATCCTGCACTT 59 FLS* 12 MDC020724.428 218 F: GTTGGGCTGATGAAACTCGT 59 R: AGTTGAATTTGGGCCTCCAT 60 F3’5’H 14 MDC011050.253 220 F: CACAGAGAATGGATGGGACA 59 R: AACCACCTGCAATCAATCAC 58 CHS 15 MDC009830.388 292 F: TGGAGGACGAAGGAAATACG 59 R: CAACGATGGCGTTCAAAAGT 60 MYB110a 17 MDC013323.290 240 F: CTCTCCCTCATCCCAGAACA 59 R: TGCTGACTCCATTTCTTACTGC 59 MYB110b 17 MDC035405.20 212 F: CTTCGGGCTTATTTGGGTTT 60 R: TTTGCCCCTTCAAAGATCAG 59 HCT/HQT 1 17 MDC015889.298 219 F: CTCCAAATGCAGATGAGGAA 58 R: ATGGTGACTCCTACCGTCCA 60
*: enzymes which could not be mapped.
a
: F3’H: flavonoid 39-hydroxylase; F3’5’H: flavonoids 3’,5’-hydroxylase; FHT: flavanone 3-b-hydroxylase; UFGT: UDP-glucose 3-glucosyltransferase; DFR: dihydroflavanol 4-reductase; FLS: flavonols synthase; CHI: chalcone isomerase; CHS: chalcone synthase; HCT/HQT: shikimate/quinate hydroxycinnamoyltransferase.
each linkage group. Moreover, the selection for scab and powdery mildew resistance did not affect the QTL detection of phenolic compounds except in strongly distorted regions (on LG1, LG11 and LG17). Therefore, it is possible that the pre-selection of seedlings may have reduced the number of QTLs detected in the analysis.
Marker polymorphism and genetic map construction
The proportion of SSR markers polymorphic for X5210 and X8402 (52.3 and 41.8%, respectively) was comparable with previous study [54]. The proportion between monomorphic, not amplified or unreadable, and polymorphic SNP markers was similar to that of Micheletti et al. with a transferability rate of 40.9% between different apple cultivars [55]. Among the 184 polymorphic SNP markers, 48% were kept for the parental map construction, with sizes comparable to reference maps [39,42,54].
New QTL identified and validation from previous studies
Our study reports for the first time on new genetic regions controlling the mean polymerization degree (DPn) of procyanidins in apple. QTLs were detected on the LG12, LG14 and LG16 on the female map and on the LG1 and LG15 on the male map (Table 3). Only those on LG15 and LG16 co-localized with QTLs for the flavanol content, supporting an independent regulation for the flavanol concentration and the flavanol polymerization in apple. The polymerization degree of flavanols is particularly interesting for apple since it modifies organoleptic properties of procyanidins: low DPn (,5) affect the bitterness of apple, while high DPn (6,DPn,10) affect the astringency [1]. Moreover, molecular and genetic mechanisms involved in the synthesis of procyanidins remain unknown [17]. This study is therefore a first
step opening new perspectives to understand mechanisms implied in the polymerization of flavanols.
Moreover, this study has identified many QTLs for flavanols and dihydrochalcones not yet detected in previous studies in dessert apple. Nine main regions were detected for the flavanol content on LG3, LG6, LG10, LG12, LG15 and LG16 of the female map and on LG1, LG4, LG7 and LG15 of the male map. In Chagne´ et al. [34] and Khan et al. [35] studies, the most important QTLs for the flavanol content was detected at the top of the LG16 (above the cluster detected on the female map), where a gene homologous to leucoanthocyanidin reductase (LAR) was identified in the support interval. This region was not detected in our study. We suppose that the parents of our population were homozygous for this QTL, which may explain the fact that we did not identify it during the QTL analysis. Since no marker distortion was observed at the top of this LG, we can affirm that the important selection performed on the population is not responsible for the absence of this QTL. For dihydrochalcones, several QTLs were detected in the X52106X8402 progeny on LG1, LG3, LG5, LG12 and LG15. In previous works, only two QTLs were identified by Khan et al. for phloridzin quantified in skin (on LG16) and flesh (on LG15) [35].
The comparison with previous works published by Chagne´et al. [34] and Khanet al. [35] has also shown two stable and conserved regions across studies for the p-coumaroylquinic and 4-caffeoylquinic acids on LG14 and the 5-4-caffeoylquinic acid on LG17. For the QTLs on LG17, the proportion of explained phenotypic variation was particularly high in all three surveys (19% in Khanet al. study, from 10 to 46% in Chagne´ et al. study, and from 16 and 27% in our study).
To recap, this study has identified 23 new regions for the DPn, flavanols, flavonols, dihydrochalcones and anthocyanins content and confirmed five regions, three for hydroxycinnamic acids on Table 2. Broad sense genetic heritability of mean polymerization degree and phenolic compounds quantified in fruits harvested in 2008 (F08) and 2009 (F09) and in juices prepared in 2009 (J09) and 2010 (J10).
Heritability F08b F09b J09b J10b (2)-epicatechin 0.96 0.94 0.80 0.61 (+)-catechin 0.97 0.77 0.79 0.79 procyanidin B1 0.98 0.96 0.78 0.79 procyanidin B2 0.95 0.89 0.84 0.93 other procyanidins 0.96 0.92 na na DPn flavanolsa 0.89 0.96 na na 5-caffeoylquinic acid 0.92 0.95 0.87 0.77 4-caffeoylquinic acid na na 0.80 0.87 4-p-coumaroylquinic acid 0.96 0.93 0.88 0.80 avicularin 0.58 0.57 0.13 0.59 hyperin 0.60 0.62 0.57 0.39 isoquercitrin 0.80 0.65 na na quercitrin 0.88 0.74 0.70 0.68 reynoutrin 0.71 0.68 na na rutin 0.72 na 0.52 0.56 phloridzin 0.90 0.89 0.83 0.79 phloretin xyloglucoside 0.88 0.92 na 0.75 ideain na 0.77 na na a
: DPn: mean polymerization degree.
b
: na: not available.
Table 3. Quantitative trait loci (QTL) detected in the apple X5210 and X8402 parental genetic maps by multiple QTL mapping (MQM) analysis and Kruskal-Wallis (KW) test for phenolic compounds and the mean polymerization degree of flavanols estimated in fruits harvested in 2008 and 2009 and in juices prepared in 2009 and 20 10. Compound Material Year Parent Linkage group LOD score a % variation b Marker with highest LOD Residuals normality c Epistatic effects d KW Marker with highest KW FLAVANOL MONOMERS Catechin Juice 2009 X5210 12 5.27 10.8 GD_SNP02857 , 0.01 7 Juice 2009 X8402 1 2 .83 6 .3 GD_SNP00087 , 0.01 -4 Juice 2009 X8402 15 3 7 .4 Hi02d02 7 Juice 2010 X5210 3 2 .66 8 .6 GD_SNP01990 , 0.01 -2 Juice 2010 X5210 10 3.01 10 Ch02a08 4 Juice 2010 X5210 17 3.22 11.8 H i02f12 2 Juice 2010 X8402 4 1 .92 6 .4 NZ05g08 , 0.01 -4 Juice 2010 X8402 15 6.12 20.3 Ch02d11 7 Epicatechin Fruit 2009 X5210 12 3.72 9.5 GD_SNP02857 , 0.01 6 Juice 2009 X5210 6 4 .19 8 .9 Ch03d07 , 0.01 6 Juice 2009 X8402 1 4 .39 8 .6 GD_SNP01678 , 0.01 -6 Juice 2009 X8402 12 5.01 10.8 Ch01g12 7 Juice 2009 X8402 14 3.47 7 Ch01g05 4 Juice 2010 X5210 15 2.9 9 .8 Hi03g06 0 .08 -4 Juice 2010 X5210 16 2.86 10.5 Ch05c06 5 GD_SNP00923 Juice 2010 X8402 1 4 .28 19.4 GD_SNP00087 0 .1 6 PROCYANIDINS Procyanidin B1 Fruit 2008 X8402 1 3 .24 15.3 GD_SNP01678 0 .04 6 Fruit 2009 X5210 12 5.6 16.5 GD_SNP02857 0 .07 -7 Ch05d11 Fruit 2009 X5210 16 2.79 8.9 Ch05c06 3 Fruit 2009 X8402 17 4.08 12 Hi02f12 , 0.01 4 A T000174 Juice 2009 X5210 3 3 .34 5 .8 MS14h03 , 0.01 * MS14h03:SNP02857 *** MS14h03:Ch02a08 5 Juice 2009 X5210 6 3 .45 5 .8 Ch03d07 2 Juice 2009 X5210 10 2.5 4 .3 Ch02a08 4 Juice 2009 X5210 12 6.88 12.2 GD_SNP02857 7 Juice 2009 X8402 1 3 .42 7 .2 GD_SNP00087 , 0.01 -6 Juice 2009 X8402 15 2.84 7.5 H i02d02 7 Juice 2010 X5210 16 3.17 10.2 GD_SNP00626 , 0.01 2 Juice 2010 X8402 1 4 .09 12.6 GD_SNP01678 , 0.01 -7 Juice 2010 X8402 4 3 .11 8 .8 NZ05g08 4 Juice 2010 X8402 15 3.27 9.1 Ch03b10 7 Procyanidin B2 Fruit 2008 X5210 1 3 .53 19.1 HB11AG 0.76 4
Table 3. Cont. Compound Material Year Parent Linkage group LOD score a % variation b Marker with highest LOD Residuals normality c Epistatic effects d KW Marker with highest KW Fruit 2009 X5210 1 4 .42 16.7 GD_SNP01772 , 0.01 7 HB11AG Fruit 2009 X8402 1 3 .07 11.1 GD_SNP01678 , 0.01 6 Ch05g08 Juice 2009 X5210 3 5 .4 10.4 H i03d06 , 0.01 7 Juice 2009 X8402 1 7 .32 15.7 GD_SNP01678 , 0.01 -7 Juice 2009 X8402 15 2.93 6.1 Ch02d11 2 Juice 2010 X8402 1 5 .3 19.4 GD_SNP00252 , 0.01 7 Procyanidin B5 Juice 2009 X5210 3 7 .66 15.3 H i03d06 , 0.01 7 Juice 2009 X8402 1 7 .77 15.5 GD_SNP01678 , 0.01 -7 Juice 2009 X8402 7 3 .15 7 .7 Hi05b09 3 Juice 2010 X5210 8 2 .93 10.5 H i04b12 , 0.01 5 Juice 2010 X8402 1 5 .69 20.4 GD_SNP00087 , 0.01 7 Procyanidin C1 Juice 2009 X5210 3 3 .46 6 Hi03d06 , 0.01 -7 Juice 2009 X5210 12 3.98 7.7 Ch01g12 7 Juice 2009 X8402 1 6 .61 13.8 GD_SNP01678 , 0.01 7 Juice 2010 X5210 15 2.95 10.3 Ch05a02y , 0.01 4 Juice 2010 X8402 1 5 .22 2 3 GD_SNP00087 0 .01 7 Procyanidin Ca Juice 2010 X5210 3 2 .68 7 .5 Hi03d06 , 0.01 -2 Juice 2010 X5210 12 2.97 8.3 Ch01g12 4 Juice 2010 X8402 1 2 .52 8 .1 GD_SNP01678 , 0.01 * Ch02d11:NZ05g0 8 7 Juice 2010 X8402 4 3 .3 10.2 NZ05g08 5 Juice 2010 X8402 15 4.35 12.2 Ch02d11 7 Procyanidin Cb Juice 2010 X8402 1 4 .11 13.3 GD_SNP01678 , 0.01 -7 Juice 2010 X8402 15 2.68 9 Ch02d11 7 Ch03b10 Procyanidin Cc Juice 2010 X5210 11 2.74 8.3 GD_SNP00662 , 0.01 4 Juice 2010 X8402 4 3 .06 9 .6 NZ05g08 0 .015 -6 Juice 2010 X8402 15 5.59 18 Ch02d11 7 Procyanidin Cd Juice 2010 X5210 6 3 .89 10.6 Ch03d07 0 .56 -4 Juice 2010 X5210 12 3.43 9.2 Ch01g12 5 Juice 2010 X5210 15 3.04 8.1 H i03g06 4 Juice 2010 X8402 15 3.5 13.1 Ch03b10 0.8 7 Procyanidin Da Juice 2010 X8402 4 2 .98 9 .7 NZ05g08 0 .012 -4 Juice 2010 X8402 15 6.37 17.6 Ch02d11 7 Procyanidin Db Juice 2010 X8402 1 3 .62 15.4 GD_SNP00087 0 .07 6 Procyanidin Ea Juice 2010 X8402 1 4 .37 11.2 GD_SNP01678 0 .16 -7
Table 3. Cont. Compound Material Year Parent Linkage group LOD score a % variation b Marker with highest LOD Residuals normality c Epistatic effects d KW Marker with highest KW Juice 2010 X8402 15 6.71 18.9 Ch02d11 7 Procyanidin Eb Juice 2010 X8402 1 5 .12 21.2 GD_SNP01678 0 .1 6 GD_SNP00252 Procyanidin G Juice 2010 X5210 9 2 .86 7 .3 Ch01f03b 0.02 * Ch01f03b:Hi03g06 2 Juice 2010 X5210 12 3.24 8.4 Ch01g12 4 Juice 2010 X5210 15 3.07 8 H i03g06 4 Other p rocyanidins Fruit 2008 X5210 5 5 .09 22.5 Ch03a04 0 .15 -7 Fruit 2008 X5210 15 3.2 12.9 Ch05a02y 3 Fruit 2008 X8402 1 4 .32 18.8 GD_SNP01678 0 .014 -7 Fruit 2008 X8402 13 4.64 30 NH009b 5 Fruit 2009 X5210 1 3 .64 12.2 Ch05g08 , 0.01 6 Fruit 2009 X8402 1 2 .89 9 Ch05g08 , 0.01 6 Unknown Procyanidin Juice 2010 X8402 1 6 .68 22.7 GD_SNP00087 , 0.01 7 MEAN POLYMERIZATION DEGREE DPn Flavanols Fruit 2008 X5210 5 3 .6 13.8 Ch03a04 0 .81 -3 Fruit 2008 X5210 16 5.51 22.7 Ch05c06 7 Fruit 2008 X8402 15 3.76 16.2 Ch02d11 0 .01 6 DPn Procyanidins Fruit 2008 X5210 12 4.6 20.1 H i07f01 0 .86 -2 Fruit 2008 X5210 14 2.95 12.7 U 78948-SSR 2 Fruit 2008 X5210 16 5.95 23.6 Ch05c06 6 Fruit 2008 X8402 1 3 .12 1 6 HB11AG 0.04 6 UNKNOWN FLAVANOLS Unknown flavanol 245 Juice 2010 X5210 15 3.22 10.4 Ch02d11 , 0.01 3 Juice 2010 X8402 1 4 .72 13.4 GD_SNP00087 , 0.01 -6 Juice 2010 X8402 7 3 .33 10.6 GD_SNP01040 3 Unknown flavanol 518 Juice 2010 X5210 15 3.12 9.5 H i03g06 0.37 4 HYDROXYCINNAMIC ACIDS 4-caffeoylquinic acid Juice 2009 X5210 14 1.82 4 GD_SNP00207 , 0.01 7 Juice 2010 X5210 14 9.27 34.7 Ch05g07 , 0.01 7 Juice 2010 X8402 1 3 .12 12.4 Ch05g08 , 0.01 6 4-p -coumaroylquinic acid Fruit 2008 X5210 14 7.97 31.5 GD_SNP00207 0 .05 7 Fruit 2009 X5210 14 8.71 28.5 GD_SNP00207 , 0.01 7 Juice 2009 X5210 12 3.12 6.1 GD_SNP02857 , 0.01 -2 Juice 2009 X5210 14 9.07 15.9 GD_SNP00207 7 Juice 2009 X8402 15 1.58 4.1 GD_SNP00273 , 0.01 4
Table 3. Cont. Compound Material Year Parent Linkage group LOD score a % variation b Marker with highest LOD Residuals normality c Epistatic effects d KW Marker with highest KW Juice 2010 X5210 14 14.27 46.5 GD_SNP00207 , 0.01 7 Juice 2010 X8402 1 4 .22 13.6 Ch05g08 , 0.01 7 5-caffeoylquinic acid Fruit 2008 X5210 17 5.26 23.2 H i02f12 0 .14 7 Fruit 2008 X8402 17 5.63 23.3 H i02f12 0 .3 7 Fruit 2009 X5210 17 5.61 20.3 H i02f12 , 0.01 7 Fruit 2009 X8402 17 6.15 25.4 H i02f12 0 .2 7 Juice 2009 X5210 3 3 .05 7 .1 GD_SNP01969 0 .03 -6 Juice 2009 X5210 17 7.62 16.4 H i02f12 7 Juice 2009 X8402 17 11.64 26.8 H i02f12 0 .4 7 Juice 2010 X5210 17 6.84 25.7 H i02f12 0 .02 7 Juice 2010 X8402 17 6.07 19 Hi02f12 , 0.01 7 5-p -coumaroylquinic acid Juice 2010 X5210 17 3.02 12.3 H i02f12 , 0.01 6 Juice 2010 X8402 1 3 .72 11.9 Ch05g08 , 0.01 7 FLAVONOLS Avicularin Fruit 2008 X5210 15 3.8 19.1 Ch02d11 0 .38 6 Juice 2009 X5210 5 3 .12 6 .4 Ch05gf06 , 0.01 4 Hyperin Fruit 2008 X5210 15 4.32 20 Ch02d11 0 .02 4 Juice 2009 X5210 15 3.19 6.7 Ch03b10 , 0.01 4 Juice 2009 X8402 16 3.26 8.5 Ch02d10a , 0.01 5 Juice 2010 X5210 15 3.17 14 Ch02d11 , 0.01 4 Isoquercitrin Fruit 2008 X5210 15 2.76 17.8 Ch02d11 , 0.01 3 Fruit 2009 X8402 5 2 .6 11.8 Ch05f06 , 0.01 * (GD_SNP00256:Hi02 f12) 2 Fruit 2009 X8402 7 3 .36 15.3 GD_SNP00256 5 Fruit 2009 X8402 17 3.22 11.8 H i02f12 4 Quercitrin Fruit 2009 X5210 13 3.35 12.1 H i04f09 , 0.01 7 Fruit 2009 X8402 17 3.13 12 Hi03c05 0 .02 6 Juice 2009 X8402 10 3.12 6.3 Ch02c11 , 0.01 2 Juice 2010 X5210 13 4.03 15.1 H i04f09 , 0.01 6 Juice 2010 X8402 1 5 .1 19.2 GD_SNP00087 , 0.01 7 Reynoutrin Fruit 2008 X5210 15 3.6 17.3 Ch02d11 0 .08 4 Fruit 2008 X8402 14 3.55 26 Ch01g05 0 .07 ** 2 Fruit 2008 X8402 16 2.93 11.9 Ch05a04 3 Fruit 2009 X5210 15 4.1 15.6 Ch02d11 , 0.01 7 Fruit 2009 X8402 1 3 .14 13.4 H i02c07 , 0.01 5
Table 3. Cont. Compound Material Year Parent Linkage group LOD score a % variation b Marker with highest LOD Residuals normality c Epistatic effects d KW Marker with highest KW Rutin Fruit 2008 X8402 17 2.67 15 Ch04f08 , 0.01 5 Juice 2009 X5210 8 2 .75 5 .7 Ch01c06 , 0.01 2 Ch01f09 DIHYDROCHALCONES Phloretin xyloglucoside Fruit 2008 X8402 5 2 .7 19.5 GD_SNP00231 0 .16 -3 Fruit 2008 X8402 12 3.73 21.2 GD_SNP00762 6 Fruit 2009 X8402 5 5 .04 17.3 GD_SNP00632 , 0.01 7 Juice 2010 X5210 3 5 .14 17.4 GD_SNP01969 0 .04 -4 AU223657 Juice 2010 X5210 15 6.87 23.6 GD_SNP01146 6 Ch05a02y Phloridzin Fruit 2008 X8402 1 3 .07 11.6 Ch05g08 , 0.01 7 Juice 2009 X8402 5 2 .67 6 .4 GD_SNP00632 , 0.01 4 Juice 2010 X8402 1 3 .49 11.3 GD_SNP01678 , 0.01 5 Ch05g08 ANTHOCYANINS Ideain Fruit 2009 X5210 1 3 .36 19.2 HB11AG , 0.01 4 Fruit 2009 X8402 5 2 .36 12.4 GD_SNP00189 , 0.01 4 Ch05e06 a: M aximum logarithm o f the odds (LOD) scores value o f the QTL. b: P roportion o f the phenotypic variation explained by the Q TL. c: results of the S hapiro-Francia normality test calculated with the residuals obtained after QTL d etection. d: *, P = 0 .1; **, P = 0.05; ***, P = 0.01. doi:10.1371/journal.pone. 0 107103.t003
Table 4. Selected candidate genes identified in the interval of 12 clusters of quantitative trait loci (QTL) using the BLAST2GO software. Phenolic group LG Top marker Down marker Number of sequences Putative gene functions a MDP b Length (bp) c # hits d Min e.Value e sim. Mean (%) f Hydroxycinnamic acid 14 GD_SNP00207 Ch05g07 1 066 F 3’H MDP0000261732 714 2 0 4.10e 2 73 82.85 MDP0000443803 177 2 0 7.10e 2 14 86.25 MDP0000848416 381 2 0 2.40e 2 43 89.55 F3’5’H MDP0000285273 1590 20 0 77.5 MDP0000308262 1770 20 0 77.05 17 Ch04f08 H i07h02 1438 HCT/HQT MDP0000153269 197 2 0 1.5e 2 12 82.25 MDP0000261618 348 2 0 6.5e 2 26 72.5 MDP0000307780 1538 20 0 89.35 MDP0000371737 1326 20 0 83.2 DFR MDP0000648997 1515 20 4.80e 2 127 78.9 MYB110a MDP0000295218 GenBank accession number E B710109 MYB110b MDP0000317257 GenBank accession number CN993940 Flavanols 1 GD_SNP00183 Ch05g08 2 501 U FGT MDP0000478252 1452 20 0 79.4 MdTTG1 G enBank accession number GU173813 F3’H MDP0000214162 999 2 0 1.5e 2 178 81.15 MDP0000416305 1026 20 0 84.75 MDP0000657536 453 2 0 3.7e 2 84 87.35 FLS MDP0000155229 990 2 0 1.5e 2 142 64.9 3 H i03d06 GD_SNP01969 2000 DFR MDP0000204525 1572 20 0 92.15 MDP0000265073 1626 20 0 92.3 MDP0000268045 1020 20 0 9 2 MDP0000729984 978 2 0 0 92.2 F3’5’H MDP0000630030 1383 20 0 78.05 MDP0000780878 408 2 0 3.4e 2 24 80.15 FLS MDP0000703138 270 2 0 2.7e 2 25 78.4 12 Ch05d11 Ch01g12 9 63 FLS MDP0000390769 270 2 0 2.7e 2 25 78.4 MDP0000041421 1116 20 0 76.65 15 Ch02d11 GD_SNP02455 1021 MdbHLH33 G enBank accession number DQ266451 Dihydrochalcones 5 Ch04g09x GD_SNP00231 1296 UFGT MDP0000708060 369 2 0 1.20e 2 63 83.85 F3’H MDP0000692178 1866 20 0 70.55 FHT MDP0000515855 1089 20 0 65.1 DFR MDP0000414002 921 2 0 4.40e 2 148 77.15 FLS MDP0000222546 1500 20 1.50e 2 29 77.25 MDP0000515855 1089 20 0 65.1
LG1, LG14 and LG17, one for dihydrochalcones on LG15, and one for flavonols on LG17.
Comparison between fruit and juice
QTL detection performed in fruit and juice yielded similar result for all classes of phenolic compounds except for flavonols: there are more QTL detected in fruit than in juice. Previous studies have shown that the phenolic content of cider is greatly dependent on the environmental conditions in which apple trees grow [56–57] and the conditions of fruit storage and pressing [36,58]. In this study, the lowest extractability observed for flavonols [36], mainly explain the higher number of QTLs detected in fruit than in juice.
For flavanols, the higher number of regions detected in juice is due to the higher number of procyanidins quantified individually in this material.
Putative candidate genes identification
Identification of candidate genes underlying QTLs remains often complicated and time-consuming. Using data from the apple genome sequence, it was possible to screen a first set of candidate genes including enzymes involved in the biosynthesis of phenolic compounds and few transcription factors. This approach, very selective, allowed us to identify several interesting candidates that remain to be validated. Among them, we identified and mapped four genes homologous toshikimate/quinate O-hydroxycinnamoyl transferase (HCT/HQT) under the QTL confidence interval for the 5-caffeoylquinic acid on the LG17. Two of them were assigned with a very high significance by BLAST (min e-value of 0). The presence of a major gene likeHCT/HQT controlling the synthesis of 5-caffeoylquinic acid seemed particularly relevant since this region was detected both in female and male maps, with very high proportion of explained phenotypic variation.HCT/HQT genes were described to catalyze the formation of p-coumaroylquinic acid from the 4-coumaroyl-CoA (Figure 1) [15]. This compound is the precursor of caffeoylquinic acid via the p-coumarate 39-hydroxylase (C3’H). Then, caffeoylquinic acid may be used as a substrate by HCT to form caffeoyl-CoA. Conversely, caffeoyl-CoA can be used by HQT to form caffeoylquinic acid (Figure 1) [20]. Because they are directly related to this compound, and considering the high proportion of variability explained by these QTLs,HCT/HQT genes are very good candidates.
Similarly, a gene homologous to flavonoid 39-hydroxylase (F3’H), responsible for the hydroxylation on the third position of the B ring of flavonols, dihydroflavonols or flavanones, was identified and mapped under the quercetin glycosides cluster on LG1 (Figures 1 and 2). If this enzyme is up-regulated, the formation of quercetin could be favored compared to kaempferol (compound for which QTLs were detected on LG1 in the Khan et al. study [35]). Inversely, if it is down-regulated, the degradation of kaempferol is lower and this class of compounds could be favored compared to quercetin. However,F3’H genes belong to a multigenic family and validation tests are needed to confirm the role of theF3’H gene identified in the confidence interval of this QTL in the biosynthesis of flavonols.
A homologue of UDP-glucose 3-glucosyltransferase (UFGT) gene was identified under QTLs for flavanols on LG1. This gene is described to catalyze the formation of anthocyanidins-3-O-b-D-glucoside from anthocyanidins and UDP-D-glucose (Figures 1 and 2). This colocation with flavanol QTLs may be explained by the competition of this enzyme with anthocyanidin reductase (ANR) for anthocyanidins as a substrate to form either cyanidin glycosides (with UFGT) or flavanol monomers (catechin and epicatechin). Indeed, ectopic expression of apple MdANR genes in tobacco
Table 4. Cont. Phenolic group LG Top marker Down marker Number of sequences Putative gene functions a MDP b Length (bp) c # hits d Min e.Value e sim. Mean (%) f 12 Ch03c02 Hi07f01 1 132 CHI MDP0000252589 732 2 0 1.30e 2 93 88.5 15 Hi03g06 Hi02d02 CHS MDP0000287919 1167 20 0 83.7 FLS MDP0000159118 258 2 0 1.90e 2 15 81.1 Flavonols 1 GD_SNP01470 GD_SNP00183 658 F 3’H MDP0000140803 1611 20 0 80.35 F3’5’H MDP0000675937 2556 20 0 86.85 15 Ch02d11 GD_SNP02455 1021 MdbHLH33 G enBank accession number DQ266451 a: CHI: chalcone isomerase; CHS: chalcone synthase; DFR: dihydroflavanol 4-reductase; F3’H: flavonoid 3 9-hydroxylase; F3’5’H: flavonoids 3’,5’-hydroxylase; F LS: flavonols synthase; HCT/HQT: shikimate/quinate hydroxycinnamoyl transferase; U FGT: UDP-glucose 3-glucosyltransferas e. b: contig containing the gene on the a pple g enome browser. c: longest h its which aligned w ith the sequence. d: numbered o f alignment achieved. e: estimator o f the quality of the alignment. f: average p roportion of sequence similarity. doi:10.1371/journal.pone. 0 107103.t004
Figure 2. Main interesting clusters of quantitative trait loci (QTL) for phenolic compounds in fruit and juice. Main QTL clusters obtained are represented with black bars on the right of the corresponding linkage groups (LG). Putative candidate genes identified in silico and their relative position on the map are specified on the left of the LG. Genetically mapped candidate genes are indicated on the right of the LG and underlined.
increases the procyanidins content and decreases the anthocyanin content in flowers [59]. In the same way, the silencing of anthocyanidin synthase (ANS) in apple has shown a drastic reduction in the anthocyanin content [60]. However, in this last study, the epicatechin content was increased whereas this compound is also dependent of the ANS activity. Authors supposed a residual ANS activity associated with kinetic compe-tition between ANR and UFGT. An alternative biosynthetic pathway to epicatechin from catechin or procyanidins was also suggested [60]. The studies of Hanet al. [59] and Szankowski et al. [60] have also shown a modification in the transcriptional level and/or in the enzymatic activities of almost all structural enzymes of the polyphenolic pathway, as well as the MYB transcription factor in tobacco. These results suggest a complex feedback of biosynthetic enzymes that remains to be clarified to evaluate clearly the impact of each enzyme on the polyphenol pathway.
Transcription factors involved in the regulation of phenolic compounds in apple have been much less studied. A MYB gene located on LG9 (with three alleles MYB1 [28]/MYBA [29]/ MYB10 [30]), two other MYB genes called MYB110a and MYB110b located on LG17 [31], two bHLH (MdbHLH3 on LG11 [32] and MdbHLH33 on LG15 [30,33]) and a WD40 (MdTTG1 on LG1 [33]) transcription factors involved in the anthocyanin pathway have been previously identified. In the present study, the clustering of four of these transcription factors (MdTTG1, bHLH33, MYB110a and MYB110b) with regions grouping many QTLs detected for several phenolic groups (hydroxycinnamic acids and flavanols on LG1, flavanols and flavonols on LG15 and hydroxycinnamic acids and flavonols on LG17) suggests a more extended involvement of these transcrip-tion factors in gene regulatranscrip-tion, not only restricted to anthocyanins pathway (Figure 2).
This candidate gene mapping approach was based on an in silico identification and a genetic mapping of genes potentially involved in the polyphenol pathway and its regulation. Focusing on a limited number of genes, some other possible functions remain to be investigated, like additional transcription factors, small regulatory RNA (miRNA) and other genes which could affect the catalytic activity of enzymes or phenolic compounds transport or stability. However, this study contributed to highlight a large number of candidate genes for most of the major QTLs. It also highlights the complexity of the biosynthesis of these compounds by showing the absence of major expected gene of the biosynthesis under major QTLs like theANR on LG16 and theHCT/HQT on the LG17. Following a fine mapping approach of the QTL of interest, a functional validation can now be undertaken, using sequencing methods, QRT-PCR, and transgen-esis. QTL detection based on the level of expression of these genes (eQTL) would also permit further in depth understanding of the phenolic compounds biosynthesis.
Potential use in marker assisted selection
This study has opened new ways for breeders to select new varieties with specific phenolic compounds affecting the taste of cider. QTLs detected on LG1 for flavanols, LG5 for dihydrochal-cones, LG15 for flavonols and LG16 for DPn show high stability
between years and materials (fruit and juice), with high proportion of explained phenotypic variation. QTLs detected in this study on LG14 and LG17 for hydroxycinnamic acids were also identified in previous studies on dessert apple. Candidate genes identified under these QTLs reinforce their interest for breeding programs.
Conclusion
This study is the first performed on a cider apple progeny, highlighting QTLs responsible for the variability of major phenolic compounds involved in cider organoleptic characteristics as well as the main polymerization degree of procyanidins. These QTLs are the first detected in apple and represent a new step to understand the mechanism of procyanidin biosynthesis, which appears to be independent from the synthesis of flavanols. This study has also confirmed the importance of two regions involved in the biosynthesis of hydroxycinnamic acids on LG14 and LG17. Other important regions were newly detected in this study on LG1, LG5 and LG15 for flavanols, dihydrochalcones and flavonols, respec-tively. Moreover, the identification of candidate genes performed in silico has shown interesting targets for future studies aiming to better understand the biosynthesis of phenolic compounds.
Supporting Information
Figure S1 Ancestors of the progeny studied. (PDF)
Figure S2 Parental genetic maps for X5210 (A) and X8402 (B) built using JoinMap 4.0. software with SSR and SNP markers. (PDF)
Table S1 Summary of phenolic compounds quantified in fruit harvested in 2008 (F08) and 2009 (F09) and in juice prepared in 2009 (J09) and 2010 (J10).
(XLSX)
Table S2 SNP markers identified in the ‘Golden Delicious’ genome sequence.
(XLS)
Acknowledgments
The authors would like to thank Michel Boucourt, Elise Lepautremat and Bernard Petit of the IRHS of INRA Angers-Nantes for their technical assistance in sample harvesting and preparation and the team of the Horticulture Experimental Unit of INRA, Angers-Nantes that took care of the trees. We thank He´le`ne Muranty and Charles-Eric Durel of the IRHS for their precious advice and Charles Poncet and Lydia Jaffrelo from GENTYANE platform of the INRA Clermont-Ferrand (France) for their help with SSR and SNP analyses.
Author Contributions
Conceived and designed the experiments: CFV PLZ DG FL. Performed the experiments: CFV S. Guyot NC MB. Analyzed the data: CFV. Contributed reagents/materials/analysis tools: S. Gaillard MT. Wrote the paper: CFV. Revised the work critically for important intellectual content: JMC FL.
References
1. Lea AGH, Arnold GM (1978) The phenolics of ciders: Bitterness and astringency. Journal of the Science of Food and Agriculture 29: 478–483. 2. Oszmianski J, Lee CY (1990) Enzymic oxidative reaction of catechin and
chlorogenic acid in a model system. Journal of Agricultural and Food Chemistry 38: 1202–1204.
3. Song Y, Yao Y-X, Zhai H, Du Y-P, Chen F, et al. (2007) Polyphenolic compound and the degree of browning in processing apple varieties. Agricultural Sciences in China 6: 607–612.
4. Herrero M, Cuesta I, Garcia LA, Diaz M (1999) Changes in organic acids during malolactic fermentation at different temperatures in yeast-fermented apple juice. Journal of the Institute of Brewing 105: 191–195.
5. Boyer J, Liu RH (2004) Apple phytochemicals and their health benefits. Nutrition Journal 3: 5.
6. Crozier A, Jaganath IB, Clifford MN (2009) Dietary phenolics: chemistry, bioavailability and effects on health. Royal Society of Chemistry 26: 1001–1043. 7. Lotito SB, Frei B (2006) Consumption of flavonoid-rich foods and increased plasma antioxidant capacity in humans: Cause, consequence, or epiphenome-non? Free Radical Biology and Medicine 41: 1727–1746.
8. McDougall GJ, Morrison IM, Stewart D, Hillman JR (1996) Plant cell walls as dietary fibre: range, structure, processing and function. Journal of the Science of Food and Agriculture 70: 133–150.
9. Aprikian O, Duclos V, Guyot S, Besson C, Manach C, et al. (2003) Apple pectin and a polyphenol-rich apple concentrate are more effective together than separately on cecal fermentations and plasma lipids in rats. The Journal of Nutrition 133: 1860–1865.
10. Lu Y, Foo LY (1997) Identification and quantification of major polyphenols in apple pomace. Food Chemistry 59: 187–194.
11. Guyot S, Marnet N, Sanoner P, Drilleau J-F (2003) Variability of the polyphenolic composition of cider apple (Malus domestica) fruits and juices. Journal of Agricultural and Food Chemistry 51: 6240–6247.
12. Tsao R, Yang R, Young J, Zhu H (2003) Polyphenolic profiles in eight apple cultivars using high-performance liquid chromatography (HPLC). Journal of Agricultural and Food Chemistry 51: 6347–6353.
13. Alonso-Salces RM, Guyot S, Herrero C, Berrueta LA, Drilleau J-F, et al. (2004) Chemometric characterisation of Basque and French ciders according to their polyphenolic profiles. Analytical and Bioanalytical Chemistry 379: 464–475. 14. Kahle K, Krauss M, Richling E (2005) Polyphenol profiles of apple juices.
Molecular Nutrition and Food Research 49: 797–806.
15. Hoffmann L, Besseau S, Geoffroy P, Ritzenthaler C, Meyer D, et al. (2004) Silencing of hydroxycinnamoyl-coenzyme A shikimate/quinate hydroxycinna-moyltransferase affects phenylpropanoid biosynthesis. Plant Cell 16: 1446–1465. 16. Winkel BSJ (2006) The biosynthesis of flavonoids. In: Grotewold E, editor. The
Science of Flavonoids. Columbus. pp. 26.
17. He F, Pan Q-H, Shi Y, Duan C-Q (2008) Biosynthesis and genetic regulation of proanthocyanidins in plants. Molecules 13: 2674–2703.
18. Fowler ZL, Koffas MAG (2009) Biosynthesis and biotechnological production of flavanones: current state and perspectives. Applied Microbiology and Biotech-nology 83: 799–808.
19. Gosch C, Halbwirth H, Kuhn J, Miosic S, Stich K (2009) Biosynthesis of phloridzin in apple (Malus domestica Borkh.). Plant Science 176: 223–231. 20. Villegas RJA, Kojima M (1986) Purification and characterization of
hydro-xycinnamoylD-glucose quinate hydroxycinnamoyl transferase in the root of sweet potato,Ipomoea batatas Lam. The Journal of Biological Chemistry 261: 8729–8733.
21. Li H, Flachowsky H, Fischer TC, Hanke M-V, Forkmann G, et al. (2007) Maize Lc transcription factor enhances biosynthesis of anthocyanins, distinct proanthocyanidins and phenylpropanoids in apple (Malus domestica Borkh.). Planta 226: 1243–1254.
22. Hichri I, Heppel SC, Pillet J, Leon C, Czemmel S, et al. (2010) The basic helix-loop-helix transcription factor MYC1 is involved in the regulation of the flavonoid biosynthesis pathway in grapevine. Molecular Plant 3: 509–523. 23. Mellway RD, Tran LT, Prouse MB, Campbell MM, Constabel CP (2009) The
wound-, pathogen-, and ultraviolet B-responsive MYB134 Gene encodes an R2R3 MYB transcription factor that regulates proanthocyanidin synthesis in poplar. Plant Physiology 150: 924–941.
24. Zhang Y, Yan Y-P, Wang Z-Z (2010) The arabidopsis PAP1 transcription factor plays an important role in the enrichment of phenolic acids in Salvia miltiorrhiza. Journal of Agricultural and Food Chemistry 58: 12168–12175. 25. Pang Y, Wenger JP, Saathoff K, Peel GJ, Wen J, et al. (2009) A WD40 repeat
protein fromMedicago truncatula is necessary for tissue-specific anthocyanin and proanthocyanidin biosynthesis but not for trichome development. Plant Physiology 151: 1114–1129.
26. Koyama K, Ikeda H, Poudel PR, Goto-Yamamoto N (2012) Light quality affects flavonoid biosynthesis in young berries of Cabernet Sauvignon grape. Phytochemistry 78: 54–64.
27. Lovdal T, Olsen KM, Slimestad R, Verheul M, Lillo C (2010) Synergetic effects of nitrogen depletion, temperature, and light on the content of phenolic compounds and gene expression in leaves of tomato. Phytochemistry 71: 605– 613.
28. Takos AM, Jaffe FW, Jacob SR, Bogs J, Robinson SP, et al. (2006) Light-induced expression of a MYB gene regulates anthocyanin biosynthesis in red apples. Plant Physiology 142: 1216–1232.
29. Ban Y, Honda C, Hatsuyama Y, Igarashi M, Bessho H, et al. (2007) Isolation and functional analysis of a MYB transcription factor gene that is a key regulator for the development of red coloration in apple skin. Plant Cell Physiology 48: 958–970.
30. Espley RV, Hellens RP, Putterill J, Stevenson DE, Kutty-Amma S, et al. (2007) Red colouration in apple fruit is due to the activity of the MYB transcription factor, MdMYB10. The Plant Journal 49: 414–427.
31. Chagne´ D, Lin-Wang K, Espley RV, Volz RK, How NM, et al. (2013) An ancient duplication of apple MYB transcription factors is responsible for novel red fruit-flesh phenotypes. Plant Physiology 161: 225–239.
32. Xie X-B, Li S, Zhang R-F, Zhao J, Chen Y-C, et al. (2012) The bHLH transcription factor MdbHLH3 promotes anthocyanin 1 accumulation and fruit
colouration in response to low temperature in apples. Plant, Cell and Environment 35: 1884–1897.
33. An X-H, Tian Y, Chen K-Q, Wang X-F, Hao Y-J (2012) The apple WD40 protein MdTTG1 interacts with bHLH but not MYB proteins to regulate anthocyanin accumulation. Journal of Plant Physiology 169: 710–717. 34. Chagne´ D, Krieger C, Rassam M, Sullivan M, Fraser J, et al. (2012) QTL and
candidate gene mapping for polyphenolic composition in apple fruit. BMC Plant Biology 12: 12.
35. Khan SA, Chibon P-Y, de Vos RCH, Schipper BA, Walraven E, et al. (2012) Genetic analysis of metabolites in apple fruits indicates an mQTL hotspot for phenolic compounds on linkage group 16. Journal of Experimental Botany 63: 2895–2908.
36. Verdu CF, Childebrand N, Marnet N, Lebail G, Dupuis F, et al. (2013) Polyphenol variability in the fruits and juices of a cider apple progeny. Journal of the Science of Food and Agriculture 94: 1305–1314.
37. Tai TH, Tanksley SD (1990) A rapid and inexpensive method for isolation of total DNA from dehydrated plant tissue. Plant Molecular Biology Report 8: 297–303.
38. Gianfranceschi L, Soglio V (2004) The european project HiDRAS: Innovative multidisciplinary approaches to breeding high quality disease resistant apples. Acta Horticulturae 663: 327–330.
39. Silfverberg-Dilworth E, Matasci CL, Van de Weg WE, Van Kaauwen MPW, Walser M, et al. (2006) Microsatellite markers spanning the apple (Malus x domestica Borkh.) genome. Tree Genetics and Genomes 2: 202–224. 40. Hibrand-Saint Oyant L, Crespel L, Rajapakse S, Zhang L, Foucher F (2008)
Genetic linkage maps of rose constructed with new microsatellite markers and locating QTL controlling flowering traits. Tree Genetics and Genomes 4: 11–23. 41. Van Ooijen JW (2006) JoinMap 4: software for the calculation of genetic linkage
maps in experimental populations. Wageningen, Netherlands. 63 p. 42. Liebhard R, Koller B, Gianfranceschi L, Gessler C (2003) Creating a saturated
reference map for the apple (Malus x domestica Borkh.) genome. Theoretical and Applied Genetics 106: 1497–1508.
43. Van Ooijen JW (2004) MapQTL 5, software for the mapping of quantitative trait loci in experimental populations.
44. Xu S (1995) A comment on the simple regression method for interval mapping. Genetics 141: 1657–1659.
45. R Development Core Team (2008) R: A language and environment for statistical computing. In: R Fundation for Statistical Computing, editor. Vienna, Austria.
46. Voorrips RE (2002) MapChart: Software for the Graphical Presentation of Linkage Maps and QTLs. The Journal of Heredity 93: 77–78.
47. Celton J-M, Martinez S, Jammes M-J, Bechti A, Salvi S, et al. (2011) Deciphering the genetic determinism of bud phenology in apple progenies: a new insight into chilling and heat requirement effects on flowering dates and positional candidate genes. New Phytologist 192: 378–392.
48. Dutheil J, Gaillard S, Bazin E, Gle´min S, Ranwez V, et al. (2006) Bio++:a set of C++ libraries for sequence analysis, phylogenetics, molecular evolution and population genetics. BMC Bioinformatics 7: 188: 6.
49. Conesa A, Gotz S, Garcia-Gomez JM, Terol J, Talon M, et al. (2005) Blast2GO: a universal tool for annotation, visualization and analysis in functional genomics research. Bioinformatics 21: 3674–3676.
50. Kanehisa M (2000) Post-genome informatics. Database: KEGG: Kyoto Encyclopedia of genes and genomes. Available: http://www.genome.jp/kegg/. Accessed 2012 September.
51. Rebai A (1997) Comparison of methods for regression interval mapping in QTL analysis with non-normal traits. Genetical Research 69: 69–74.
52. Calenge F, Faure A, Goerre M, Gebhardt C, Van de Weg WE, et al. (2004) Quantitative Trait Loci (QTL) Analysis Reveals Both Broad-Spectrum and Isolate-Specific QTL for Scab Resistance in an Apple Progeny Challenged with Eight Isolates of Venturia inaequalis. Genetics and Resistance 94: 370–379. 53. Caffier V, Laurens F (2005) Breakdown ofPl2, a major gene of resistance to
apple powdery mildew, in a French experimental orchard. Plant Pathology 54: 116–124.
54. Celton J-M, Tustin DS, Chagne´ D, Gardiner SE (2009) Construction of a dense genetic linkage map for apple rootstocks using SSRs developed fromMalus ESTs andPyrus genomic sequences. Tree Genetics and Genomes 5: 93–107. 55. Micheletti D, Troggio M, Zharkikh A, Costa F, Malnoy M, et al. (2011) Genetic
diversity of the genusMalus and implications for linkage mapping with SNPs. Tree Genetics and Genomes 7: 857–868.
56. Ubi BE, Honda C, Bessho H, Kondo S, Wada M, et al. (2006) Expression analysis of anthocyanin biosynthetic genes in apple skin: Effect of UV-B and temperature. Plant Science 170: 571–578.
57. Jakopic J, Stampar F, Veberic R (2009) The influence of exposure to light on the phenolic content of ‘Fuji’ apple. Scientia Horticulturae 123: 234–239. 58. MacLean DD, Murr DP, DeEll JR, Horvath CR (2006) Postharvest variation in
apple (Malus x domestica Borkh.) flavonoids following harvest, storage, and 1-MCP treatment. Journal of Agricultural and Food Chemistry 54: 870–878. 59. Han Y, Vimolmangkang S, Soria-Guerra RE, Korban SS (2012) Introduction of
apple ANR genes into tobacco inhibits expression of both CHI and DFR genes in flowers, leading to loss of anthocyanin. Journal of Experimental Botany 63: 2437–2447.
60. Szankowski I, Flachowsky H, Li H, Halbwirth H, Treutter D, et al. (2009) Shift in polyphenol profile and sublethal phenotype caused by silencing of anthocyanidin synthase in apple (Malus sp.). Planta 229: 681–692.
![Figure 1. Phenolic compounds biosynthesis [15–20] (KEGG, 2012). In bold, enzymes identified in the support interval of QTLs](https://thumb-eu.123doks.com/thumbv2/123doknet/6623644.180445/2.918.123.801.94.618/figure-phenolic-compounds-biosynthesis-enzymes-identified-support-interval.webp)