Full Terms & Conditions of access and use can be found at
https://www.tandfonline.com/action/journalInformation?journalCode=taas20
ISSN: 1608-5914 (Print) 1727-9364 (Online) Journal homepage: https://www.tandfonline.com/loi/taas20
Contribution to the knowledge of the
macroinvertebrate fauna of the streams of
Kahuzi-Biega National Park, Democratic Republic of
Congo
MF Ngera, SU Pauls, RW Holzenthal, M Bagalwa, MA Bisimwa, EM
Mushayuma & DR Cammaerts
To cite this article:
MF Ngera, SU Pauls, RW Holzenthal, M Bagalwa, MA Bisimwa, EM
Mushayuma & DR Cammaerts (2019) Contribution to the knowledge of the macroinvertebrate
fauna of the streams of Kahuzi-Biega National Park, Democratic Republic of Congo, African Journal
of Aquatic Science, 44:2, 127-142, DOI: 10.2989/16085914.2019.1598840
To link to this article: https://doi.org/10.2989/16085914.2019.1598840
Published online: 31 Jul 2019.
Submit your article to this journal
Article views: 23
View related articles
ISSN 1608-5914 EISSN 1727-9364
https://doi.org/10.2989/16085914.2019.1598840
African Journal of Aquatic Science is co-published by NISC (Pty) Ltd and Informa UK Limited (trading as Taylor & Francis Group)
Contribution to the knowledge of the macroinvertebrate fauna of the
streams of Kahuzi-Biega National Park, Democratic Republic of Congo
MF Ngera1*‡, SU Pauls2, RW Holzenthal3, M Bagalwa1, MA Bisimwa1, EM Mushayuma1 and DR Cammaerts4 ‡ 1 Centre de Recherche en Sciences Naturelles Lwiro, Bukavu, Democratic Republic of Congo
2 Senckenberg Research Institute and Natural History Museum, Frankfurt am Main, Germany 3 Department of Entomology, University of Minnesota, St Paul, MN, USA
4 Independent researcher, research associate of the CRSN-Lwiro, Democratic Republic of Congo ‡ Both authors contributed equally to the manuscript
*Corresponding author, email: francngera6@gmail.com
The Albertine Rift is one of Africa’s major biodiversity hotspots. However, the aquatic fauna of its western border in Democratic Republic of Congo (DRC) remains understudied and poorly characterised. Kahuzi-Biega National Park (KBNP) in DRC is a crucial link for biodiversity conservation of this hotspot; however, scientific studies of this rich biodiversity are scarce because of insecurity and harsh field conditions. In the current study, benthic macroinvertebrates communities and some environmental conditions were investigated in 10 rivers in the KBNP. Eighty-four morphospecies, belonging to 47 families and 12 orders, were sampled from 13 sites. The abundance and diversity of taxa within systematic groups varied across the study area. Spatial distribution of systematic groups was also analysed. The high morphospecies richness, characterised by the number of families and Shannon’s and Simpson’s Diversity Indices, recorded at some sites was probably owing to the diversity of substratum and undisturbed environmental conditions observed in these forested rivers. Conversely, some sites presented lower species richness, possibly because of unfavourable natural conditions.
Keywords: aquatic insects, aquatic invertebrates, biotic indices, conservation ecology, species diversity indices, water quality
Across the world, many national agencies and non- governmental organizations use aquatic macroinvertebrates as indicators of water quality because of their sensitivity to habitat modifications (Hussain and Pandit 2012) and pollutants (Chutter 1972; Rosenberg and Resh 1993; Dallas 1997; Abel 2002; Duran 2006; Ziglio et al. 2006), and the existence of well-established and cost-effective sampling procedures (Rosenberg and Resh 1993). The use of benthic macroinvertebrates as bioindicators has been developed in many studies of the relationships between benthic macroinvertebrate communities and environmental conditions, mainly in North America, Europe and more recently in South Africa, the Indian subregion and Asia (see Chutter 1972; Dallas 1997, 2005, 2007a, 2007b; Dicken and Graham 2002; Benstead and Pringle 2004; Dallas and Day 2004; Kasangaki et al. 2006; Kasangaki et al. 2008; Lorion and Kennedy 2009; Arthur 2010; Davies et al. 2010; and Hussain and Pandit 2012 for a synthetic review). The aquatic invertebrate fauna in central Africa, however, remains understudied. In this vast area, the Democratic Republic of Congo (DRC) occupies an important space.
For decades, insecurity and a critical lack of funding for Congolese research have prevented researchers from studying and analysing the aquatic invertebrate fauna in the streams and rivers of KBNP, which is located at the eastern border of the country and is recognised as a
major biodiversity hotspot in the African Rift region. A few studies were carried out in rivers surrounding KBNP in the 1950s and 1960s, but these focused on physico-chemical characteristics (Marlier, 1954b) and on Trichoptera (Hydropsychidae) ecology and description (Marlier 1954a, 1961, 1962). Later, Statzner (1975, 1976), Jaquemart and Statzner (1981), and Kopelke (1979, 1981) studied the caddisflies and mayflies of some streams in the area. More recently, studies reported the presence of about 100 morphospecies of macroinvertebrates (Ngera et al. 2009) and two new species of Trichoptera (Pauls et al. 2010) in the rivers and streams of Lake Kivu basin, close to the KBNP border. Within the KBNP zone, some information was collected through the 'Programme Biodiversité des Écosystèmes Aquatiques et terrestres du Rift Albertin' (P-BEATRA 2005), which promoted collaboration between scientific institutions and conservation organizations to increase the biodiversity knowledge of the African Rift region. For instance, Bisimwa et al. (2013) provided a preliminary listing of epilithic algae and Bagalwa et al. (2012) characterised physico-chemical properties of watercourses in KBNP. Information on aquatic macroinvertebrate biodiversity in KBNP, however, remain sparse.
KBNP is currently flagged as 'in danger' by UNESCO on the list of World Heritage Sites (https://whc.unesco.org/fr/ soc/3812 [Accessed 1 February 2019]). The main threats Introduction
to biodiversity include poaching, hunting, habitat conversion and fragmentation, agricultural practices (slash and burn), farms and illegal (and mainly artisanal) mining (https://whc. unesco.org/fr/soc/3812). It is therefore crucial to provide reliable scientific information about the biodiversity of this protected area to support conservation efforts for the natural capital of this region.
The current study provides initial information on the benthic invertebrate diversity of headwaters streams of KBNP and preliminary insights on the environmental conditions of these watercourses.
Materials and methods
Study area
Kahuzi-Biega National Park (KBNP; 1°36′ S to 2°37′ S, 27° 33′ E to 28°46′ E) is a World Heritage Site (see UNESCO website at http://whc.unesco.org/en/list/137) located 20 km west of the city of Bukavu, South-Kivu province, Democratic Republic of Congo (Figure 1). The park is located on the western border of the Albertine Rift. Established in 1937 as a Zoological Forest Reserve of 600 km², KBNP was given the status of National Park in 1970. Its initial area was extended to 6 000 km² by a presidential decree in July 1975 (Mutimanwa 2001; Kasereka 2003; UNEP-WCMC 2009). The shape of the park is complex, comprising two distinct areas that are joined by a 7.4-km wide corridor (Figure 1). KBNP embraces a large variety of ecosystems and hosts a spectacular biodiversity with a high rate of endemism. Mühlenberg et al. (1995) estimated: 194 mammal species, including the eastern lowland gorilla; 349 bird species, 42 of which are endemic, and; at least 1 178 described species of plants in and around the park.
The smaller (600 km²) eastern part of the park is characterised by high altitude mountains (ranging between 1 800 and 3 308 m asl) and is dominated by bamboo forest, primary and secondary mountain forests and swamp forests (Liengola 2008; Bagalwa et al. 2012). The larger (5 400 km²) western part of the park embraces lower mountain rainforests (700 to 1 700 m asl). The soils are of volcanic origin, and two extinct volcanoes, Kahuzi (3 308 m asl) and Biega (2 790 m asl), dominate the park’s topography. In the highlands, mean temperatures vary between 10.4 °C and 18 °C, whereas in the lowlands, they vary between 15 °C and 20 °C. The mean annual rainfall is 1 900 mm, with a short dry season from June to August and a long wet season from September to May (UNEP-WCMC 2009). The rivers and streams of the western area of the park flow into the Luka and Luhoho Rivers, which drain into the Lowa River, a main tributary of Lualaba River in the Congo Basin. The rivers and streams of the eastern area of the park drain into Lake Kivu, a reservoir on the Ruzizi River, which drains towards Lake Tanganyika. Figure 1 shows only the main rivers, because there is a paucity of geodata on rivers and streams of this region, and the dense vegetation cover of KBNP limits the efficient use of satellite imagery to map the rivers.
Aquatic macroinvertebrate sampling
Aquatic macroinvertebrates were sampled at 13 sites located on 10 headwater streams in the KBNP (Table 1).
Samples were collected between July and August in 2008 and 2010 (about two samples per week). Four sites were located on rivers draining eastwards into Lake Kivu: Chanderema (CH), Langa (LNG) and Mushuva (MU_I, MU_II) Rivers. The remaining nine sites were located on rivers flowing westwards into the Congo Basin: Busangizi (BUS), Chumba (CHU), Cinya (CNY_I, CNY_II), Citori (CI), Mirembo (MIR_I, MIR_II), Mugaba (MUG) and Nabugobugo (NBG) Rivers. The sites were selected based on accessibility and a variety of environmental conditions, such as canopy cover, the presence of aquatic and marginal vegetation and the nature of bottom substrate. One of the sites, CNY_II, exhibited characteristics 'typical' of a swamp site, namely slow current, decaying vegetation, trees growing in water and a low pH (Zoltai and Vitt 1995; Mackie 2004). Note that some of the common characteristics of a swamp zone, such as a strong chemical reducing environment (Barnaud and Fustec 2007), were not assessed in this study. The other 12 sites were all flowing water sites.
Macroinvertebrates were sampled using a 30-cm wide D-frame net with a mesh of 500 µm. All available biotopes, such as stones, cobbles, gravel, debris, vegetation, sand, mud, aquatic and marginal vegetation, were sampled vigorously by kicking, turning and scraping using feet and hands. Dislodged macroinvertebrates were collected with the net. In addition, macroinvertebrates were hand-picked from stones and other substrates. As far as possible, in each site, similar sampling efforts were adopted. At each site, 10 minutes were allocated to collect aquatic organisms. To account for the relative coverage of different microhabitats, the total sampling time was divided between them. Accordingly, the time dedicated to sample each microhabitat was proportional to its percentage of coverage at that site. Environmental characteristics for the sampling stations are summarised in Table 2.
All collected organisms preserved in 70% alcohol on site, stored in plastic bottles and taken to the laboratory (CRSN/Lwiro, Lwiro, DRC) for identification. Specimens were sorted, counted and identified to the lowest taxonomic level possible, usually family or genus, and morphospecies where possible (morphospecies are taxa belonging to the same genera, but with different morphology and therefore likely to be different species), using dichotomous keys (Marlier 1962; De Moor et al. 2003a, 2003b; Tachet et al. 2003; Sunderman et al. 2007). Identification of some specimens was confirmed by specialists at Minnesota University, USA, and the Albany Museum, Department of Freshwater Invertebrates, Grahamstown, South Africa.
Water chemistry sampling
Temperature, acidity (pH), conductivity and dissolved oxygen concentrations were recorded at a single point at each site in 2008 and 2010. Nutrient concentrations (nitrate as NO3 and phosphate as PO4) were measured only in 2008. Temperature (T°, expressed in degree Celsius), conductivity (expressed µS cm−1, and related to the total dissolved salts concentration, or TDS) and water acidity (expressed on the pH scale) were measured with a HANNA Combo® multimeter (HI98129). Dissolved oxygen was measured using a HANNA dissolved oxygen
meter (HI91417). Water samples were collected in 2008 and nutrient concentrations were analysed in the CRSN/ Lwiro laboratory by colorimetric methods (see Bagalwa et al. 2012 for materials and methods). Water velocity was measured three times by timing a float as it moved over a 5-m or 10-m length of river (see Davies and Day 1998 for details) and the mean value calculated. Discharge was estimated from the product of current velocity and cross-sectional area of the river. Substrate composition of the river bed was expressed as a percentage of coverage of each category of substrate.
Statistical analysis
For each sampling site, relative abundance (%) was calculated as the number of individuals belonging to a
taxonomic group collected at a site divided by the total number of individuals collected for that site, multiplied by 100. For each sampling site, species richness (following Klemm et al. 1990), the Shannon-Wiener's Diversity Index (H’) (Spellerberg and Fedor 2003) and the Simpson’s Diversity Index (D) were calculated. Data for the two years (2008 and 2010) were pooled, and H’ and D indices were calculated using family level data (Guerold 2000). A diversity t-test (Poole 1974) was used to compare species diversity between sites. No statistical analyses were done on the relative abundance, because of the non-standardised sampling procedure.
A principal component analysis (PCA), based on a variance-covariance matrix, was used to determine which of the measured environmental parameters (temperature,
AFRICA Democratic Republic of the Congo Democratic Republic of the Congo Kahuzi-Biega National Park South-Masisi Reserve Lake Kivu Bukavu Goma 30 km See enlarged area
0 1 2 3 4 5 km
Sampling sites
(See text for code signification) Majors rivers
(All data available is displayed. See text for more details) Kahuzi-Biega National Park (eastern area) MIR II MIR I NBG BUSCHU CI MUG CNY_II CNY_I MU_I MU_II CH LNG In ho ho Luka 28°36′ E 28°39′ E 28°42′ E 28°39′ E 28°42′ E 28°45′ E 2°12′ S 2°15′ S 2°18′ S 2°21′ S 2°15′ S 2°18′ S 2°21′ S Data : RGC projet - UN -DRC, 2014 and Ngera Mwangi François, 2015 SCR : WGS84 Pseudo Mercator (EPSG:3857) Author : David Cammaerts (2017)
pH, conductivity, dissolved oxygen, nitrate, phosphate discharge, as well as water velocity) had the strongest relationship with benthic macroinvertebrate communities collected at each site. All data were log10(x + 1) transformed prior to analysis to achieve normality of the data. The following water parameters were included in this analysis: 2008 and 2010 data for temperature, PH, conductivity and dissolved oxygen and 2008 data for nutrients. An iterative calculation was used to take into account the non-available data. The canopy cover parameter was excluded from this analysis. For each axis the eigenvalues and the percentage of total variance were evaluated.
Cluster analyses, based on Euclidean distance and Simpson’s Diversity Index were used in addition to PCA to evaluate the relationship between environmental parameters and benthic macroinvertebrate communities at the sites. Basic graphical analysis of relative abundance were carried out to provide some insight on the trends in numerical dominance of main taxonomic groups at each site. All calculations and statistical analysis were done using the PAST V2.17 software (https://folk.uio.no/ohammer/past/). Site name
(derived from river name) Site code River origin Watershed Latitude Longitude
Altitude (metres above
sea level)
Chanderema CH Civanga Lac Kivu Basin 2°17′25′′ S 28°43′00′′ E 2 049
Mushuva I MU_I Bugulumiza Lac Kivu Basin 2°17′34′′ S 28°41′54′′ E 2 175
Mushuva II MU_II Bugulumiza Lac Kivu Basin 2°18′12′′ S 28°43′37′′ E 2 015
Langa LNG Civanga Lac Kivu Basin 2°17′35′′ S 28°45′24′′ E 1 990
Nabugobugo NBG Musisi Congo River Basin 2°15′55′′ S 28°39′04′′ E 2 161
Mirembo I MIR_I Mugaba Congo River Basin 2°16′01′′ S 28°35′44′′ E 2 264
Mirembo II MIR_II Mugaba Congo River Basin 2°15′30′′ S 28°34′52′′ E NA
Chumba CHU Mugaba Congo River Basin 2°15′16′′ S 28°39′22′′ E 2 332
Citori CI Mugaba Congo River Basin 2°15′11′′ S 28°39′44′′ E 2 384
Cinya I CNY_I Mugaba Congo River Basin 2°16′40′′ S 28°39′52′′ E 2 327
Cinya II CNY_II Mugaba Congo River Basin 2°16′08′′ S 28°39′35′′ E 2 303
Mugaba MUG Mugaba Congo River Basin 2°15′51′′ S 28°39′57′′ E 2 289
Bwangizi BWA Mugaba Congo River Basin 2°15′33′′ S 28°39′12′′ E 2 300
NA = data not available
Table 1: Sampled sites in the Kahuzi-Biega National Park
Site name codeSite Stones Cobbles Pebbles Gravel Sand Mud Debris Aquatic andMarginal vegetation
Canopy
cover (mFlow 3 s−1) (cm svelocity −1)
Chanderema CH 10% – 5% 60% 15% – 10% – 100% 0.015 8.03 Mushuva I MU_I – 15% 60% 5% 5% 5% 10% – 100% 0.100 20.05 Mushuva II MU_II – 5% – 75% – 5% 10% 5% 100% 0.100 52.00 Langa LNG 10% 35% 40% 10% – – 5% – 100% 0.088 42.02 Nabugobugo NBG 65% 5% 10% – 15% – 5% – 100% 0.074 36.04 Mirembo I MIR_I – – – 85% 5% 5% 5% – 100% 0.030 22.13 Mirembo II MIR_II 15% 5% 5% 25% 5% 5% 40% – 100% 0.030 22.00 Chumba CHU – – 5% 45% – – 10% 40% 100% 0.058 36.00 Citori CI – – – – 40% 40% 20% – 100% 0.021 31.02 Cinya I CNY_I – 10% 40% 30% – 5% 15% – 100% 0.036 25.02 Cinya II CNY_II – – – – – 20% 75% 5% 100% NA NA Mugaba MUG – – – 80% 5% 5% 5% 5% 100% 0.110 36.02 Bwangizi BWA – – – 90% 5% – 5% – 100% 0.740 51.01
NA = data not available
Table 2: Physical characteristics for the 13 sampling sites
Sites (°C)T pH Cond.(µS) (mg lDO−1) NO3 (mg l−1) (mg lPO4−1) CH 14.1 6.1 54 7.60 0.0217 0.0523 MU_I 11.3 7.4 64 6.20 0.0198 0.0276 MU_II 13.0 7.6 69 6.11 NA NA BUS 13.8 6.1 13 5.68 0.0192 0.0082 MI_I 13.2 6.5 19 5.80 0.0192 0.0086 MI_II 13.3 6.3 17 6.10 NA NA LNG 14.9 7.0 17 7.55 0.0136 0.0105 CHU 14.6 5.6 13 5.70 0.0173 0.0114 CI 14.5 5.5 14 5.38 0.0155 0.0105 CNY_I 13.2 7.6 8 3.50 NA NA CNY_II 13.5 5.7 15 1.89 0.0217 0.0238 MUG 13.7 6.9 30 3.37 0.0173 0.0162 NBG 13.9 5.0 13 5.79 0.0155 0.0124
NA = data not available
Table 3: Chemical parameters recorded in the 13 sampling sites.
For NO3 and PO4, measurement were only made in 2008. All other parameters were measured in 2008 and 2010
Results
Physical and chemical parameters
Water temperature varied between 11.3 °C (MU_I) and 14.9 °C (LNG) (Table 3). pH values varied between 5.0 (NBG) and 7.6 (CNY_I). Conductivity recorded during the sampling periods ranged between 8.0 µS cm−1 (CNY_I) and 69.0 µS cm−1 (MU_II). Dissolved oxygen varied between 1.9 mg l−1 (CNY_II) and 7.6 mg l−1 (CH). In comparison with Lake Kivu tributaries, most of the Congo River tributaries showed lower dissolved oxygen levels, ranging between 1.9 mg l−1 and 6.1 mg l−1. Nitrate concentration was the highest at CH (0.022 mg l−1), whereas the lowest concentration (0.014 mg l−1) was
recorded at LNG. The highest phosphate concentration was recorded at CH (0.052 mg l−1), whereas the lowest concentration was recorded at BUS (0.008 mg l−1).
In the PCA of environmental parameters, the Jolliffe cut-off test set the important components higher than 0.028, and the first two axes combined (PC1 = 0.25 and PC2 = 0.08) explained more than 95% of the total variability in the data. Table 4 shows the importance of each of the eight principal components. The PCA (Figure 2) showed a similarity between CH and MU_I, which both flow into Lake Kivu. A second group was formed by streams primarily draining into the Congo Basin. The MU_II site was separated from the eastward flowing sites in the PCA scatter diagram, probably owing to the high water velocities at this site relative to the other sites. The strongest explanatory variable of the spatial distribution of all sampling sites was current velocity, with conductivity also appearing as a strong explanatory variable.
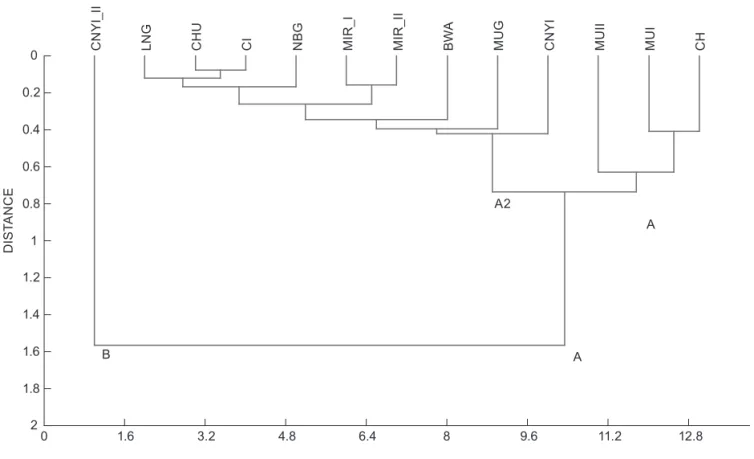
In the cluster analysis (based on Euclidean distance; Figure 3), Cluster B (CNYI_II site) strongly diverged from the other sites, with the sites, with the exception of CNY_II, grouping in Cluster A. In subgroup A1, a similarity was found between CH and MU_I. Both sites were also similar to MU_II as the Chanderema River (CH) drains into the Mushuva River, which in turn flows into Lake Kivu. The second subgroup (A2) was primarily formed by streams draining into the Congo Basin. The Principal component Eigenvalue Percentage variance
1 0.0924 61.258 2 0.0362 24.014 3 0.0151 9.989 4 0.0039 2.589 5 0.0014 0.903 6 0.0012 0.811 7 0.0004 0.296 8 0.0002 0.139
Table 4: PCA eigenvalues of environmental parameters based on a variance-covariance matrix COMPONENT 1 C O M PO N EN T 2 Discharge (m‡ s−1) Speed (cm s−1) Temp pH Cond DO NO PO CH MU_I MU_II LNG NBG MIR_I MIR_II CHU CI CNY_I CNY_II MUG BWA −1.50 −0.75 0.75 1.50 2.25 3.00 3.75 4.50 −1.5 1.5 3.0 4.5 6.0 7.5 0 0
0 1.6 3.2 4.8 6.4 8 9.6 11.2 12.8 2 1.8 1.6 1.4 1.2 1 0.8 0.6 0.4 0.2 0 D IS TAN C E CN YI _I I LN G CH U C I N BG M IR _I M IR _I I BW A M U G CN YI M U II M U I C H B A A A2
Figure 3: Cluster analysis of environmental parameters based on Euclidian distance
Table 5: List of aquatic macroinvertebrates sampled from Kahuzi-Biega National Park Rivers and streams. Abundance of specimens are rated as: (+) = 1 to 9; (++) = 10 to 99; (+++) = ≥100 specimens.
Abundance of specimens are rated as: (+) = 1 to 9 specimens ; (++) = 10 to 99 specimens; (+++) = ≥100 specimens.
Order Family Genus Morphospecies CH MU_I MU_II BUS MIR_I MIR_II LNG CHU CI CNY_I CNY_II MUG NBG
Ephemeroptera Leptophlebiidae Adenophlebia Adenophlebia sp1 ++ +++ +++ ++ +++ +++ ++ ++ ++ + ++ ++
Adenophlebia sp2 ++ ++ ++ ++ ++ +++ ++ ++ + + ++
Adenophlebia sp3 +
Baetidae Baetis Baetis sp1 ++ +++ +++ + ++ + ++ + +
B. sp2 +
Centroptilum Centroptilum sp. ++ +
Acentrella Acentrella sp. +
Heptageniidae Afronurus Afronurus sp. + + + + + ++
Dicercomyzidae Dicercomyzon Dicercomyzon sp. + + +
Caenidae Caenis Caenis sp1 ++ ++ + +
Caenis sp2 ++ +
Prosopistomatidae Binoculus (?) Binoculus sp (?) + + ++ + ++
Diptera Unidentified Diptera Fam. gen. sp. +
Tipuliidae Tipula Tipula sp. ++ + + + + ++ + + +
Hexatoma sp. + + + ++ ++ + + +
Ceratopogonidae Ceratopogonidae gen. Ceratopogonidae. gen. sp. + +++
Chironomiidae Chironomiidae gen. Chironomidae gen. sp. +++ + + ++ + ++ ++ +++
Limoniidae Limoniidae gen. Limoniidae gen. sp. + +
Athericidae Atrhichops Atrhichops sp. + + + +
Atherix Atherix sp. + ++ + + + + + + ++
Anthomiidae Anthomiidae gen. Anthomiidae gen. sp. +
Simuliidae Simulium Simulium sp. ++ ++ ++ + + + + ++ +
Dixidae Dixa Dixa sp. +
Coleoptera Dytiscidae Dytiscidae gen. Dytiscidae gen. sp. + +
Elmidae Elmis Elmis sp. + + +
Dupophilus Dupophilus sp. + + +
Limnius Limnius sp. + +
Riolus Riolus sp. +
Scirtidae Hydrocyphon Hydrocyphon sp. + ++ + + ++ ++ ++
Elodes Elodes sp. + + + + +
Table 5: (cont.)
Abundance of specimens are rated as: (+) = 1 to 9 specimens ; (++) = 10 to 99 specimens; (+++) = ≥100 specimens.
Order Family Genus Morphospecies CH MU_I MU_II BUS MIR_I MIR_II LNG CHU CI CNY_I CNY_II MUG NBG
Psephenidae gen. Psephenidae gen. sp. +
Gyrinidae Dineutus Dineutus sp. + + +
Aulonogyrus Aulonogyrus sp. + + + +
Gyrinidae gen. Gyrinidae gen. sp. + + + +
Gyrinus Gyrinus sp. +
Dryopidae Dryopidae gen. Dryopidae gen. sp. +
Plecoptera Perliidae Neoperla Neoperla sp. + + ++ ++ ++ ++ + ++ ++ ++
Heteroptera Veliidae Rhagovelia Rhagovelia sp. + ++
Pleidae Plea Plea sp. +
Nocteridae Nocteridae gen. Nocteridae gen. sp. +
Trichoptera Hydropsychidae Diplectronella Diplectronella sp. + Ethiopsyche (syn. Cheumatopsyche) Ethiopsyche (Ch. sp.) ++ +++ ++ ++ + + ++ ++ ++ + + Hydropsyche Hydropsyche sp. + + + + + Cheumatopsyche Cheumatopsyche +++ ++ ++ ++ ++ ++ Leptonema Leptonema sp. ++ ++
Lepidostomatidae Lepidostoma Lepidostoma sp. + ++ ++ + + + ++ + +++ + + ++
Dipseudopsidae Dipseudopsis sp. Dipseudopsis sp. ++ + + +
Pseudoneureclipsis sp. Pseudoneureclipsis sp. + + + Leptoceridae Triaenodes Triaenodes sp. +
Athripsodes Athripsodes sp. + +
Oecetis Oecetis sp. + +
Glossosomatidae Cryptothrix Cryptothrix sp1 + + Cryptothrix sp2 +
Polycentropodidae Nyctiophylax Nyctiophylax + + + + +
Cyrnus Cyrnus sp. + +
Polycentropus Polycentropus sp. +
Philopotamidae Chimarra Chimarra sp. + + + + +
Thylakion Thylakion sp. + + + + + +
Pisuliidae Pisula Pisula sp. +
Psychomyiidae Tinodes Tinodes sp. +
Calamoceratidae Anisocentropus Anisocentropus sp. ++ + ++ ++ + + +
Odonata Chlorocyphidae Chlorocypha Chlorocypha sp. ++ + + + +
Aeshnidae Aeshnidae gen. Aeshnidae gen. + + + + + + + +
Anaciaeschna Anaciaeschna + +
Boyera Boyera + + + + +
Brachytron Brachytron +
Libellulidae Brachytnemis Brachytnemis +
Libellula Libellula +
Sympetrum Sympetrum + +
Cordulidae Cordulia Cordulia ++ + +
Somatochlora Somatochlora + + + + ++
Gomphidae Gomphus Gomphus sp. + + ++ + +
Paragomphus Paragomphus sp. + + + ++ +
Onychogomphus Onychogomphus sp. +
Coenagrionidae Coenagrionidae gen Coenagrionidae gen. sp. +
Nematoda Gordiacae Gordiacae gen. Gordiacae gen. sp. + + + Bivalvia Dreissenidae Pisidium Pisidium sp. +
Crustacea Potamonidae Potamonidae gen. Potamonidae gen. sp. ++ ++ ++ + + + ++ ++ + Turbellaria Dugesiidae Dugesia Dugesia sp. ++ ++
Hirudinea Glossiphonidae Theronmyson Theronmyson sp. +
Helobdella Helobdella sp. + + + + ++ +
Haementeria Haementeria sp. + +
Erpobdeliidae Erpobdeliidae gen. Erpobdeliidae gen. sp. + +
Nbr morphospecies 25 25 29 25 33 35 28 24 23 23 5 20 22 Nbr genus 21 22 27 24 32 34 27 23 22 22 4 19 21 Nbr Families 18 19 24 21 25 27 22 20 19 20 4 15 18 Abundance (%) 7.08 27.39 9.85 8.09 5.23 11.4 6.05 3.88 5.91 3.82 2.71 3.7 4.82 Shannon_H 2.944 2.944 3.135 3.045 3.219 3.296 3.091 3 2.89 2.996 1.39 2.639 2.89 Simpson_1-D 0.9474 0.9474 0.957 0.952 0.96 0.963 0.955 0.95 0.94 0.95 0.75 0.929 0.944
highest level of similarity was found between CHU and CI in subgroup A2.
Aquatic macroinvertebrates
Relative abundance and diversity
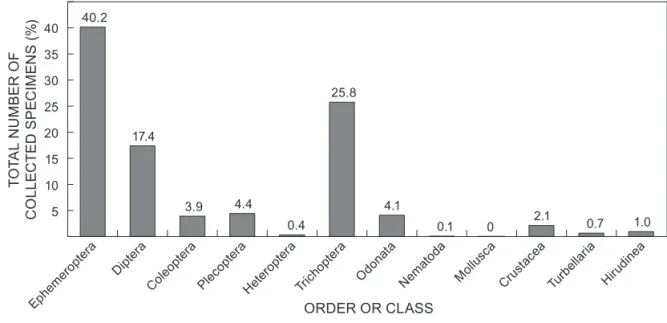
Five thousand and forty specimens were collected at the 13 sites (Table 5). These belonged to 84 morphospecies (for a total of 77 identified genera), 47 families and 12 orders. The relative abundance varied between taxonomic groups (Figure 4). The most abundant orders were Ephemeroptera (40.2% of specimens) and Trichoptera (25.8% of specimens). Nematodes (0.1 %) and bivalves (0.01%) were the least abundant. For most taxonomic groups, the numbers were made up from one or two dominant families. For instance, Ephemeroptera were dominated by Leptophlebiidae (61.46% of collected specimens of this family) and Baetidae (28.97%); Trichoptera by Hydropsychidae (63.66%); Diptera by Chironomidae (mostly Tendipendini Chironomid Tribe;
54.69%), and; Odonata by Aeshnidae (27.53%) and Gomphidae (26.57%).
In terms of number of morphospecies recorded within each order (Figure 5), Trichoptera had the most morphospecies (21) followed by Odonata and Coleoptera (14 each), Diptera (13) and Ephemeroptera (12). The fewest morphospecies were found in the Order Plecoptera, the Order Decapoda, the Class Turbellaria, the Class Bivalvia (Order Veneroidea) and the Phylum Nematoda.
Spatial distribution
Spatial distribution of taxonomic groups showed two trends (Figure 6). Some groups (e.g. Diptera, Ephemeroptera and Trichoptera) were recorded at all sites, except CNY_II. By contrast, Bivalvia, Nematoda, and Turbellaria occurred at one or two sites only.
The spatial distribution of morphospecies exhibited similar trends than those observed for the superior taxonomic levels. Many morphospecies, such as Adenophlebia sp. (Ephemeroptera) and Cheumatopsyche (Ethiopsyche) sp. 40.2 17.4 3.9 4.4 0.4 25.8 4.1 0.1 0 2.1 0.7 1.0 5 10 15 20 25 30 35 40 TO TA L N U M BER O F C O LL EC TE D S PE C IM EN S ( % ) ORDER OR CLASS Ephe merop tera Dipte ra Coleo ptera Pleco ptera Heter opter a Trich opter a Odon ata Nema toda Mollu sca Crus tacea Turbe llaria Hirud inea
Figure 4: Relative abundance of collected order, expressed as a percentage of the total number of collected specimens/individuals
12 11 14 1 3 21 14 1 1 1 1 4 5 10 15 20 ORDER OR CLASS Ephe merop tera Dipte ra Coleo ptera Pleco ptera Heter opter a Trich opter a Odon ata Nema toda Mollu sca Crus tacea Turbe llaria Hirud inea N U M BER O F M O R PHO SP EC IE S
(Trichoptera) were recorded at all sites, except those in the Cinya River (CNY_I and II) and in the Chumba Rivers (CHU), respectively. Other morphospecies, such as Caenis sp2 (MU_I and II), Leptonema sp. (MUG, NBG), Diplectronella sp. (CH), Acentrella sp. (LNG) and Plea sp. (LNG), only occurred at a few sites.
Morphospecies richness
Morphospecies richness also varied among the sites (Figure 7). The greatest number of taxa (35 morphospecies) was recorded at MIR_ II and the least (5 morphospecies) at CNY_II.
The cluster analysis of site similarity (based on Simpson’s Diversity Index calculated with morphospecies
data), revealed the greatest similarity between sites in the same river or catchment (Figure 8). Cluster A, which comprised CNY_I and CNY_II, both on the Cinya River (CNY_II with the characteristics of a swamp site), had the lowest diversity value (1.39). Cluster B was divided into two subgroups (B1 and B2) where CH separated from other sites. Subgroup B1 comprised MU_I and MU_II in the Mushuva River, and subgroup B2 grouped MIR_I and MIR_II, in the Mirembo River, and Busangizi River site.
The number of families recorded varied among sites (Figure 9) (data pooled for 2008 and 2010 samples). The highest number of families was recorded at MIR_II (27 families). The lowest number was recorded
TO TA L N U M BER O F C O LL EC TE D S PE C IM EN S ( % ) SAMPLING SITES 10 20 30 40 50 60 70 80 90CH MU_I MU_II BUS MIR_I MIR_II LNG CHU CI CNY_I CNY_II MUG NBG
Hirudinea Turbellaria Crustacea Mollusca Nematoda Odonata Trichoptera Heteroptera Plecoptera Coleoptera Diptera Ephemeroptera
Figure 6: Spatial distribution of inventoried main taxonomic groups
N U M BER O F M O R PHO SP EC IE S 25 25 29 25 33 35 28 24 23 23 5 20 22 5 10 15 20 25 30 35 SAMPLING SITES
CH MU_I MU_II BUS MIR_I MIR_II LNG CHU CI CNY_I CNY_II MUG NBG
at CNY_II (4 families). which was significantly different (ANOVA, p < 0.0001) from the other sites.
Shannon–Wiener’s Diversity Index
MIR_II had the highest Shannon-Wiener's Diversity Index value (calculated at the family taxonomic level) (3.30) and was significantly different (p < 0.05) from CNY_II, which had the lowest value (1.39) (Figure 10). A t-test performed on the Shannon-Wiener's Diversity Indices also showed significant differences between CNY_II and the other sampling sites.
Discussion
Abiotic conditions
The low conductivity at sampling sites could be the result of multiple drivers, whose identification goes beyond the scope of the current study. Previous research supports the hypothesis that riparian vegetation improves ecological functions and quality of water of running watercourses. The presence of vegetation (especially forest cover like trees and shrubs) along and above the edge of a river can lead to low conductivity, low turbidity, low temperature
0.3 0.4 0.5 0.6 0.7 0.8 0.9 1.0 SI M IL A R IT Y C N Y_ I C N Y_ II M U_ I M U _II BUS MIR _I MI R _I I M UG N BG LN G CI CH U CH Cluster A Cluster B B2 B1 1.6 3.2 4.8 6.4 8 9.6 11.2 12.8
Figure 8: Cluster analysis based on Simpson’s Diversity Index for 13 sites located in 10 streams, Kahuzi-Biega National Park
18 19 24 21 25 27 22 20 19 20 4 15 18 5 10 15 20 25 N U M BER O F F A M IL IE S SAMPLING SITES
CH MU_I MU_II BUS MIR_I MIR_II LNG CHU CI CNY_I CNY_II MUG NBG
(de Souza et al. 2013; Ogbuagu and Okoli 2013), nutrients uptake (Tabacchi et al. 2000; Dosskey et al. 2010), low total dissolved salts (TDS) (Tabacchi et al. 2000; Wilkinson et al. 2018), low pH (acidic conditions), high water transparency and high dissolved oxygen levels (Collier et al. 1995; WRC 2000; Chapman and Chapman 2003; Kasangaki et al. 2006, 2008; Hussain and Pandit 2012; Wilkinson et al. 2018). The presence of riparian vegetation could therefore explain the low conductivity recorded at sampled sites, although this could also be attributed to geology and soil chemistry, because the KBNP rivers flow over basaltic soils and acidic volcanic rocks (Pecrot and Leonard 1960; Rahm 1967).
Similarly, the acidic conditions observed in the study rivers could be a result of geology and soil chemistry and/ or of the riparian canopy, which provides high levels of organic matter (e.g. decaying plant material that releases humic acid) (Winemiller et al. 2008). In Uganda and the Czech Republic, mountain forest streams showed low conductivity and acidic pH (Kasangaki et al. 2008; Svobodová et al. 2012) as a result of riparian vegetation and forest coverage of watersheds (Dudgeon 2008; Kasangaki et al. 2008; Wilkinson et al. 2018). In addition, the relatively low temperature measured in the current study could be associated with closed-canopy conditions and a high altitude (1 990 m to 2 384 m asl), as suggested for Ugandan and South African forest streams (Kasangaki et al. 2006; Dallas 2007a; Dallas 2008). Altitude and canopy cover have indeed previously been reported as fundamental parameters significantly determining water temperature in rivers (Jacobsen 2000; Kasangaki et al. 2006; Dallas 2007a; Rivers-Moore et al. 2008).
Dissolved oxygen levels for most of the sites assessed in the current study were within natural limits to sustain aquatic life (Abowei 2010). However, the low dissolved oxygen concentration observed in CNY_I, CNY_II and MUG were probably related to a low current associated with swamp zones. Dowling and Wiley (1986) reported that a decline in oxygen in slow flowing streams could be attributed to high level of organic matter decay. As a result, slow and stagnant waters combined with the
accumulation of decaying plants, increase microbial activity depleting waters from oxygen (Havens et al. 1995). This was particularly striking for CNY_II considering the slow current velocity and aquatic decaying plants, reflecting wetland characteristics of the site. It is a well-know fact that a low dissolved oxygen concentration in aquatic ecosystems could have adverse effects on many aquatic invertebrates when concentrations reach the level of becoming a limiting parameter to sustain life (DWAF 1996; Mason 2002; Dallas and Day 2004; Dallas 2008; Oberholster and Ashton 2008; CSIR 2010; Osibanjo et al. 2010; Nel et al. 2013). Nonetheless, these low dissolved oxygen concentrations and slow current velocity conditions appeared natural in some of the sites suggesting that they are a natural part of the diversity and complexity of KBNP aquatic ecosystems.
The PCA analyses showed that current velocity, conductivity and dissolved oxygen levels were the best drivers of aquatic macroinvertebrates fauna distribution, among the various parameters considered. However, a comparison between the cluster analysis of faunal diversity and the cluster analysis of physico-chemical parameters of the sampling sites revealed that the two clustering patterns differed notably from one (Figure 3 and Figure 8). No direct, strong or obvious relationship between faunal composition of sampled sites and physical and chemical parameters were observed. For example, MU_I and MU_II appeared closely related in terms of physico-chemical parameters (Figure 8), but their macroinvertebrate diversity was completely divergent (Figure 2b). Similarly, CNY-I and CNY_II strongly differed in terms of macroinvertebrate diversity (Figure 2b), yet their physico-chemical parameters were similar (Figure 8). The results suggest that, even if abiotic parameters recorded in this study are known to be crucial ecological factors shaping the aquatic macroinvertebrates community, they were statistically not strong enough to reflect similarities or differences in terms of communities and diversity in the current study. These findings were consistent with the analysis of beta diversity drivers recently conducted by Heino et al. (2015). Additional
2.944 2.944 3.140 3.045 3.219 3.300 3.090 3.000 2.890 2.996 1.390 2.640 2.890 0.000 1.000 2.000 3.000 SH ANN O N -W IE N ER 'S D IV ERS IT Y IN D EX VA LU E SAMPLING SITES
CH MU_I MU_II BUS MIR_I MIR_II LNG CHU CI CNY_I CNY_II MUG NBG
studies are therefore required to determine which abiotic factors are the best indicators of ecological constraints shaping local communities in a particular study area. Faunal diversity of KBNP Rivers
The sampling protocol used in the current study was not designed to allow fine quantitative analysis of specimen abundance because the number of collected specimens at each site was strongly dependent on sampling effort and sampled habitat at each site. Despite this, the study proposed one of the very few graphical analysis of relative abundances for the area, providing some interesting insights and new knowledge on the presence and distribution of main taxonomic groups in the relatively un-inventoried rivers of KBNP.
Ephemeroptera and Trichoptera were the most abundant insect orders collected and their presence indicated well-oxygenated water conditions in most investigated rivers. In near natural conditions, small forested streams are often dominated by Trichoptera, Ephemeroptera, Plecoptera and Diptera taxa (Benstead and Pringle 2004). It is worth mentioning that all aquatic macroinvertebrate orders and families reported collected at the sites are widespread in African forest streams (Kasangaki et al. 2006, 2008). The predominance of Ephemeroptera, Trichoptera and Odonata in forest streams has been associated with low temperature, high dissolved oxygen levels, and tolerance of several taxa in these orders towards acidic conditions (Kasangaki et al. 2006, 2008; Lorion and Kennedy 2009; Arthur 2010). Microhabitat diversity is also directly linked to species richness of Ephemeroptera, Trichoptera and Diptera (Silveira et al. 2006; Dallas 2007b) and might be especially important with regards to correlating presence/absence of certain taxa, but the analysis of such component of the habitat was beyond the scope of the current study. Almost all Kahuzi-Biega forest streams share similar features with substrates composed of debris, gravel, pebbles and stones, known to be favourable settlement to benthic macroinvertebrates (See, for example, Beauger and Lair 2008 and references therein).
Although the number of Plecoptera taxa was low, Neoperla (Perlidae) was recorded at most sampling sites. Duran and Suicmez (2007) asserted that high species richness of Ephemeroptera, Plecoptera and Trichoptera indicate good water quality. Unfortunately, current scientific knowledge on ecological traits and requirements of aquatic invertebrates in KBNP is too little to draw any connection between faunal diversity and water quality. Furthermore, the Order Plecoptera is far less diversified in central Africa than in the northern hemisphere. For the studied region, two morphospecies belonging to the same genus were inventoried. Therefore, the relevance of this group for assessing freshwater ecosystems health in central African countries, in comparison with Trichoptera or Ephemeroptera orders, is low. However, because aquatic macroinvertebrates have been successfully used in various countries to assess ecological quality of watercourses (Dallas 1997; Stuijfzand et al. 1999; Dickens and Graham 2002; Houghton 2004; Souto et al. 2011; Pirvu and Pacioglu 2012), it is important to dedicate time and energy to develop a biotic index system to be able to monitor changes in water and ecosystem quality in the
KBNP area. Knowing that Leptophlebiidae (Adenophlebia), Hydropsychidae (Cheumatopsyche, Ethiopsyche) and Perlidae (Neoperla) are sensitive to organic pollution and require clean and well-oxygenated waters to survive in other regions of the world (Tachet et al. 2003; Griffiths et al. 2015), the presence of these taxa at the sampling sites could indicate a general good quality of river ecosystems.
Low diversity at the CNY_II site could be attributed to slow current conditions, associated with muddy substrate, and aquatic decaying plants, leading to low pH through release of humic and fulvic acids and low dissolved oxygen levels (Dudgeon 2008). The high abundance of chironomid larva (Diptera) and the absence of Trichoptera and Ephemeroptera at the CNY_II site were most likely, because of unsuitable substrates and insufficient velocity of the current (hence, unsuitable microhabitats) for numerous species at this site (Móra and Szivák 2012). Nonetheless, those aspects and their influence on the biota and invertebrates diversity were not assessed and, therefore, this interpretation should be considered with care. Some species of chironomid larva (Diptera) are often very tolerant to low dissolved oxygen concentrations, with some species capable of persisting under very low dissolved oxygen levels and acidic conditions, which ultimately might lead to lower diversity (Al-Shami et al. 2010; CSIR 2010; Osibanjo et al. 2010; Souto et al. 2011; Efe et al. 2012; Svobodová et al. 2012; Nel et al. 2013; Ngera 2014). Additional research is nonetheless required to fully understand the reasons for low diversity in some specific sites.
Acentrella (Family Baetidae, Order Ephemeroptera), Plea (Family Pleidae, Order Heteroptera) and Pisidium (Family Sphaeriidae, Order Veneroidea, Phylum Mollusca) were recorded only at the LNG site, which yielded the fourth highest number of morphospecies. The site is located in the forest, close to an agricultural area. During certain periods of the year, farmers used to throw crop waste into rivers in order to clean their fields, resulting elevated decaying vegetation in rivers that cross agricultural lands. These practices may have to nutrient enrichment and subsequent changes in trophic web at LNG. As suggested by the controversial Medium Disturbance Hypothesis (Fox 2013), these periodic disturbances at LNG could lead to a greater richness in species. Kasangaki et al. (2008) previously proposed that at moderately disturbed sites, the disturbance creates ecological space for new species that are not very competitive, consequently increasing the species richness of the site. The study reported the presence of Acentrella genus, which is usually associated with bedrocks and swift flowing and well-oxygenated rivers (Demoulin 1956). Its presence at the LNG site could be explained either by (i) misidentification of these specimens, (ii) tolerance of Acentrella species to extreme conditions in comparison with the ecological optimum that characterises this genus or (iii) the fact that these specimens are species with ecological traits at one extreme of the ecological range of Acentrella genus. Without additional information, the most explanation is the second one. In recent years, studies in rivers flowing through agricultural landscape downstream of the KBNP (Ngera et al. 2009) have revealed about 100 morphospecies, with Baetis (Ephemeroptera), Trichorythus (Ephemeroptera) and Lepidostoma (Trichoptera) as the
dominant taxa. These taxa are well-known to be more tolerant to organic pollution (Klemm et al. 1990) than those found at the LNG site in the current inventory. It might therefore be interesting to do additional study on the structure of macroinvertebrate species communities and responses to different land-use practices, both inside and outside the protected area of KBNP.
The high morphospecies richness observed in the majority of the sites could be attributed to the diversity of microhabitats (diversity of substratum and current velocity conditions) and undisturbed forested river ecosystems. These results are in line with the conclusions of the programme 'Biodiversité des Écosystèmes Aquatiques et Terrestres dans le Rift Albertin' (P-BEATRA 2005), which reported that the high species richness and diversity recorded in the Kahuzi-Biega Rivers are likely, owing to the natural forested landscape. Several studies showed similar results in other regions across the globe (Klemm et al. 1990; Reece and Richardson 2000; Chapman and Chapman 2003; Dallas 2005; Couceiro et al. 2007; Kasangaki et al. 2008; Lorion and Kennedy 2009). However, the species richness of rivers worldwide usually peaks for mid-order streams and large rivers, as opposed to headwater rivers, because of a greater diversity of habitats and flow conditions in comparison with small streams and rivers (Ward and Stanford 1983; Hussain and Pandit 2012). Conclusion
This study, and previous inventories in KBNP (P-BEATRA 2005), improved the knowledge of aquatic macroinvertebrates biodiversity in this area of the Albertine Rift (central Africa). Although some species have not been described, aquatic macroinvertebrates collected in the current study were not restricted to Kahuzi-Biega rivers and streams, and all appear to be widespread in forest rivers in the region. Three decades ago, studies in the vicinity of KBNP revealed 21 and 26 species belonging to Ephemeroptera and Trichoptera respectively (Statzner 1976; Kopelke 1979, 1981). This information emphasises the requirement for knowledge on the taxonomic diversity of aquatic macroinvertebrates in KBNP region to be synthesised. One can imagine, for example, the construction of an online database of the aquatic species of the region, coupled with geographical data for a better understanding of the spatial ecology of these species. These are needed to ground future ecological work as shown in this study.
More in-depth taxonomic (species-level identification) and ecological studies would lead to a better understanding of these taxa and their suitability as indicators for different ecological conditions. Extending the sampling effort all year round, including the lowland region of the park, would also facilitate understanding of ecological processes in Kahuzi-Biega rivers and streams. More comprehensive sampling protocols of biota would have to be developed, including light and Malaise trapping methods, because some species rely on adult stages for species identification. This would provide valuable information on the ecological status of KBNP rivers and help conservationists to plan and implement conservation strategies. Indeed, KBNP both
an area of major ecological interest and one of extreme socioeconomic importance. It is therefore crucial to be able to conserve and manage this protected area in a sustainable way, based on reliable scientific knowledge.
Acknowledgements — We thank the Field Museum of Chicago through John Bates for financial support of this field work, the KBNP Director (Radar Nashuli) and CRSN authorities that allowed us access to the park. Our gratitude goes also to Helen Barber-James (Albany Museum, Department of Freshwater Invertebrates, Grahamstown, South Africa) for her assistance with macroinvertebrates identification and Kitambala wa Kayugi for his help in the field. We also express our sincerest gratitude to Julian Kerbis for his advice and encouragement and to Betty Chang and Anneloes Martinsen for reviewing the English of the manuscript. We also express our gratitude to the anonymous referees that reviewed our manuscript and made valuable comments that helped us to improve the manuscript.
References
Abel PD. 2002. Water Pollution Biology. (2nd Ed.). Taylor and Francis Ltd.
Abowei JFN. 2010. Salinity, Dissolved oxygen, pH and Surface water Temperature conditions in Nkoro River, Niger Delta, Nigeria. Advance Journal of Food Science and Technology 2(1): 36–40. Al-Shami SA, Rawi CSM, Hassan Ahmad A, Nor SAM. 2010.
Distribution of Chironomidae (Insecta: Diptera) in polluted rivers of the Juru River Basin, Penang, Malay. Journal of Environmental Sciences (China) 22(11): 1718–1727.
Arthur JB. 2010. The influence of upstream forest on macroinvertebrate communities in pastoral landscapes. MSc thesis, University of Canterbury, Great Britain.
Bagalwa M, Zirirane N, Pauls S, Karume K, Ngera M, Bisimwa M, Mushagalusa NG. 2012. Aspects of the physic-chemical characteristics of rivers in Kahuzi-Biega National Park, Democratic Republic of Congo. Journal of Environmental Protection 3: 1590–1595.
Barnaud G, Fustec E. 2007. Conserver les zones humides: pourqoi? Comment? Dijon, France: Éditions Quae, Versailles, and Educagri éditions.
Beauger A, Lair N. 2008. Keeping it simple: benefits of targeting riffle-pool macroinvertabrate communities over multi-substratum sampling protocols in the preparation of a new European biotic index. Ecological Indicators 8: 555–563.
Benstead JP, Pringle CM. 2004. Deforestation alters the resource base and biomass of endemic stream insects in eastern Madagascar. Freshwater Biology 49: 490–501.
Bisimwa MA, Ngera MF, Bisimwa KD, Bagalwa MJ, Mushayuma NH. 2013. A Preliminary Checklist of Epilithic Algae of Kahuzi-Biega National Park, Democratic Republic of the Congo. Greener Journal of Biological Science 3(8): 282–291.
Chapman CA, Chapman LJ. 2003. Deforestation in Tropical Africa. Impacts on aquatic ecosystems. Gainesville: University Press of Florida.
Chutter FM. 1972. An empirical biotic index of the quality of water in South African Streams and Rivers. Water Research Pergamon 6: 19–30.
Collier KJ, Cooper AB, Davies-Colley RJ, Rutherford JC, Smith CM, Williamson RB. 1995. Managing riparian zones: A contribution to protecting New Zealand’s rivers and streams. Vol 1: Concepts. Wellington, New Zealand: Department of Conservation.
Couceiro SRM, Hamada N, Luz SLB, Forsberg BR, Pimentel TP. 2007. Deforestation and sewage effects on aquatic macroinvertebrates in urban streams in Manaus, Amazonas, Brazil. Hydrobiologia 575(1): 271–284.