HAL Id: hal-01097494
https://hal.archives-ouvertes.fr/hal-01097494
Submitted on 19 Dec 2014HAL is a multi-disciplinary open access archive for the deposit and dissemination of sci-entific research documents, whether they are pub-lished or not. The documents may come from teaching and research institutions in France or abroad, or from public or private research centers.
L’archive ouverte pluridisciplinaire HAL, est destinée au dépôt et à la diffusion de documents scientifiques de niveau recherche, publiés ou non, émanant des établissements d’enseignement et de recherche français ou étrangers, des laboratoires publics ou privés.
Duration of rapid light curves for determining the
photosynthetic activity of microphytobenthos biofilm in
situ
Sébastien Lefebvre, Jean-Luc Mouget, Johann Lavaud
To cite this version:
Sébastien Lefebvre, Jean-Luc Mouget, Johann Lavaud. Duration of rapid light curves for determining the photosynthetic activity of microphytobenthos biofilm in situ. Aquatic Botany, Elsevier, 2011, pp.1-8. �10.1016/j.aquabot.2011.02.010�. �hal-01097494�
D
URATION OF RAPID LIGHT CURVES FOR DETERMINING THE PHOTOSYNTHETIC ACTIVITY OF MICROPHYTOBENTHOS BIOFILM IN SITULefebvre S.1,2, Mouget J.-L.3, Lavaud J.4
1
UMR 100 IFREMER-Université de Caen Basse-Normandie “Physiologie et Ecophysiologie des Mollusques Marins (PE2M)”, Laboratoire de Biologie et Biotechnologies Marines, Esplanade de la Paix, B.P. 5186, 14032 Caen Cedex, France
2
Université de Lille1 Sciences et Technologies – CNRS, UMR 8187 Laboratoire
d'Océanologie de Géosciences, Wimereux Marine Station, 28 av. Foch,
62930 Wimereux, France
3
Université du Maine, Laboratoire de d‟Ecophysiologie et Métabolisme des Microalgues, EA 2160, Mer, Molécules, Santé, Ave O. Messiaen 72085 Le Mans cedex 9, France
4 UMR CNRS 6250 „LIENSs‟, Institute for Coastal and Environmental Research (ILE),
University of La Rochelle, 2 rue Olympe de Gouges, 17042 La Rochelle Cedex, France.
Corresponding author: sebastien.lefebvre@univ-lille1.fr Phone: +33 3 21 99 29 25
Abstract
This study is the first field work that examines the use of Rapid Light Curves (RLCs) for in situ assessment of microphytobenthos (MPB) photosynthetic activity. The advantages offered by RLC methodology respond primarily to in situ constraints concerning MPB ecology and behaviour. In particular, the rapidity of RLCs allows for a high number of replicates during emersion, while preventing disturbance of the measurement due to MPB cell migration. It is necessary to maintain this feature in order to thoroughly assess the large spatial and temporal variability of in situ MPB biomass and photosynthetic activity. Consequently, working with intertidal mudflat MPB biofilms dominated by epipelic (motile) species, we investigated the effect of 10-s and 30-s irradiance steps: two durations commonly used for building RLCs. We compared the performance of 10-s and 30-s RLCs in determining the in situ MPB
photosynthetic activity without dark acclimation and in high irradiances (summer). Although a similar trend of MPB cell photoacclimation was observed using the two procedures, there were differences, revealed by lower values of α-10 s and rETRmax-30 s compared with α-30 s
and rETRmax-10 s on some experimental days (49 and 34%, respectively). Discrepancies
could mainly be explained by the unbalanced QA redox state and the occurrence of
photoprotective non-photochemical quenching (NPQ) present prior to RLC, which impacted the 10-s and 30-s RLCs differently. The initial slope (α) was strongly impacted by NPQ developed prior to RLCs. A correction performed a posteriori and based on the use of the maximum Fm‟ obtained during the course of RLCs was not sufficient to remove the bias of
pre-existing NPQ on the determination of α completely. Consequently, a good, direct and simultaneous determination of rETRmax and α was virtually impossible in situ even when
using RLCs. In contrast to published results from laboratory studies, the shorter irradiance steps (10 s) offers the better (i.e. the most reasonable) compromise for assessing MPB maximum photosynthetic capacity in situ using RLC.
Key words: chlorophyll fluorescence, diatoms, intertidal mudflat, marine ecology, non-photochemical quenching, photoacclimation
1. Introduction
In shallow estuarine ecosystems, the benthic community of microalgae and
cyanobacteria, designated as microphytobenthos (MPB), is a basic component that plays a major role in primary production, nutrient recycling and support of the trophic web
(Underwood and Kromkamp, 1999; Lefebvre et al., 2009). The activity of MPB is highly dynamic and is characterized by large spatial and temporal variability (Herlory et al., 2004; Haubois et al., 2005; Jesus et al., 2005). In order to improve our understanding of the underlying processes driving MPB ecology (Underwood et al., 2000), one of the main
challenges for evaluating in situ MPB features, such as biomass and photosynthetic activity, is to find a way to cope simultaneously with these variations, which occur at very different scales.
Pulse Amplitude Modulation (PAM) chlorophyll a fluorescence has been increasingly applied to MPB in situ to perform such measurements (Perkins et al., 2010a). A special fluorescence methodology, the rapid light response curves (RLCs), has recently been applied to MPB biofilms to assess their photosynthetic activity (e.g. Serodio et al., 2005a). RLCs use short (≤ 30 s) steps of increasing irradiance to determine the relative electron transport rate (rETR) according to irradiance (E) (i.e. rETR/E curves), and to estimate photosynthetic parameters that provide information on the photosynthetic activity, the photoacclimation state of MPB and their driven processes (Serodio et al., 2005a; Perkins et al., 2006; Herlory et al., 2007; Perkins et al., 2010b). The protocols sustaining RLCs proved to be particularly
appropriate for MPB over traditional steady state light curves (SSLCs), for which a steady-state is usually reached at each irradiance step (Perkins et al., 2006; Perkins et al., 2010a). RLCs were primarily used on MPB to limit the effect of upward and downward cell migrations in the sediment during the time course of SSLC development (Perkins et al., 2010a). Later, RLCs became an essential tool to provide a view of the current status of the
photosynthetic apparatus, almost independently of immediate variability resulting from cell migration and irradiance changes, two points of special importance in MPB in situ
investigations (Perkins et al., 2010a). RLCs have been successfully used to study the variability of MPB photosynthetic activity as a function of environmental cues and species assemblage (Serodio et al., 2005a; Underwood et al., 2005). This variability reflects the photoacclimation state (long-term light history) (Perkins et al., 2006) coupled with migration strategy (Mouget et al., 2008; Jesus et al., 2009; Perkins et al., 2010b) and the dynamics of fast photosynthesis regulation via dissipation of excess energy by the non-photochemical quenching (NPQ) mechanism (photoprotection and short-term light history) (Serodio et al., 2005b; Serodio et al., 2008; Van Leeuwe et al., 2008).
Several methodological studies have recently been conducted to improve RLC protocols used on MPB biofilms or benthic diatoms. These include (1) the comparison with SSLCs in the laboratory (Perkins et al., 2006; Serodio et al., 2006a; Herlory et al., 2007), (2) the assessment of light history and NPQ effects on the RLC pattern (Perkins et al., 2006; Serodio et al., 2008), (3) the effect of changing the duration and/or the up- or down-increment of irradiance steps on the determination of photosynthetic parameters (Serodio et al., 2005a; Perkins et al., 2006). Perkins et al. (2006) identified that both the light history of the cells prior to RLC and the light dose accumulation during RLC strongly influence the kinetics of fluorescence emission. They concluded that RLCs with 30 s irradiance steps were better suited for dark-acclimated samples than were RLCs with 10-s irradiance steps. Moreover, dark acclimation before RLCs may induce cell migration in situ (Jesus et al., 2006).
According to Perkins et al. (2010a) dark acclimation could also modify the photoacclimation state of the cells and should be avoided in order to standardise methodologies. Serodio et al. (2005a) showed that when the cells were light-acclimated (constant irradiance of 150 µmol photons m-2 s-1), there was no difference in the initial slope of the RLC () whatever the
irradiance step (10 s, 20 s or 40 s) and a small increase of the maximum relative electron transport rate (rETRmax) was only observed when using 40 s. However, these studies were conducted ex situ with non-natural irradiances on either sediment cores containing active MPB (Serodio et al., 2005a), reconstituted biofilm (Herlory et al., 2007) or algal suspensions (Perkins et al., 2006).
The aim of our work was to make in situ comparisons between different durations of RLC irradiance steps on mudflat MPB biofilms and to weigh up their impact on the
subsequent determination of photosynthetic parameters. The rationale behind this study is that in situ conditions of tide, irradiance and temperature, which are difficult to reproduce in the laboratory, affect the recent light history of MPB cells and their photoacclimation state, thus putting into question the validity of conclusions on irradiance steps of RLCs from studies performed ex situ (Perkins et al. 2006). For the purpose of the present study, 10-s and 30-s RLCs were performed on light-acclimated biofilms in the field. Irradiance steps of 10 s and 30 s are the most commonly used durations for RLCs in MPB in situ studies (e.g.Mouget et al., 2008; Serodio et al., 2008; Perkins et al., 2010b). The experiments were run within 1 hour before the end of the diurnal emersion period on several consecutive days in summer to provide changes in irradiance, light dose and light history of MPB cells.
2. Material & Methods
2.1. Study site and measurement of environmental conditions
The study was completed on the Brouage intertidal mudflat located in Marennes-Oléron bay on the French Atlantic coast (45°54‟50‟‟N, 01°05‟25‟‟W) during six consecutive days in 2008 between the 13 and the 18 July. Sediment type is fine mud with a mean grain size < 10 µm (Haubois et al., 2005). In July, the MPB at the site is usually composed of around a dozen species of epipelic diatoms, largely dominated by three species: Navicula
phyllepta (about 45% of the relative abundance), Amphora coffeaeformis (20%) and N. digitoradiata (10%) (Haubois et al., 2005). Irradiance and temperature and were measured and recorded every 5 min using a Li-1000 data recorder coupled to a Li-192 quantum sensor and a temperature probe (LI-COR, Lincoln, USA). Environmental conditions are presented in Table 1. RLCs were performed at the end of the diurnal emersion period (1 hour before immersion) so that the time was different from one day to another (semi-diurnal tide).
2.2. Rapid light response curves (RLCs)
Variable chlorophyll a fluorescence was measured using a Pulse Amplitude
Modulation (PAM) fluorimeter including a PAM-control unit and a WATER-EDF-universal emitter-detector unit (Walz, Effeltrich, Germany). This apparatus is equipped with a
modulated blue light (LEDs with maximum emission at 450 nm), which serves as the same light source for the measuring beam, and the actinic and saturating lights. Irradiances were calibrated against a quantum sensor (LI-COR Li 190) at a distance of 2 mm. The PAM fiber optic probe was placed carefully at 2 mm from the MPB biofilms, using a 4 cm diameter ring to isolate the sample from natural irradiance. It was maintained during the RLCs using a burette holder fixed on a base buried in the first 20 cm of sediment. Replicates were chosen randomly within an area of one square metre. An estimation of the effective quantum yield of PSII (F/Fm‟) was measured few seconds after positioning the probe (Serodio et al., 2008), by
applying a saturating flash of 800 ms at around 3800 µmol photons m-2 s-1. RLCs were then constructed by exposing the MPB biofilms to eight steps of increasing irradiance without prior dark acclimation (around 70, 100, 150, 220, 310, 430, 710, 1050 µmol photons m-2 s-1). The duration of the irradiance steps was 10 s or 30 s. Each experimental day, three replicates of each treatment were randomly performed in turn. The relative Electron Transport Rate (rETR) was calculated at each level of irradiance, as the product of the effective quantum
yield of PSII and the delivered irradiance: rETR=F/Fm‟ x E. The maximum quantum
efficiency (Fv5/Fm5) was conveniently estimated after 5 min dark acclimation at the end of the
10–s RLCs, to balance for the overall elapsed time of each RLC, longer for 30-s than for 10-s irradiance steps. For each experimental day, the whole process, which included six RLCs plus three 5 min dark acclimation periods and corresponding manipulation lasted between 32 and 50 min. Kinetics of NPQ development or relaxation during the RLC were calculated as suggested by Serodio et al. (2005b): NPQ= (Fm‟m-Fm‟)/Fm‟ where Fm‟m is the maximum Fm‟
value higher than the Fm that is measured during the RLCs. In order to compare the kinetics of
NPQ during both 10-s and 30-s RLCs, values were standardized between 0 and 1 by normalizing to Fm‟,m (hereafter named „relative NPQ‟, rNPQ).
2.3. Statistics
The light response of rETR (rETR/E) curves were constructed using the model of Eilers and Peeters (1988). This model allowed us to estimate the maximum rETR (rETRmax),
which is the asymptote of the curve; the maximum light use efficiency (), which is the slope at the beginning of the curve; and the light saturation coefficient (EK), calculated as (rETRmax
/ ). Curve fitting was achieved using the downhill simplex method of the Nelder-Mead model, and standard deviation of parameters was estimated by an asymptotic method. All fittings were tested by analysis of variance (P < 0.001), residues being tested for normality and homogeneity of variance, and parameter significance by Student‟s t-test (P < 0.05). Comparisons of RLCs and photosynthetic parameters were performed using the method of Ratkowski (1983) for non-linear models. All the curve fitting processes and associated statistics were coded under MATLAB R2008b.
The rNPQ light response curves (rNPQ/E curves) were constructed using a combination of two exponential models varying between 0 and 1:
) d E c exp( 1 1 ) b E a exp( 1 1 1 rNPQ
where a and c are the rates of rNPQ decrease and increase, respectively, and b and d are the half saturation parameters of the decreasing and increasing part of the curve, respectively. Curve fitting was also done using the downhill simplex method of the Nelder-Mead model and comparisons of rNPQ/E curves and parameters were performed here as well (see above).
3. Results
3.1. Irradiance, effective quantum yield of PSII and maximum quantum efficiency of MPB biofilm
The semi-diurnal tidal regime that the mudflat was exposed to during the period of study (from the 13 to 18 July 2009) provided different conditions for both irradiance and the cumulative light dose (Table 1). The duration of the diurnal emersion was around 4.5 h. The mean irradiance increased with consecutive days, with the sampling time gradually getting closer to noon. Consequently, the temperature at the sub-surface of the sediment increased from 15°C to more than 23°C. The cumulative light dose also increased during the first three days and then stabilized. Irradiance just prior to RLCs was high, varying from 1447 to 1886 µmol photons m-2 s-1 over the six-day survey period and the mean irradiance during the whole diurnal emersion varied from 661 to 1584 µmol photons m-2 s-1. The effective quantum yield of PSII (F/Fm‟) drastically decreased with increasing irradiance. The maximum quantum
efficiency (Fv5/Fm5) followed the same pattern during the first three days before stabilizing
around 0.45 during the second half of the monitoring.
Significant differences were found between the rETR/E curves with either 10-s or 30-s irradiance step (Ratkowski test for non linear models; P < 0.001), with the exception of 14 July (P > 0.069) (Fig. 1). For 13 and 18 July, the maximum relative electron transport rate (rETRmax) was significantly lower for 30-s RLCs (Fig. 2A) while the maximum light use
efficiency () was no different. For 15, 16 and 17 July, was significantly lower for 10-s RLCs (Fig 2B), while there was no difference for rETRmax whatever the treatment. Only on
the first day (13 July) was a marked down-regulation observed in the rETR/E curve. For both treatments, rETRmax increased with irradiance on the first three days and decreased during the
second half of the monitoring, as the irradiance reached a maximum (see Table 1). The parameter decreased by 60-65% with increasing irradiance and stabilized during the last three days. There was no significant linear relationship between and rETRmax whatever the
treatment (P > 0.05). EK followed the opposite pattern to (Fig. 2C).
3.3. Photoprotective non-photochemical quenching, NPQ
The maximum NPQ (NPQmax) displayed by MPB during the course of each RLC was
significantly higher when the duration of the irradiance steps was 30 s compared with 10 s (ANCOVA, P < 0.05; Table 1). For both treatments, NPQmax decreased with increasing
irradiance prior to the RLCs (P < 0.001, n = 48, Fig. 3). In order to directly compare the kinetics of NPQ development or relaxation during both 10-s and 30-s RLCs, we calculated the relative NPQ (rNPQ) after normalization to the maximum Fm‟ (Fm‟m) displayed during each
RLC (see Fig. 3). The rNPQ displayed two different patterns and changed gradually from one to another depending on whether the treatment was 10 s or 30 s (Fig. 3). On 13 July, the development of the rNPQ followed a classical shape for both treatments i.e., a sigmoidal increase in the development of NPQ with no relaxation phase for the lowest irradiance of the RLCs (Lavaud et al., 2002b; Lavaud, 2007; Cruz and Serodio, 2008). The minimum rNPQ
(rNPQmin) was observed at the lowest and developed exponentially from about 250 µmol
photons m-2 s-1 to reach a maximum (rNPQmax) at the highest irradiance of the RLCs. No
relaxation occurred at the lowest irradiance of the RLCs. On 14 July, while the trend of rNPQ development was the same for the 10 s treatment, even though it was faster than the previous day, it was different for the 30 s-RLC following a U-shaped pattern as a function of
irradiance. Indeed, rNPQ was already developed prior to the RLC, it then relaxed to a
minimum up to 400 µmol photons m-2 s-1 to develop once more, finally reaching a maximum value at the highest irradiance. This pattern of difference between 10 s- and 30 s-RLCs is inferred from the fact that Fm‟m was not reached at the same irradiance step during the RLC
due to a different cumulative light dose resulting from 10-s or 30-s duration. During the following days, the two treatments showed the same U-shaped pattern with NPQ relaxation in the first part of the RLC higher than the NPQ development that occurred in the second part (i.e. for higher irradiance). The irradiance at which rNPQmin was observed increased with EK
from a day to another (see Fig. 2C) until a plateau was reached. In contrast to 30-s RLC on the 14 July and for both treatments on 13 July, rNPQmax was observed at the lowest
irradiance whatever the treatment. Finally, the relaxation of rNPQ at the beginning of RLCs increased with lower irradiances for the 30 s-RLCs.
4. Discussion
4.1. Physiological basis for the differences in photosynthetic parameters determined under different RLC irradiance step durations
The Rapid Light Curve (RLC) methodology applied to microphytobenthos (MPB) is based on a paradox: RLCs aim to determine the photoacclimation state of microalgal cells, but they also generate a dynamic phase of regulation/acclimation during the RLC, due to the
cumulative actinic light dose, which is function of the duration of the irradiance step
increments. On the one hand, short-term changes in regulation/acclimation states induced by RLC methodology can be visualized, but on the other hand, they are by nature limited in comparison with those occurring in steady state light curves (SSLCs). Although the general trends of photoacclimation were similar whatever the duration of the irradiance step
increments (10 s or 30 s), duration clearly influenced the pattern of RLCs and the absolute values of photosynthetic parameters extracted. The differences between the 10-s and 30-s RLCs were observed throughout the six days of monitoring, independently of the light dose the MPB was exposed to prior to the RLCs. According to Perkins et al. (2006), the light history of the cells prior to RLC, which governs their photoacclimation capacity, and the cumulative light dose during the RLC are key factors for explaining the discrepancy in the determination of photosynthetic parameters when the duration of irradiance steps differs. The cumulative light dose effect is based on two fast photo-chemical and photo-protective
processes: the reoxidation of QA and the development of NPQ.
Perkins et al. (2006) proposed that the primary misleading source for the
determination of photosynthetic parameters of RLCs with 10-s light steps is the dynamic and incomplete reoxidation of QA from the irradiance increment n to n+1 and so on. It generates
the non steady-state accumulation of reduced electron acceptors down to the PSII during the course of the RLC and this has a growing impact on the higher irradiance increments. It ultimately leads to the underestimation of rETRmax and potentially α in the case of very slow
QA reoxidation. This is especially true when the electron transfer between QA and QB is
slowed down because of environmental stresses (light or nutrient stress, herbicide exposure, etc.) (Materna et al., 2009). This proposal was based on different studies performed on benthic diatoms acclimated to low irradiance or darkness for various periods prior to RLC measurements (Perkins et al., 2006; Cruz and Serodio, 2008). However, the differences in
rETRmax determined after 10 s and 30 s (and also for longer durations) are lower and are even
nearly eliminated when the cells have been previously acclimated to higher continuous irradiance (Serodio et al., 2005b; Perkins et al., 2006). We effectively did not observe any significantly lower values of rETRmax for the 10-s RLCs compared to the 30-s RLCs in MPB acclimated to high and variable irradiances in situ. This can be explained by a modification of the stochiometry PSII : Cytochrome b6/f : PSI, leading to an increase in the number of
electron acceptors down to the PSII and a higher PSI cyclic electron activity, which would accelerate the reoxidation of QA (Kotakis et al., 2006). The second possibility could be an
increase in the extent of the PSII electron cycle. This mechanism deviates electrons from their linear course down to QB and decreases the probability of QA over-reduction (Lavaud et al.,
2002a; Lavaud, 2007). These two features were recently reported in PSII mutants of diatoms showing an impaired ETR (Materna et al., 2009), supporting the hypothesis it could also occur in situ in natural MBP biofilm composed of benthic diatoms exposed to very high irradiances and showing a rETR decrease (see Fig. 2A).
The cumulative light dose during the RLC itself can lead to the fast development of photoprotective NPQ triggered by the build-up of the transthylakoid ΔpH and the xanthophyll cycle (so-called qE) (Serodio et al., 2005b; Lavaud, 2007). NPQ can influence the pattern of RLCs when the irradiance steps are equal to or longer than 30 s (Perkins et al., 2006). The quenching of chlorophyll fluorescence generated by the NPQ mechanism disturbs the acquisition of the effective quantum yield of PSII (ΔF/Fm‟) (Herlory et al., 2007) and the
subsequent calculation of rETR, leading to its underestimation (Perkins et al., 2006). This is especially true for diatoms, which can develop large NPQ (Lavaud et al., 2002b; Lavaud, 2007; Serodio et al., 2008) as their potential increases with the irradiance (Schumann et al., 2007; Cruz and Serodio, 2008). Such a situation was observed during the second half of our monitoring, when the irradiance was the highest. NPQ was high, the acquisition of ΔF/Fm‟
was obviously disturbed as it was very low, while Fv5/Fm5 remained stable (see Table 1) and
rETRmax was ultimately lower for 30 s-RLCs (18th of July). rETRmax determined with 30
s-RLCs was also underestimated when such conditions did not occur (the first day). In this case, rETRmax was reduced, probably because of the fluorescence quenching generated by excess
light photoinhibitory damage (so-called qI). The decrease of rETRmax was observed for both
10-s and 30-s increments, and was more accentuated for 30 s-RLCs because of the higher cumulative light dose.
NPQ also strongly influences the determination of α (Serodio et al., 2006a; Cruz and Serodio, 2008) by potentially generating its underestimation when the length of the RLC irradiance steps is too short (i.e. 10 s compared to 30 s) (Perkins et al., 2006). This is crucial when diatoms are exposed to excess irradiance resulting in a sustained NPQ, as during our monitoring (apart from the first day); so that when the RLC starts, rNPQ is already at its maximum. For an accurate determination of α, NPQ needs to be relaxed. In diatoms, the relaxation of NPQ in the dark can last a long time because of the slow reversion of the xanthophyll cycle operation (Lavaud et al., 2007; Perkins et al., 2010b). It is accelerated by switching the cells to low irradiance (Serodio et al., 2005a; Goss et al., 2006). In our conditions, NPQ relaxed during the first low irradiance steps of RLCs; the longer the
irradiance step, the faster the relaxation. Thus, NPQ relaxation was thus always faster for the 30 s-RLCs and α was systematically lower for the 10-s RLCs. Results differed on the last day since NPQmax was similar for both 10-s and 30-s increments and the NPQ relaxation at the
beginning of RLCs did not show significant difference. The very high irradiances observed on the last day probably resulted in a preponderant behavioural photoacclimation strategy (i.e. cell micro-cycling and downward migrations), in contrast to physiological photoacclimation (i.e. NPQ) (Serodio et al., 2006b; Mouget et al., 2008; Perkins et al., 2010b). Downward cell migration has been shown to be an essential behaviour that MPB cells use to cope with high
and photoinhibitory irradiances during emersion (Mouget et al., 2008; Perkins et al., 2010b). To our best knowledge, no studies have investigated the effect of MPB cell micro-migration during RLCs on the determination of photosynthetic parameters. Indeed, only a few of them were conducted on sediment containing migratory MPB (Serodio et al., 2005a; Herlory et al., 2007). Notably, Underwood et al. (2005) observed that specific diversity changes due to migration could occur in the MPB community at high irradiances of the rETR/E curves when using a 3 min irradiance step. Here, the longest RLCs lasted 4 min (8 steps of 30 s). In these conditions, and although RLCs were primarily used to prevent MPB cell migration, it cannot be totally ruled out. Cell migration could explain the differences observed between 10-s and 30-s treatments for the highest irradiances of the RLCs on 13 and 18 July. On 13 July
particularly, it is probable that early in the morning the MPB community was enriched in low light-acclimated cells that were not able to cope with the 30-s step of highest irradiances. They therefore possibly migrated down, which generated a decrease in rETR.
4.2. Comparison of RLCs with different duration of irradiance steps due to the constraints of field work
In our study, the high irradiance that the MPB was exposed to leads to opposite effects of the QA redox state and extent of NPQ on the determination of photosynthetic parameters.
Additionally, the hierarchy of the impact of these two processes changed depending on the duration of the irradiance step increments of RLCs (Fig. 4). In summary, for 10-s duration, the unbalanced redox state of QA from an irradiance step to another is the most influential in
diatoms acclimated to low irradiance (as generally found in laboratory conditions, Perkins et al., 2006, Herlory et al., 2007). It is important to underline that, independently from any field constraints for any sequential light curves (whatever the technique used: oxymetry, 14C incorporation or modulated fluorimetry), the same processes (redox changes at QA and NPQ
relaxation/development) happen and could also be considered, with the exception of their dynamic phase. If RLCs are used to perform light curves, NPQ influence becomes significant under high irradiance (as generally found in situ) because of its development prior to the RLC, and of the balance between its relaxation during the first initial low irradiance steps, and its development during the highest irradiance steps of the RLC. For 10-s RLCs, pre-existing NPQ, present prior to the RLC is crucial, as it cannot be fully relaxed during the first
irradiance steps because they are too short. For 30-s RLCs, the most influential process is the NPQ that develops during RLC as the relaxation of NPQ present prior to RLC and the reoxidation of QA occur. The influence of NPQ is accentuated by the acclimation of the
diatoms to higher light doses, as for in situ conditions (a noticeable effect is observed only with 50-60 s treatment in laboratory conditions, Perkins et al., 2006; Herlory et al., 2007). In these conditions, NPQ present prior to RLC is better relaxed because of the longer duration of initial low irradiance steps, which ultimately leads to a better estimation of α for 30 s, in contrast to 10-s increments. If the light dose is moderate (i.e., in winter/spring or on a cloudy day) the balance between the effects of change in QA redox state and NPQ
relaxation/development on the determination of rETRmax and α would be modified, but its dynamics certainly depend on the photoacclimation state of the cells.
Two strategies could be proposed to remove these drawbacks inherent to RLC
methodology. From a purely technical point of view, an initial non-academic approach would be to perform a first 10-s RLC, followed by a short (5 min) low irradiance or far-red exposure (Jesus et al., 2006), then by a 10-s RLC including only the lowest irradiance. The first RLC would provide a good estimation of rETRmax, while the second would provide estimation of α
after relaxation of NPQ. Nevertheless, two major criticisms can be made to this
unconventional protocol. Its length, plus the low/far-red light period, would most probably generate the downward migration of MPB, the RLC methodology is supposed to counteract.
Additionally, it would reduce the possibility of performing a maximum of replicates during the emersion period. As an alternative, we checked the possibility of improving the
determination of α both for 10-s and 30-s RLC a posteriori. In diatoms, low irradiance is a more efficient way to relax NPQ than dark acclimation (Serodio et al., 2005a; Goss et al., 2006). Using this characteristic, we hypothesize that Fm‟m values measured during RLCs after
the initial relaxation of NPQ were the closest to Fm. This hypothesis is strengthened by the
fact that Fm‟m was usually reached for two consecutive light levels, in most cases for 30 s
RLCs (but for 18 July, Fig 3). We then replaced the lower values of Fm‟ recorded for lower
values of irradiance by the value of Fm‟m in each RLC. The initial slope of the RLC was then
re-estimated. Values of the parameter α were improved by this approach, which allowed us to partially counteract the impact of NPQ (Fig. 5). The parameter α increased by 43 to 169% and by 37 to 74% for 10 s and 30 s, respectively. Moreover, this correction was neutral for RLCs without a preliminary phase of NPQ relaxation (13 July, and 14 July for 10 s only). However, this correction was not as efficient for 10 s as for 30 s and most probably the influence of pre-existing NPQ present prior to the RLC was not fully removed for 30-s RLCs. For this reason, regarding irradiance step duration for RLC methodology, although a shorter irradiance step is not the ultimate objective for MPB studies in situ, it is the best compromise, especially when field constraints and MPB behaviour are taken into account.
Acknowledgments
This work was supported by the French ANR (National Research Agency) through the VASIREMI project “Trophic significance of microbial biofilms in tidal flats” (contract ANR-06-BLAN-0393-01). The authors are grateful to the scientific community of VASIREMI with special thanks to Christine Dupuy, Brenda Waqueteux and Katell Guizien for their support during this study. We are embedded to Dany Prevostat (Aeroglisseurs Services) for technical support during the field survey. Finally, we thank two anonymous reviewers for their
References
Cruz, S., Serodio, J., 2008. Relationship of rapid light curves of variable fluorescence to photoacclimation and non-photochemical quenching in a benthic diatom. Aquat. Bot. 88, 256-264.
Eilers, P.H.C., Peeters, J.C.H., 1988. A model for the relationship between light intensity and the rate of photosynthesis in phytoplankton. Ecol. Model. 42, 199-215.
Goss, R., Pinto, E.A., Wilhelm, C., Richter, M., 2006. The importance of a highly active and delta pH-regulated diatoxanthin epoxidase for the regulation of the PSII antenna function in diadinoxanthin cycle containing algae. J. Plant Physiol. 163, 1008-1021. Haubois, A.G., Sylvestre, F., Guarini, J.M., Richard, P., Blanchard, G.F., 2005.
Spatio-temporal structure of the epipelic diatom assemblage from an intertidal mudflat in Marennes-Oleron Bay, France. Estuar. Coast. Shelf Sci. 64, 385-394.
Herlory, O., Richard, P., Blanchard, G.F., 2007. Methodology of light response curves:
application of chlorophyll fluorescence to microphytobenthic biofilms. Mar. Biol. 153, 91-101.
Herlory, O., Guarini, J.M., Richard, P., Blanchard, G.F., 2004. Microstructure of
microphytobenthic biofilm and its spatio-temporal dynamics in an intertidal mudflat (Aiguillon Bay, France). Mar. Ecol. Progr. Ser. 282, 33-44.
Jesus, B., Brotas, V., Marani, M., Paterson, D.M., 2005. Spatial dynamics of
microphytobenthos determined by PAM fluorescence. Estuar. Coast. Shelf Sci. 65, 30-42.
Jesus, B., Perkins, R.G., Mendes, C.R., Brotas, V., Paterson, D.M., 2006. Chlorophyll fluorescence as a proxy for microphytobenthic biomass: alternatives to the current methodology. Mar. Biol. 150, 17-28.
Jesus, B., Brotas, V., Ribeiro, L., Mendes, C.R., Cartaxana, P., Paterson, D.M., 2009. Adaptations of microphytobenthos assemblages to sediment type and tidal position. Cont. Shelf Res. 29, 1624-1634.
Kotakis, C., Petropoulou, Y., Stamatakis, K., Yiotis, C., Manetas, Y., 2006. Evidence for active cyclic electron flow in twig chlorenchyma in the presence of an extremely deficient linear electron transport activity. Planta 225, 245-253.
Lavaud, J., 2007. Fast regulation of photosynthesis in diatoms: Evolution, regulation and ecophysiology. Funct. Plant Sci. Biotechnol. 1, 267-287.
Lavaud, J., van Gorkom, H.J., Etienne, A.-L., 2002a. Photosystem II electron transfer cycle and chlororespiration in planktonic diatoms. Photosynth. Res. 74, 51-59.
Lavaud, J., Strzepek, R.F., Kroth, P.G., 2007. Photoprotection capacity differs among diatoms: Possible consequences on the spatial distribution of diatoms related to fluctuations in the underwater light climate. Limnol. Oceanogr. 52, 1188-1194. Lavaud, J., Rousseau, B., van Gorkom, H.J., Etienne, A.L., 2002b. Influence of the
diadinoxanthin pool size on photoprotection in the marine planktonic diatom Phaeodactylum tricornutum. Plant Physiol. 129, 1398-1406.
Lefebvre, S., Marín Leal, J.C., Dubois, S., Orvain, F., Blin, J.L., Bataillé, M.P., Ourry, A., Galois, R., 2009. Seasonal dynamics of trophic relationships among co-occurring suspension-feeders in two shellfish culture dominated ecosystems. Estuar. Coast. Shelf Sci. 82, 415-425.
Materna, A.C., Sturm, S., Kroth, P.G., Lavaud, J., 2009. First induced plastid genome mutations in an alga with secondary plastids: psbA mutations in the diatom Phaeodactylum tricornutum (Bacillariophyceae) reveal consequences on the regulation of photosynthesis. J. Phycol. 45, 838-846.
Mouget, J.L., Perkins, R., Consalvey, M., Lefebvre, S., 2008. Migration or photoacclimation to prevent high irradiance and UV-B damage in marine microphytobenthic
communities. Aquat. Microb. Ecol. 52, 223-232.
Perkins, R.G., Mouget, J.L., Lefebvre, S., Lavaud, J., 2006. Light response curve
methodology and possible implications in the application of chlorophyll fluorescence to benthic diatoms. Mar. Biol. 149, 703-712.
Perkins, R.G., Kromkamp, J.C., Serodio, J., Lavaud, J., Jesus, B., Mouget, J.L., Lefebvre, S., Forster, R.M., 2010a. Chapter 12. The application of variable fluorescence to
microphytobenthic biofilms. In: Suggett, D., Borowitzka, M.A., Prasil, O. (Eds.), Chlorophyll a fluorescence in aquatic sciences: Methods and applications. Springer Science + Business Media, pp. 500.
Perkins, R.G., Lavaud, J., Serodio, J., Mouget, J.L., Cartaxana, P., Rosa, P., Barillé, L.,
Brotas, V., Jesus, B., 2010b. Vertical cell movement is a primary response of intertidal benthic biofilms to increasing light dose. Mar. Ecol. Progr. Ser. 416, 93-103.
Ratkowski, D.A., 1983. Non linear regression modeling. A unified practical approach. Marcel Dekker, INC, New-York, 276 pp.
Schumann, A., Goss, R., Jakob, T., Wilhelm, C., 2007. Investigation of the quenching efficiency of diatoxanthin in cells of Phaeodactylum tricornutum (Bacillariophyceae) with different pool sizes of xanthophyll cycle pigments. Phycologia 46, 113-117. Serodio, J., Vieira, S., Cruz, S., 2008. Photosynthetic activity, photoprotection and
photoinhibition in intertidal microphytobenthos as studied in situ using variable chlorophyll fluorescence. Cont. Shelf Res. 28, 1363-1375.
Serodio, J., Vieira, S., Cruz, S., Barroso, F., 2005a. Short-term variability in the
photosynthetic activity of microphytobenthos as detected by measuring rapid light curves using variable fluorescence. Mar. Biol. 146, 903-914.
Serodio, J., Cruz, S., Vieira, S., Brotas, V., 2005b. Non-photochemical quenching of chlorophyll fluorescence and operation of the xanthophyll cycle in estuarine microphytobenthos. J. Exp. Mar. Biol. Ecol. 326, 157-169.
Serodio, J., Vieira, S., Cruz, S., Coelho, H., 2006a. Rapid light-response curves of chlorophyll fluorescence in microalgae: relationship to steady-state light curves and
non-photochemical quenching in benthic diatom-dominated assemblages. Photosynth. Res. 90, 29-43.
Serodio, J., Coelho, H., Vieira, S., Cruz, S., 2006b. Microphytobenthos vertical migratory photoresponse as characterised by light-response curves of surface biomass. Estuar. Coast. Shelf Sci. 68, 547-556.
Underwood, A.J., Chapman, M.G., Connell, S.D., 2000. Observations in ecology: you can‟t make progresses without understanding the patterns. J. Exp. Mar. Biol. Ecol. 250, 97-115.
Underwood, G.J.C., Kromkamp, J.C., 1999. Primary production by phytoplankton and microphytobenthos in estuaries. Adv. Ecol. Res. 29, 93-154.
Underwood, G.J.C., Perkins, R.G., Consalvey, M.C., Hanlon, A.R.M., Oxborough, K., Baker, N.R., Paterson, D.M., 2005. Patterns in microphytobenthic primary productivity: Species-specific variation in migratory rhythms and photosynthetic efficiency in mixed-species biofilms. Limnol. Oceanogr. 50, 755-767.
Van Leeuwe, M.A., Brotas, V., Consalvey, M., Forster, R.M., Gillespie, D., Jesus, B., Roggeveld, J., Gieskes, W.W.C., 2008. Photoacclimation in microphytobenthos and the role of xanthophyll pigments. Eur. J. Phycol. 43, 123-132.
Figure captions
Fig. 1. Rapid light response curves (RLCs) of the relative electron transport rate (rETR) of in
situ microphytobenthos (MPB) biofilm of the Brouage mudflat between 13and 18 July 2008. RLCs were run with either 10-s or 30-s light step increments. The curves were constructed using the Eilers and Peeters (1988) model. Significant differences between the treatments were determined using the method of Ratkowski (1983) for non linear models (P values are indicated). Values are mean ± SD of three independent measurements
Fig. 2. Photosynthetic parameters extracted from rETR/E curves (Fig. 1). Significant
differences between the treatments were determined using the method of Ratkowski (1983) for non linear model (n.s. non significant * P<0.05 **P<0.01 ***P<0.001)
Fig. 3. Relative non-photochemical quenching of fluorescence (rNPQ) developed during each
RLC. On some occasions, symbols of the two treatments are surimposed. NPQ values were normalized to the maximum NPQ observed (see Fig. 3). Values are mean ± SD of three independent measurements. The curves were constructed using the equation given in the Material and Methods, statistics section. Significant differences between the treatments were determined using the method of Ratkowski (1983) for non linear models (P values are indicated)
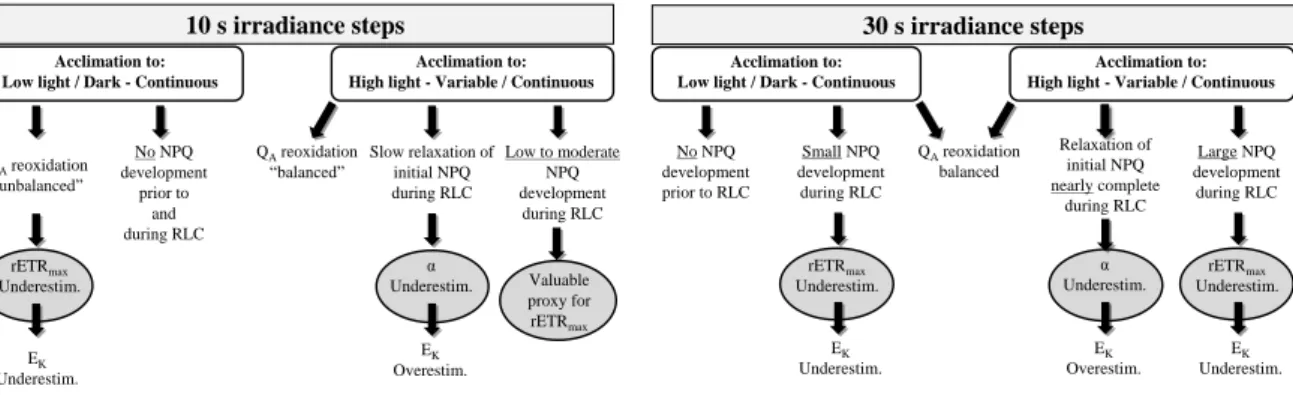
Fig. 4. Diagram of the influence of the duration of RLC irradiance steps, the light acclimation
prior to RLC and the photo-chemical/-protective processes (QA redox state and NPQ) on the
determination of photosynthetic parameters (rETRmax, α and EK) of a motile
diatom-dominated biofilm. Data summarized from Perkins et al. (2006) and this study. See the text for further details
Fig. 5. Re-estimation of α (maximum light use efficiency) using a posteriori corrections of
Fm‟ signals of Rapid Light Curves (RLCs; see Material and Methods section). Grey symbols
Table 1
Temperature, light environment and photosynthetic capacity of the microphytobenthos biofilm on the Brouage mudflat, Marennes-Oléron bay, July 2009. The duration of the emersion was around 4.5 h (semi-diurnal tide). Measurement time indicates the beginning and the end of the six RLCs measurements (three replicates of 10-s and 30-s light-step RLCs randomly displayed) plus the three 5 min dark acclimations (for more details see materials and methods section). RLCs were performed at the end of the diurnal emersion period (1 hour before the immersion) so that the time was different from a day to another. Values are mean ± SD of three independent measurements.
Date (July) Measurement time ( h GMT) T (°C) Light dose (mol photons m-2) Mean irradiance during the 4.5 h emersion (µmol photons m-2 s-1)
Irradiance just prior to each RLC (µmol photons m-2 s-1) F/Fm‟ Fv5/Fm5 NPQmax (10s) NPQmax (30s) 13 07:14/07:55 15.3 ± 0.1 8.1 661.1 (0-1512) 1447.2 (1360-1512) 0.58 ± 0.04 0.63 ± 0.01 0.45±0.11* 1.60±0.18* 14 08:03/08:53 18.3 ± 0.4 15.8 1009.4 (0-1597) 1548.2 (1516-1575) 0.46 ± 0.10 0.53 ± 0.05 0.44±0.07* 0.53±0.06* 15 09:28/10:00 21.6 ± 0.1 22.1 1361.0 (647-1745) 1703.6 (1674-1735) 0.31 ± 0.04 0.49 ± 0.04 0.19±0.06 0.52±0.25 16 10:08/10:58 23.5 ± 0.2 25.6 1499.7 (977-1850) 1807.6 (1760-1838) 0.14 ± 0.08 0.43 ± 0.06 0.15±0.07 0.41±0.06 17 10:59/11:37 21.6 ± 0.2 25.2 1457.2 (636-1885) 1797.2 (1552-1881) 0.33 ± 0.24 0.43 ± 0.02 0.18±0.01 0.71±0.07 18 11:40/12:17 22.2 ± 0.1 28.4 1583.8 (443-1888) 1886.5 (1884-1886) 0.21 ± 0.06 0.47 ± 0.04 0.13±0.02 0.29±0.18
T, temperature; PPFD, F/Fm‟, effective quantum yield of PSII; Fv5/Fm5, maximum quantum efficiency measured after 5 min dark acclimation;
Figure 4 10 s irradiance steps QAreoxidation “unbalanced” rETRmax Underestim. Slow relaxation of initial NPQ during RLC α Underestim. Acclimation to: Low light / Dark - Continuous
Acclimation to: High light - Variable / Continuous
QAreoxidation “balanced” EK Underestim. EK Overestim. Low to moderate NPQ development during RLC Valuable proxy for rETRmax No NPQ development prior to and during RLC 30 s irradiance steps No NPQ development prior to RLC Relaxation of initial NPQ nearly complete during RLC α Underestim. Acclimation to: Low light / Dark - Continuous
Acclimation to: High light - Variable / Continuous
QAreoxidation balanced EK Overestim. Large NPQ development during RLC rETRmax Underestim. EK Underestim. Small NPQ development during RLC rETRmax Underestim. EK Underestim.