HAL Id: hal-01418159
https://hal.archives-ouvertes.fr/hal-01418159
Submitted on 16 Dec 2016HAL is a multi-disciplinary open access archive for the deposit and dissemination of sci-entific research documents, whether they are pub-lished or not. The documents may come from teaching and research institutions in France or abroad, or from public or private research centers.
L’archive ouverte pluridisciplinaire HAL, est destinée au dépôt et à la diffusion de documents scientifiques de niveau recherche, publiés ou non, émanant des établissements d’enseignement et de recherche français ou étrangers, des laboratoires publics ou privés.
Models for evaluating the saturation in Liquid
Composites Molding: a numerical journey
Francisco Chinesta, Ll Gascon, Juan Antonio Garcia
To cite this version:
Francisco Chinesta, Ll Gascon, Juan Antonio Garcia. Models for evaluating the saturation in Liquid Composites Molding: a numerical journey. 9e Colloque national en calcul des structures, CSMA, May 2009, Giens, France. �hal-01418159�
Models for evaluating the saturation in LCM: a
numerical journey
F. Chinesta
1, Ll. Gascon
2, J.A. Garcia
21
EADS Corporate Foundation International Chair - GEM UMR CNRS ECN 1 rue de la Noe, BP 92101, F-44321 Nantes cedex 3, France
2
Universidad Politecnica de Valencia Camino de vera s/n, E-46071 Valencia, Spain
1
Introduction
Liquid Composites Molding (LCM) processes are based on a proper resin impregnation of the reinforcement. Modeling and simulation play an important role in the development and optimization of molds production and in devising appropriate resin injection strategies. Minimization of mold filling time without losing part quality is an important issue in Resin Transfer Molding (RTM). Inadequate injection strategies tend to create macro and micro-voids in the part, the formation of which depends on fluid flow velocity.
Over the last decades, different numerical techniques have been used to model the mold filling process in RTM. In general, RTM process simulation requires an accurate treatment of the advection equation which governs the evolution of different fluid properties: fluid presence function, incubation time, temperature, concentration of reacting components, degree of saturation, etc. In some of our former works [1][2] we proposed a new procedure to integrate accurately the transport of different fluid properties. In this work, that numerical procedure is extended for solving the transport equation governing the evolution of the saturation. In this model the permeability is assumed to be a function of saturation [3], and then the continuity equation that governs the pressure distribution, includes a source term which depends on the saturation. The presence of this source term explains the quadratic spatial pressure distribution in an unsaturated porous medium noticed in unidirectional flows. To derive a closed model the saturation equation is considered, whose source term depends on the micro and macro voids content.
Abstract – The main aim of this work is the proposal of a numerical procedure for solving the
saturation equation in RTM process simulation. In order to analyze in more detail the progressive impregnation of a fibrous preform by a fluid resin, the numerical model here proposed considers the flow through a partially saturated medium, including the dependence of permeability on the saturation degree. The main numerical issues will be discussed.
2
Governing equations
The model which describes the mould filling process is given by Darcy´s law:
, rel s K v p
µ
= − ∇ (1)where v is the velocity field, p is the pressure, K is the preform permeability tensor, µ is the
fluid viscosity, and Krel s, denotes the relative permeability with respect to the saturated one. This modified Darcy law should be combined with the continuity equation, which should account for the loss of resin due to the perform impregnation. This can be done by incorporating a source term in the mass balance equation
S v t
φ
∂ ∇⋅ = − ∂ (2)where φ is the porosity and S the degree of saturation. In order to evaluate the permeability, we
make use of the model proposed by Breard et al. [3] for predicting void formation in LCM. Then, the permeability in Darcy’s law should be considered as the product of the geometrical permeability, KSat, and a relative permeability Krel (S),
( )
( )
,
rel S rel Sat
K
S
=
K
S K
(3)where the relative permeability depends on the saturation degree
1/ 1/
( )
(1
)
rel S SK
S
=
−
R
βS
+
R
ββ( )
1
S relR
≤
K
S
≤
(4)where β is a fitting factor whose usual values range in the interval
[
0.4,0.8]
[3]. Combining Eqs. (1) and (2) yields(
unsat( )
)
satS
K
S
p
K
t
φµ
∂
∇⋅
∇ =
∂
(5)Finally, to make a closed description of the flow, we assume the saturation equation proposed in [3][4], which governs the transport of the variable S:
S
v
S Ct
φ
∂ + ⋅∇ =∂
(6)where different expressions have been proposed for the source term C. Thus, Breard et al. [3]
proposed:
2
S
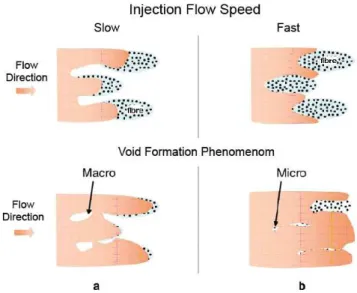
Another widely used expression writes [4]:
( )
2 m M S C v S Qv
α
α
=
+
∇
−
(8)that incorporates two dispersive coefficients αM and αm of the macro and micro voids,
respectively, and QS is a function of the modified capillary number [3]. This expression reflects
that high velocities tends to reduce mainly the macroscopic porosity originating microscopic filling defects whereas low values of the velocity tends to reduce the microscopic porosity because the dominant capillarity creating macroscopic filling defects . This mechanism is illustrated in Fig. 1.
Fig. 1.
Void formation as a function of the injection flow speed.3
Discrete form of the advection equation
Eq. (6) can be integrated by applying a second-order upwind scheme preserving the TVD property [5], whose discrete form writes:
(
)
( )
1 1/ 2 1/ 2 ˆ ˆ n n n i SW SW n i i i i i v S Sλ
S S t Cφ
+ + − = − − + ∆ (9) where t hλ
=∆ , h represents the mesh size, ∆t the time step,(
)
(
)
(
)
(
)
(
) (
)
{
}
1/ 2 1/ 2 1/ 2 1/ 2 1/ 2 1 1/ 2 1 1/ 2 1 1 ˆ ˆ 2 1 ˆ 2 SW UP i i i i i i i UP i i i i i i v t S S r sign v S S h S S S sign v S Sχ
φ
+ + + + + + + + + + ∆ = + − − = + − − (10){ }
{ }
{
0,min 2r,1 ,min r,2}
max ) r ( SB = χ (11)where r is defined by comparing consecutive variations of the approximate numerical solution
with respect to the flow direction [5]:
1 1/ 2 1 1/ 2 2 1 1/ 2 1 si 0 si 0 i i i i i i i i i i i
S
S
v
S
S
r
S
S
v
S
S
− + + + + + + +−
≥
−
=
−
≤
−
(12)For the approximation of the source term, and considering the model (8):
2 1 1 2 2 2 m m i i i i M i S i M i S i i i i S S S S C v Q v Q v x v h
α
α
α
α
+ − ∂ − + = + − ≈ + − ∂ (13)In general,
χ
( )r =0 if r≤0 that guarantees that the scheme will be of first-order in the neighbourhood of a discontinuity, since r≤0 implies that the slopes of the solution haveopposite signs. On the other hand, a second-order scheme results if
χ
( )r =1. The flux limitershould be chosen verifying both conditions and maximizing the anti-diffusive flux. Obviously, if
χ
( )r =0, ∀r, the proposed scheme reduces to the usual first-order upwind method, whereasthe choice
χ
( )r = ∀1, r, defines a fully second-order scheme. Hence, the proposed hybrid scheme is of second-order in smooth regions of the solution but it reduces to first-order method in the neighbourhood of discontinuities, avoiding the characteristic spurious numerical oscillations related to usual second-order methods in the presence of discontinuities, and at the same time reducing the excessive numerical diffusion induced by first-order upwind schemes.4
Numerical results
In order to analyze the accuracy and efficiency of the proposed numerical scheme just described for the discretization of the transport equation governing the evolution of the saturation, where the source term is given by Eq.(8), we analyze some one-dimensional numerical experiments. A mold of 0.5m length is considered. A constant injection pressure is prescribed (10-5 Pa) being the saturated permeability Ksat and the resin viscosity of 5.10
-11
m2 and
0.1Pa.s, respectively. For the numerical simulation, we consider a time step of 0.1 seconds, αM
=αm=10
-10
, β=0.8 and a constant value RS=0.8. The domain is assumed initially empty, except
the first element that represents the injection nozzle that is assumed full-filled.
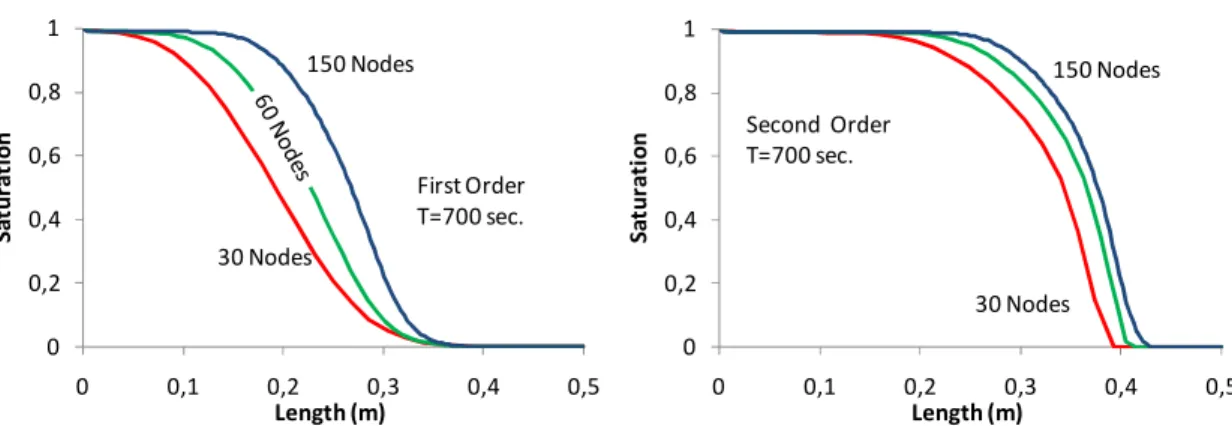
To analyze the influence of mesh size on the simulated results, three uniform meshes are considered, consisting of 30, 60 and 150 nodes, respectively. The associated numerical solutions are depicted in Fig. 2. for a filling time of 700 seconds, using the first-order scheme (i.e.
χ(r)=0) and the Sweby flux limiter scheme. We can notice that the convergence is faster when
0 0,2 0,4 0,6 0,8 1 0 0,1 0,2 0,3 0,4 0,5 S a tu ra ti o n Length (m) 150 Nodes 30 Nodes First Order T=700 sec. 0 0,2 0,4 0,6 0,8 1 0 0,1 0,2 0,3 0,4 0,5 S a tu ra ti o n Length (m) 150 Nodes 30 Nodes Second Order T=700 sec.
Fig. 2.
Numerical results for the saturation with the first-order scheme (left) and with the Sweby flux limiter (right).Fig. 2. proves also that the diffusivity of the scheme decreases with the mesh refinement. It can be noticed that the use of a first-order scheme introduces a significant numerical over-diffusion. Obviously, there are two terms that contribute to the front smoothing, the one related to the source term, and the one purely numerical introduced by the dicretization scheme. The last one can be reduced by using higher-order schemes and fine enough meshes.
Obviously, if the flux limiter is activated during the simulation the convergence rate cannot exceed a unit value, however, because the higher accuracy in the treatment of regions in which the solution is evolving smoothly (full filled domain) the expected accuracy of second order technique should be better than the one obtained with a first order upwinding. Figure 3 proves this expected behaviour.
30% 40% 50% 60% 70% 80% 90% 30 60 90 120 150 Nodes First Order Second Order
Fig. 3.
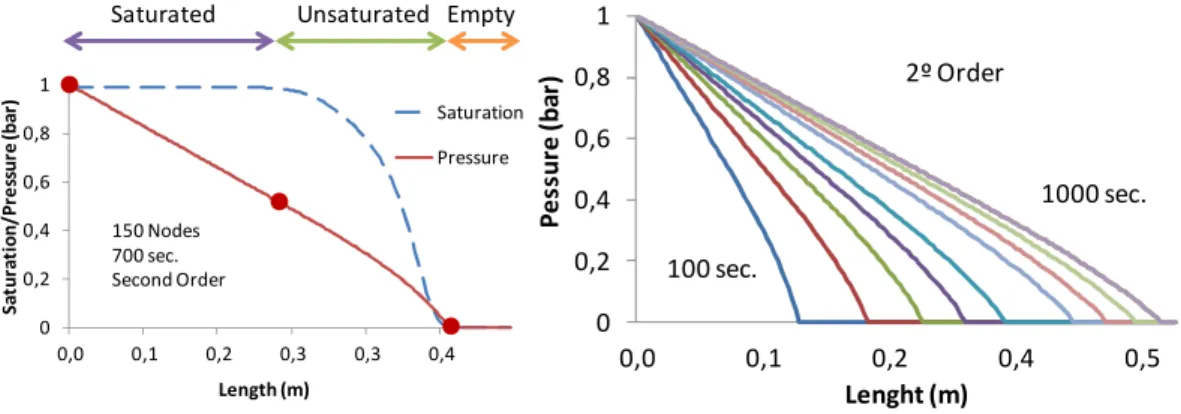
Convergence analysisThe pressure profiles exhibit a linear part in the full-filled regions and a non-linear one in the unsaturated domain located in the flow front neighbourhood. Figure 4 illustrates this behaviour.
0 0,2 0,4 0,6 0,8 1 0,0 0,1 0,2 0,3 0,3 0,4 Sa tu ra ti o n /P re ss u re ( b a r) Length (m) Saturation Pressure 150 Nodes 700 sec. Second Order
Saturated Unsaturated Empty
0 0,2 0,4 0,6 0,8 1 0,0 0,1 0,2 0,4 0,5 P e ss u re ( b a r) Lenght (m) 2º Order 1000 sec. 100 sec.
Fig. 4.
Pressure profiles5
Conclusions
An advanced numerical strategy for simulating LCM processes has been presented. The numerical model is based on the consideration of partially saturated flows. For this purpose, the advection-diffusion equation describing the evolution of the saturation is solved by using a flux limiter upwind scheme. Numerical results confirm that first-order schemes exhibit an excessive and no realistic diffusion due to a too poor description of the advective term, while the flux-limiter scheme shows less extra-diffusive effects. Thus, the flux flux-limiter proposed improves significantly the results (with respect to the first-order solutions). The results suggest that the present numerical method has a satisfactory capability of simulating the LCM process but further convergence analysis must be carried out.
References
[1] J.A. García, Ll. Gascón, F. Chinesta, A Fixed Mesh Numerical Method for Modelling the
Flow in Liquid Composites Moulding Processes Using a Volume of Fluid Technique,
Computer Methods in Applied Mechanics and Engineering, 192/7-8, 877-893, 2003..
[2]
F. Sánchez, J.A. García, Ll. Gascón, F. Chinesta, Towards an efficient numerical
treatment of the transport problems in the Resin Transfer Molding Simulation,
Computer Methods in Applied Mechanics and Engineering, 196, 2300-2312
, 2007. [3]J. Breard, A. Saouab, G. Bouquet, Numerical simulation of void formation in
LCM, Composites Part A: Applied Science and Manufacturing, 34, 517-523, 2003.
[4] F. Trochu, E. Ruiz, V. Achim, S. Soukane, New Approaches to Accelerate Calculations andImprove Accuracy of Numerical Simulations in Liquid Composite Molding, International
Conference on Flow Processes in Composite Materials, Delaware, USA, July 7-9, 2004.
[5] P.K. Sweby, High resolution schemes using flux limiters for hyperbolic conservation laws,