HAL Id: hal-02163481
https://hal.archives-ouvertes.fr/hal-02163481
Submitted on 24 Jun 2019
HAL is a multi-disciplinary open access archive for the deposit and dissemination of sci-entific research documents, whether they are pub-lished or not. The documents may come from teaching and research institutions in France or abroad, or from public or private research centers.
L’archive ouverte pluridisciplinaire HAL, est destinée au dépôt et à la diffusion de documents scientifiques de niveau recherche, publiés ou non, émanant des établissements d’enseignement et de recherche français ou étrangers, des laboratoires publics ou privés.
Effects of Turbidity and Lighting on the Performance of
an Image Processing based Damage Detection Technique
Michael O’Byrne, Bidisha Ghosh, Vikram Pakrashi, Franck Schoefs
To cite this version:
Michael O’Byrne, Bidisha Ghosh, Vikram Pakrashi, Franck Schoefs. Effects of Turbidity and Lighting on the Performance of an Image Processing based Damage Detection Technique. 11th International Conference on Structural Safety & Reliability, 2013, New York, United States. �10.1201/b16387-382�. �hal-02163481�
Effects of Turbidity and Lighting on the Performance of
an Image Processing based Damage Detection Technique
M. O'Byrne & B. Ghosh
Trinity College Dublin, Department of Civil, Structural and Environmental Engineering, Dublin 1, Ireland.
V. Pakrashi
University College Cork, Department of Civil and Environmental Engineering, College Road, Cork, Ireland.
F. Schoefs
LUNAM Université, Université de Nantes-Ecole Centrale de Nantes-CNRS, GeM, Institute for Research in Civil and Mechanical Engineering, UMR 6183 & IXEAD/CAPACITES Scociety, University of Nantes 2, rue de la Houssinière BP 92208 44322 Nantes Cedex 3, France.
ABSTRACT: Measuring the true extent of damage in a structure remains a difficult task for inspectors. For visual inspections, an accurate assessment of the damage state is often subjective in nature and prone to error, especially when an inspection is conducted in hostile surroundings or when there are challenging environmental conditions present. While incorporating some form of Non-Destructive Technique (NDT) is generally useful for the inspection process, its performance may similarly degrade in the presence of environmental conditions. It is thus of great practical importance to have a measure of the performance of an NDT for a host of varying conditions, thereby allowing the inspector to determine whether it could be successfully applied in a given situation. In this paper, a measure of the effectiveness of an NDT technique is probabilistically determined for various environmental conditions through the use of Receiver Operating Characteristic (ROC) curves. ROC curves offer a convenient way of characterising and comparing the performance of an NDT under various conditions. The NDT considered in this paper is an image processing based damage detection technique which uses texture information in conjunction with Support Vector Machine (SVM) classification to identify damaged regions. The variability of this technique is evaluated for various damage forms that are subjected to two changing parameters; turbidity and lighting. There were three set levels (low, medium, high) for each parameter. The conditions that were conducive to good detection were isolated and ranked using the α-δ method as part of the ROC analysis. The technique is applied to standard dynamic range (SDR) images and high dynamic range (HDR) images in order to assess their respective sensitivities to the changing parameters.
1 INTRODUCTION
Regular inspections of structures are vital to ensure that they remain safe and fit for purpose. Currently, many structures are assessed using a regime of visual inspections. The levels of inspection cover a range of detail. It can be a cursory check, a principal inspection involving detailed examination of all surfaces, or special
inspections where the employment of invasive, semi-invasive and non-invasive tests may become necessary. Most inspections still depend on visual observations and the quality of data collected largely depends on the ability of the inspectors to observe and objectively record details of damage. The approach is prone to considerations such as operator
boredom, lapses in concentration, subjectivity, and fatigue, which contribute to the variability and reduced accuracy of visual inspections (Agin, 1980). With this in mind, it is often desirable to incorporate a second, more objective and quantitative, source of information about the health condition of a structure. Non-Destructive Techniques (NDT) often provide the only method of obtaining such information.
The information obtained from the NDT may be fed into an Infrastructure Management System (IMS), which can help the decision makers to make more effective and informed judgments when allocating resources towards the correction of deficiencies and when choosing an appropriate future course of action. This aspect has attracted a growing interest in recent years as the importance of life cycle optimisation and the related financial benefits continue to be recognised (Schoefs et al., 2009). For a well calibrated IMS, it is important that the input information is accurate and comprehensive. This requires selecting the most suitable NDT technique, which for a given application is not always readily apparent as a measure of the onsite performance of an NDT technique remains a pertinent question in the majority of cases (Schoefs et al., 2012a). The choice of NDT will largely depend on the damage to be detected and the environmental conditions, and will require an in-depth knowledge of the advantages and limitations associated with each option. Unfortunately, many inspections proceed without a proper evaluation of all available options and as a result an inferior level of information is obtained.
In recent times, image processing based damage detection methods have been increasingly considered as a viable NDT option. This is due to a number of reasons. Image processing methods use inexpensive and readily available equipment (i.e. a standard digital camera), and they do not require the inspector to undertake extensive training. Furthermore, advances
in camera technology mean that rich detailed imagery of damaged components can be acquired. Additionally, visual inspections almost always capture photographs to include in the inspection report to corroborate the inspector’s comments; however, these photographs are rarely exploited to their fullest potential in either a qualitative or a quantitative fashion. The primary limitations image processing methods are the lack of penetration below the surface of the material and the requirement of good visibility and lighting conditions.
Applying damage detection algorithms to the photographs can locate and quantify visible mechanical damage on the surface of infrastructural elements with minimal human supervision. Physical properties of the identified damage, such as the size and shape characteristics, may be easily extracted with knowledge of a real world scale. The quantitative nature of the data obtained from image analysis is important and naturally lends itself to numerous applications. It is helpful for developing new damage models, or strengthening existing ones, which are used to forecast the rate of propagation of damage as the structure continues to operate.
Most image processing based damage detection algorithms consist of segmentation followed by subsequent classification of the segmented regions. Ideally, the segmentation methodology should identify and accurately define all regions of interest in an image whilst minimizing the inclusion of extraneous regions. In reality, perfect segmentation is difficult to achieve given the inherent chromatic and luminous complexities encountered in natural scenes. Segmentation algorithms use either pixel intensity (colour) information or texture information to isolate similar regions in an image. This paper employs a texture analysis based method (O'Byrne et al, 2013) which has previously been proposed in the domain of NDT. The technique is applied to three damaged specimens which
are photographed underwater under varying conditions of turbidity and light. There were three set levels (low, medium, high) for each parameter which resulted in a total of 9 images for each specimen. Additionally, High Dynamic Range (HDR) imagery is adopted as a protocol, as proposed by (Ghosh et al., 2010), to investigate whether this would exhibit a greater resilience to the challenging conditions.
The effect of turbidity and lighting conditions on image quality and analysis has not been previously studied. Both of these parameters affect the underwater visibility which is crucial for an image based NDT to succeed. Turbidity is defined as the cloudiness in a liquid caused by the presence of suspended solids. These suspended solids scatter and absorb light and therefore reduce visibility. The level of turbidity may be exacerbated by interference during the inspection process, such as from a mechanical source like a boat or human contact with the river bed, which may aggravate and disturb sediment. Lighting also plays a pivotal role for achieving good visibility. Ambient light may be sufficient for near-surface inspections; however, it is unlikely to be sufficient at greater depths at which point artificial light sources become necessary. These artificial light sources may introduce luminous complexities such as ‘hot-spots’, whereby areas of high light intensity may be focused light at a spot which may fool the detection algorithm.
The following section provides an overview of the texture analysis based detection technique, describes the experiment process, gives a brief background to HDR, and details the performance evaluation methodology which is based on ROC curves. Section 3 shows an example of the imagery used while Section 4 presents the results obtained for the three specimens for each condition. Section 5 concludes the paper.
2 METHODOLOGY
A parameter study assessing the impact of varying turbidity and lighting levels on the detection accuracy of a texture analysis based damage detection technique has been conducted in this paper. The process comprises two broad stages: (i) parameter control and image acquisition, and (ii) application of the texture analysis algorithm and subsequent performance analysis. The first stage involves setting the turbidity and lighting to some predefined level, followed by capturing a sequence of images (each with a different exposure) of the damaged specimen. The parameters are then adjusted to a subsequent predefined level and another sequence of images is acquired. This procedure is repeated until all combinations of turbidity and lighting have been photographed. HDR images are then generated for each scenario by merging the variously exposed SDR images. Throughout the experiment, the camera and the specimen are kept in their original positions (60cm apart) and the turbidity is kept uniform at each level by stirring on a regular basis.
The second stage involves applying the detection algorithm to all of the normally exposed SDR images and the HDR images. The detection accuracy is then measured by comparing the resulting detected regions from the technique to a visually segmented image for each damaged specimen which acts as a control. The performance associated with each image is recorded and is plotted in the ROC space, allowing for a quick and intuitive assessment of the impact caused by the changing environmental parameters. 2.1 DETECTION ALGORITHM
The detection algorithm is based on texture analysis. Texture is an innate property of surfaces which, for human observers, texture may be qualified by terms such as fine, coarse, smooth, rippled, molled, irregular, or lineated (Haralick et al., 1973). There are numerous ways to
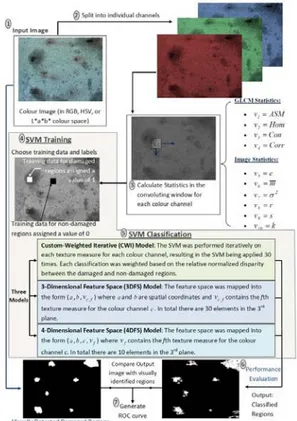
quantify texture; wavelet analysis, Laws’ texture energy, First Order Statistics (FOS) and Grey Level Co-occurrence Matrix (GLCM). The texture analysis based segmentation method used in this paper combines both FOS and GLCM statistics. The texture dependent statistics, or texture measures, are calculated at every pixel in an image using a sliding window approach. Four statistics were derived from a GLCM; angular second moment, homogeneity, contrast and correlation, while a further six texture measures were calculated directly from the pixel intensity values from the original image. These were Shannon entropy, mean, variance, range, skewness and kurtosis. The 10 texture measures calculated at each pixel location form a feature vector. Non-linear SVM models are used to classify pixels as either damaged or undamaged based on the feature vector corresponding to that pixel. Two SVM classification models were considered; a Custom-Weighted Iterative (CWI) model and a 4-Dimensional Feature Space (4DFS) model in which the feature vectors were mapped to a four dimensional feature space. The 4DFS model was generally shown to produce better segmentation results so this model was used for the purposes of this comparison. The method is illustrated in the following flowchart Figure 1.
Figure 1. Flowchart for the texture analysis based segmentation method.
2.2 HIGH DYNAMIC RANGE (HDR) HDR is a set of techniques that allow a greater dynamic range of luminance values between the brightest and darkest regions of an image than standard digital images. SDR images can typically only accommodate a very limited range bracket of the full tonal spectrum in a real world scene. Therefore, a dynamic range bracket would have to be chosen in the knowledge that all luminance values outside the range would not be represented correctly. The broad principle behind HDR imagery is that multiple SDR images of the same scene, each taken at a different exposure, and thus capturing a different range bracket of the tonal spectrum, may be merged to form one HDR image that has a wider dynamic range (Reinhard et al., 2008). Combining SDR images can be done using various merging algorithms (Debevec and Malik, 2008).
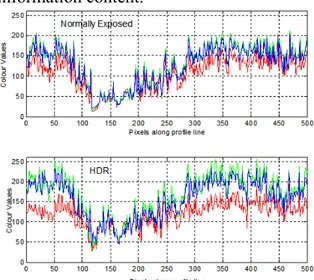
The usefulness of HDR imagery as an imaging protocol may be observed in Figure 2 which depicts the pixel intensity values plotted along a profile line for a normally exposed SDR image and the
corresponding HDR image (the SDR and HDR images in question are from Figure 4 (1) and (5) respectively). It may be observed that HDR image exhibits an increased tonal range compared to the SDR image, thus offering a superior information content.
Figure 2. The increased tonal range during damage detection for an HDR image as compared to an SDR image with normal.
2.3 PERFORMANCE EVALUATION The performance of each method is evaluated through the use of ROC curves. ROC curves provide for a convenient means for characterising and comparing the performance of NDTs in various conditions (Rouhan and Schoefs, 2003) and have recently been expanded to image detection (Pakrashi et al., 2010). For any NDT, the Detection Rate (DR) along with the accompanying Misclassification Rate (MCR), or alternatively known as Probability of Detection (PoD) and Probability of False Alarm (PFA) in the field of probability space and decision theory, are determined by comparing the corroded regions detected with a visually segmented image, which acts as the control. The DR and MCR are represented as a percentage between 0% and 100%. Each (MCR,DR) pair formed a coordinate in the ROC space.
There are a few measures for comparing segmentation performance (Hui et al., 2008). In this paper, a measure of the performance was attained through the
use of the α-δ method (Baroth et al., 2011; Schoefs et al., 2012b). This method relies on calculating the angle, α, and the Euclidean distance, δ, between the best performance point, defined as an ideal NDT with 100% detection and 0% misclassification rates and represented in the ROC space with coordinates (0,1) and the considered point to give a measure of the performance of the considered point. As this paper is not devoted to risk analysis where the shape to the ROC acts as a key factor, only the delta, δ, parameter is required. A low value for δ is indicative of a strong performing technique.
3 DATA ANALYSIS
Three specimens are used in this parameter study. The first specimen is a metallic object which is suffering from heavy corrosion (Figure 3). This form of damage is typical in Marine environments which are highly corrosive and conducive to the formation and progression of such damage. The by-products of corrosion produce discoloured regions which characterise the damaged zones.
The other two specimens show typical damages associated with aging concrete. One specimen shows an exposed damaged area which reveals coarse and jagged aggregate, while the other specimen has an exposed area characterized by finer aggregate, yet the damaged zone is still noticeably different in terms of textural composition from the relatively smooth undamaged concrete surface. These images are not shown due to space considerations.
The effect of turbidity and lighting may be observed in Figure 3. It may be noted that the specimen is readily discernible for certain conditions (e.g. medium light, low turbidity), while in other cases, the damaged regions are almost indistinguishable (e.g. low light, high turbidity).
Figure 3. HDR images of a damaged metallic surface under various lighting and turbidity conditions.
The next section presents the results obtained after the texture analysis based damage detection method was performed on the images.
4 RESULTS
The texture analysis based damage detection technique was applied to each image in Figure 3 resulting in the detected regions shown in Figure 4. Their performance levels, as well as the performance levels obtained for SDR
imagery and for the other specimens, are summarized in Table 1 and the corresponding performance points are plotted in the ROC space. The effects of turbidity and lighting are isolated and illustrated through the use of ROC curves fitted to the data in Figure 5(a) and Figure 5(b) respectively.
Figure 4. Detected regions following application of the texture analysis based damage detection method under varying turbidity and lighting conditions. The white parts represent regions that are considered to be undamaged by the detection technique.
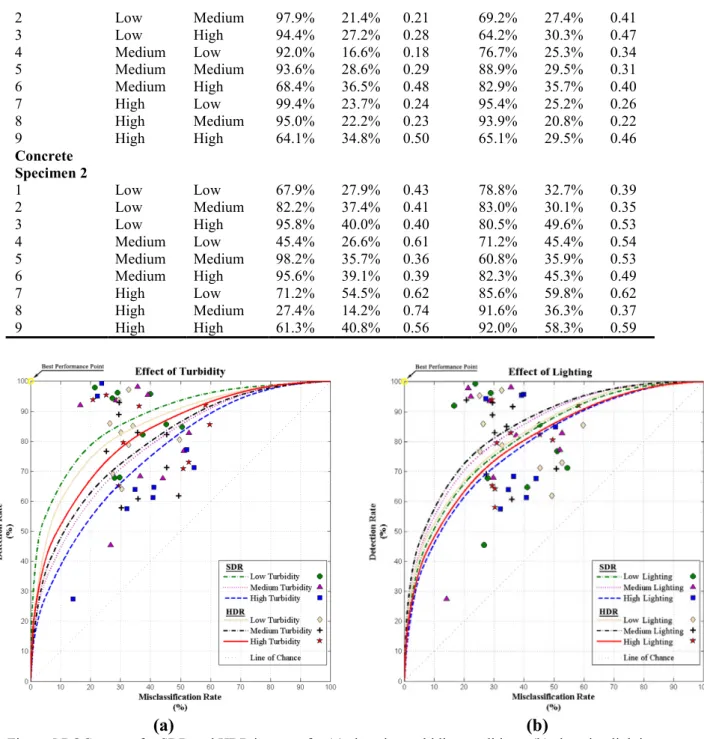
Table 1. Accuracy of the detection technique applied to the SDR and HDR imagery of three damaged specimens under varying conditions of turbidity and lighting.
Image
Number Turbidity Lighting DR SDRMCR δ DR HDRMCR δ Metal Specimen 1 Low Low 85.7% 45.3% 0.47 97.2% 32.6% 0.33 2 Low Medium 68.0% 29.7% 0.44 85.1% 34.2% 0.37 3 Low High 84.9% 50.5% 0.53 93.9% 29.4% 0.30 4 Medium Low 76.9% 51.1% 0.56 61.9% 49.3% 0.62 5 Medium Medium 82.9% 52.7% 0.55 93.0% 29.5% 0.30 6 Medium High 67.7% 44.0% 0.55 57.9% 30.3% 0.52 7 High Low 64.7% 41.1% 0.54 72.9% 52.7% 0.59 8 High Medium 77.3% 52.1% 0.57 70.9% 50.9% 0.59 9 High High 57.5% 32.0% 0.53 79.5% 31.0% 0.37 Concrete Specimen 1 1 Low Low 96.2% 28.9% 0.29 85.9% 26.4% 0.30
2 Low Medium 97.9% 21.4% 0.21 69.2% 27.4% 0.41 3 Low High 94.4% 27.2% 0.28 64.2% 30.3% 0.47 4 Medium Low 92.0% 16.6% 0.18 76.7% 25.3% 0.34 5 Medium Medium 93.6% 28.6% 0.29 88.9% 29.5% 0.31 6 Medium High 68.4% 36.5% 0.48 82.9% 35.7% 0.40 7 High Low 99.4% 23.7% 0.24 95.4% 25.2% 0.26 8 High Medium 95.0% 22.2% 0.23 93.9% 20.8% 0.22 9 High High 64.1% 34.8% 0.50 65.1% 29.5% 0.46 Concrete Specimen 2 1 Low Low 67.9% 27.9% 0.43 78.8% 32.7% 0.39 2 Low Medium 82.2% 37.4% 0.41 83.0% 30.1% 0.35 3 Low High 95.8% 40.0% 0.40 80.5% 49.6% 0.53 4 Medium Low 45.4% 26.6% 0.61 71.2% 45.4% 0.54 5 Medium Medium 98.2% 35.7% 0.36 60.8% 35.9% 0.53 6 Medium High 95.6% 39.1% 0.39 82.3% 45.3% 0.49 7 High Low 71.2% 54.5% 0.62 85.6% 59.8% 0.62 8 High Medium 27.4% 14.2% 0.74 91.6% 36.3% 0.37 9 High High 61.3% 40.8% 0.56 92.0% 58.3% 0.59 (a) (b)
Figure 5 ROC curves for SDR and HDR imagery for (a) changing turbidity conditions, (b) changing lighting.
4.1 DISCUSSION
It may be noted from the detected regions in Figure 4 that the ability of the detection technique was strongly correlated to the degree of clarity in the original images (Figure 3). Unsurprisingly, images which featured poor visibility conditions (high turbidity and low-lit scenes for example) produced very low performance levels, while on the other hand, images which featured clear and well-lit scenes produced quite good segmentation results.
The best performing curve in Figure 5(a) is for SDR images in low turbidity water. However, the performance of the SDR imagery deteriorates quite rapidly with increasing turbidity. The HDR imagery is more immune to variations in turbidity levels. The optimum lighting condition was not at the brightest level as may have been expected. Instead, the medium lighting level provided the best results when used in conjunction with HDR. This suggests that having too strong a light source can create lighting
complexities on the surface of the specimen such as bright spots which can offset the benefits of having a sufficiently lit scene. Furthermore, a high lighting level along with high turbidity produces a lot of backscatter which creates a hazy glow. This may be seen in image 9 in Figure 3.
Therefore, it may be concluded that the best results can be attained when the turbidity is lowest and when the lighting is sufficient yet not overly bright. Additionally, analysis of the δ values in Table 1 reveals that HDR imagery brings about a marginal improvement in the detection accuracy over SDR imagery. 5 CONCLUSION
This paper examines the effect of two parameters; turbidity and lighting, for an image processing based NDT tool for underwater structural health monitoring purposes. The influence and relative importance of these two environmental conditions which affect the detection process have been investigated, and the NDT’s sensitivity has been assessed through the use of ROC curves.
Although environmental conditions such as turbidity are generally uncontrollable in practice, lighting can be easily adjusted. It is thus readily attainable to have appropriate lighting conditions which are conducive to structural health monitoring and damage detection. This study recommends and outlines suitable lighting criteria and also shows the expected degradation in performance for increasing turbidity conditions.
The results from this study may facilitate an inspector when deciding on the appropriateness of a certain NDT, under a given environmental condition. REFERENCES
Agin, G. J. (1980), Computer vision systems for industrial inspection and assembly, Computer 13(5), 11-20.
Baroth, J., Breysse, D. & Schoefs, F. (2011), Construction Reliability. Wiley, Hoboken, NJ. Debevec, P.E. & Malik, J. (2008), Recovering high dynamic range radiance maps from photographs.
ACM SIGGRAPH 2008 classes, Los Angeles, California, ACM, 1-10.
Ghosh, B., Pakrashi, V. & Schoefs, F. (2010), High dynamic range image processing for
non-destructive-testing, European Journal of
Environmental and Civil Eng., 15(7), 1085-96. Haralick, R. M., Shanmugam, K. & Dinstein, I. H. (1973), Textural Features for Image Classification, Systems, Man and Cybernetics, IEEE Transactions on, 3(6), 610-621.
Hui, Z., Fritts, J.E. & Goldman, S.A. (2008), Image segmentation evaluation: a survey of unsupervised methods, Computer Vision and Image Understanding, 110(2), 260-280.
O'Byrne, M., Schoefs, F., Pakrashi, V. & Ghosh, B. (2012), Texture Analysis Based Damage Detection of Ageing Infrastructural Elements, Computer-Aided Civil and Infrastructure Engineering, 28(3), 162-177.
Pakrashi, V., Schoefs, F., Memet, J.B. & O’Connor, A. (2010), ROC dependent event isolation method for image processing based assessment of corroded harbour structures, Structure and Infrastructure Engineering: Maintenance, Management, Life-Cycle Design and performance (NSIE), 6(3), 365-378.
Reinhard, E., Khan, E.A., Akyz, A.O. & Johnson G.M. (2008), Color Imaging: Fundamentals and Applications, Natick, MA, USA.
Rouhan, A. & Schoefs F. (2003), Probabilistic modeling of inspection results for offshore structures, Structural Safety, 25(4), 379-399.
Schoefs F., Bernard O., Capra B., Aduriz X. (2009), Comparison of additional costs for several
replacement strategies of randomly ageing
reinforced concrete pipes, Computer Aided Civil and Infrastructure Engineering, 24(7), 492-508 Schoefs, F., Abraham, O., & Popovics, J. (2012a), Quantitative evaluation of NDT method performance: application example based on contactless impact echo measurements for void detection in tendon duct, Construction and Building Materials (CBM), In Press.
Schoefs, F., Clément, B.J. & Capra B.A. (2012b.), The αδ method for modelling expert Judgment and combination of NDT tools in RBI context: application to Marine Structures, Structure and Infrastructure Engineering: Maintenance, Management, Life-Cycle Design and performance (NSIE), Monitoring, Modeling and Assessment of Structural Deterioration in Marine Environments, 8(Special Issue), 531-543.
ACKNOWLEDGEMENTS
The authors wish to thank the Irish Research Council for Science, Engineering and Technology (IRCSET) for providing grant to support this research and CAPACITES/IXEAD society for the practical assistance.