Science Arts & Métiers (SAM)
is an open access repository that collects the work of Arts et Métiers Institute of Technology researchers and makes it freely available over the web where possible.
This is an author-deposited version published in: https://sam.ensam.eu
Handle ID: .http://hdl.handle.net/10985/8441
To cite this version :
Loreleï COMMIN, Laurent BARRALLIER, Jean-Eric MASSE - Residual stress evolution analysis in AZ31 friction stir welds using X-Ray and neutron diffraction - In: ICRS-8 - The Eighth
International Conference on Residual Stresses, United States, 2008-08-06 - Advances in X-ray Analysis - 2009
Any correspondence concerning this service should be sent to the repository Administrator : [email protected]
RESIDUAL STRESS EVOLUTION ANALYSIS IN AZ31 FRICTION
STIR WELDS USING X-RAY AND NEUTRON DIFFRACTION.
Loreleï COMMIN, Laurent BARRALLIER, Jean-Eric MASSE.
MÉCASURF laboratory, ARTS ET METIERS PARISTECH, 2 cours des Arts et Métiers, 13617 Aix en Provence, France.
ABSTRACT
The challenges of weight reduction in aerospace industry have drawn considerable interest in magnesium alloys technologies. Assessing the efficiency of new joining techniques, as Friction Stir Welding is then required. During Friction Stir Welding, the welding tool motion induces frictional heating and severe plastic deformation. Then, in addition to the microstructure and texture evolutions generally observed, significant residual stresses can result from this process. The Friction Stir Welds have been processed using 2 mm thick hot rolled plates of AZ31 Magnesium alloy. Residual stress analysis was carried out on a Friction Stir Weld processed using optimum welding parameters. Laboratory X-ray diffraction and Neutron diffraction were performed. Indeed, the use of Neutron diffraction was especially interesting because it avoids matter removal required with X-ray technique. Moreover, with Friction Stir Welding, the complex thermo-mechanical input induces complex stress gradients. Then, the high penetration capability of the Neutron diffraction technique was thus essential to allow the determination of stress gradients in a
non-destructive way. Hahn Meitner Institüt (HMI, Berlin, Germany) E3 instrument and Institut Laüe Langevin (ILL, Grenoble France) SALSA instrument were used. Sin2
ψ method was used to determine residual stresses obtained with X-ray diffraction and HMI Neutron diffraction, whereas the triaxial method was used to determine residual stresses obtained with ILL Neutron diffraction. The aim of this study is to investigate the residual stress distribution in Magnesium Friction Stir Welds and to compare the results obtained using several techniques.
INTRODUCTION
Magnesium alloys are driving more and more interests in structural applications due to their high specific properties.
Joining is one of the manufacturing routes that can be used to optimise product design and minimise production costs, but its use is still facing many challenges. Indeed, magnesium alloys exhibit a high thermal expansion coefficient and an oxide protective layer. Traditional welding techniques are then difficult to perform. So, others welding techniques have to be studied such as Friction Stir Welding (FSW).
FSW can achieve metallic bonding below the material melting point, and then it is avoiding many of the metallurgical problems associated with the solidification process such as porosity and cracking. Moreover, the important loss in the mechanical properties, occurring with the fusion zone during conventional processes, can be minimised. As FSW is a
relatively new manufacturing process, there is little published research on how it affects the residual stresses in magnesium alloys.
EXPERIMENTAL
Material and FSW processing parameters used
The base material analyzed is AZ31-O Magnesium alloy, whose nominal composition is described in Table 1.
Tab.1: Chemical composition of AZ31 alloy
Friction Stir Welds were processed using 2 mm thick hot rolled sheets.
FSW process was performed using a hydraulic MTS Istir PDS machine. A 4 mm diameter threaded pin and a 13 mm diameter scroll shoulder were used. The processing parameters chosen were 1000 rpm and 200 mm/min. The Friction Stir Welds produced using these
welding parameters were further used for the microstructural and residual stress investigation.
Microstructural analysis
Optical micrographs were performed using a Olympus BX41M on FSW polished samples etched with an acetopicral solution (0.4 g picric acid, 13 ml ethanol, 3 ml glacier acetic acid and 3 ml boiled water). X-ray Diffraction (XRD) using SEIFERT MZ6TS diffractometer with Cr anode was performed for texture analysis.
X-ray diffraction experiment
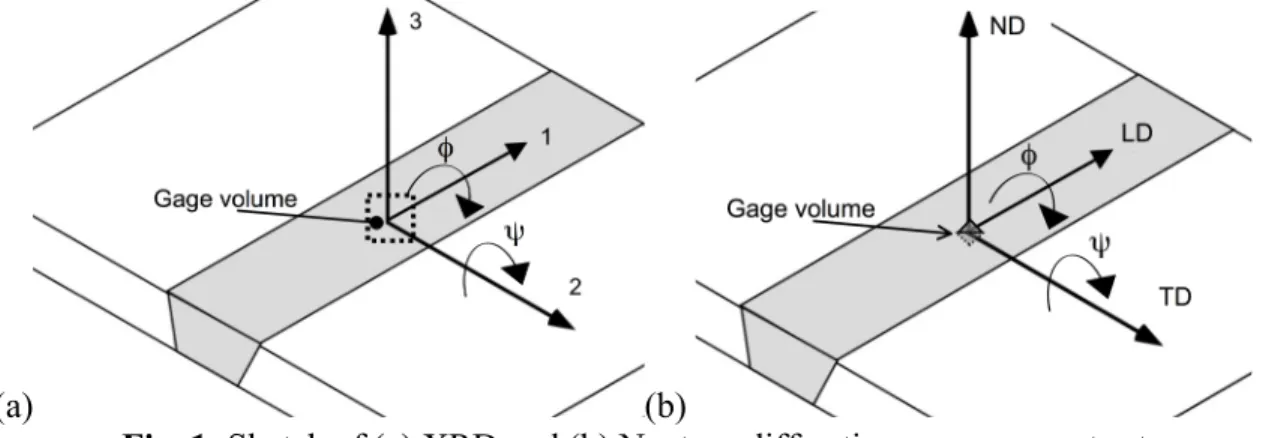
X-ray Diffraction was performed using a SEIFERT MZ6TS diffractometer with Cr anode at MécaSurf laboratory. Stress profiles were determined on the top surface of the FSW weld and across the weld width. The spot size is a constant square surface about 2×2 mm2. The sin2 ψ analysis method was used with 7 ψ (-70°,-50,1°-20°, 0°, 20°,50,1°, 70°) angles and 10 φ (0°,36°,72°,108°,144°,180°,216°,252°, 288°, 324°) angles [1]. Using this method, the complete stress tensor was determined at each point analyzed. The measurement set-up used is shown in Figure 1 (a).
The use of X-ray diffraction revealed several issues. Indeed in the welded samples, very weak diffraction intensity was observed, which is due to several phenomena:
- Low magnesium atom diffusion capabilities (the atom scattering factor depends on the atomic number and it is taken into account within the structure factor, influencing then the diffracted intensities)
- Superficial oxidation
- Gage volume too small due to the use of a tape mask,
- Texture influence restrains the analysis along some directions.
When using X-ray Diffraction, it is not possible to determine depth related variations without matter removal. Moreover, in the welded samples, the complex thermomechanical input will induce complex stress gradients. The high penetration capability of neutron
diffraction technique will then allow us to determine stress profiles in a non-destructive way.
(a) (b)
Fig. 1: Sketch of (a) XRD and (b) Neutron diffraction measurement set-up.
Neutron diffraction experiments
The measurement set-up used is shown in Figure 1 (b).
Measurements were performed along the weld width and within its thickness (Figure 2).
Fig. 2: Measurement location.
Neutron diffraction experiments were carried out at the Hahn Meitner Institute in
Berlin (HMI, called Berlin Helmholzt Centre for Materials and Energy since 4th July 2008), and at the Institut Laüe Langevin in Grenoble (ILL).
Stress profile analysis were performed using HMI E3 instrument with 0.137 nm monochromator wavelength and 1×1×40 mm slits. Measurements were done for the
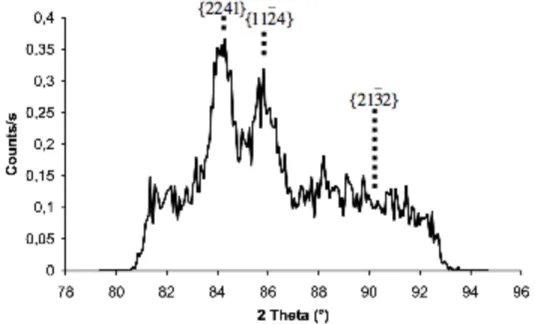
! {2241}, ! {1124}and ! {2132}crystallographic planes, at φ = 0°, ψ = 30°, -60°, 90°, 0°.
sin2ψ method even for neutron diffraction measurements, but we are fully aware that this assumption is not valid in the case of bulk materials.
The gage volume analyzed was very small, inducing a high signal to noise ratio and multiple peaks could be observed in each diffraction pattern (Figure 3). A good balance had to be chosen for the counting time (30 min) for each peak and the number of ψ angles that could be studied to fit the beam time allocated. Moreover, because of the textured nature of the material analyzed, the peaks were not available in the four orientations studied.
Fig. 3: Diffraction pattern obtained at HMI, Ψ=-60°.
Triaxial analysis was performed using measurements done with ILL SALSA instrument using 0.6 mm slits to get a better resolution. Stress maps of the FSW sample were built using a 0.16457 nm monochromator wavelength, 0.6×0.6×10 mm slit for the transverse direction, 0.6×0.6×1 mm slit for the longitudinal direction and 0.6×0.6×20 mm slit for the normal direction. The slit height depends on the resolution needed to reduce stress gradients in the gage volume analyzed.
Measurements were done for the
!
{1122},{2130},{2020} crystallographic planes. The experimental set-up used is summarized in table 2.
λ (nm) Slits/Tape mask Planes analysed
XRD 0.229 2×2 mm2×20 µm ! {1014} HMI E3 0.137 1×1×40 mm3 ! {2241},{1124},{2132} ILL SALSA 0.164 0.6×0.6×1 mm3 (LD) 0.6×0.6×10 mm3 (TD) 0.6×0.6×20 mm3 (ND) ! {1122},{2130},{2020}
Tab. 2: Characteristics of the experiments performed.
Simulation of neutron diffraction experiments
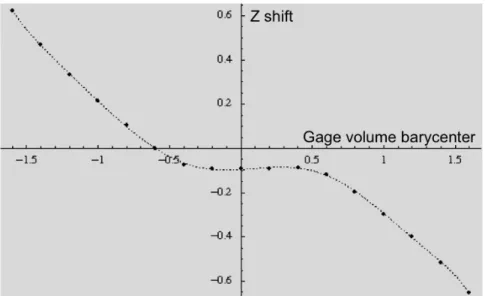
As the gage volume width is larger than the 2 mm sample thickness, a simulation of the whole experiment, depending on reactor and instrument parameters, is needed to determine accurately the gage volume location within the sample at each measurement. A simulation program developed at MécaSurf Laboratory [2, 3, 4] was used. The method is based on a complete simulation of neutron diffractometer from neutron guides to detector using monte-carlo approach to describe the neutrons paths. The sample is modelized using elementary volume, (here parallelipedic volume). The monochromator mosaicity is also taken into account with slit sizes and distances from the goniometer center. The simulation was
performed for each sample / goniometer configuration i.e for all ψ angles and Z positions. It allows determining the shift within the thickness (Z-shift) (Figure 4), the simulated
intensities and the simulated 2θ angles (Figure 5), versus the center of gravity of the gage volume (called gage volume barycenter). Simulating the intensities, it is possible to correct systematic Z error due to the misalignment of the gage volume and the center of goniometer (if this error exists and for each ψ). Z-shift curves allow then to determine the true position of the gage volume barycenter. The through thickness intensity measured profiles can therefore be corrected for each point. The measured 2θ angles (Figure 6) were corrected
using simulated 2θ angles and the stress profiles were calculated.
Fig. 4: Z shift determination for ψ=30°
Fig. 5: (a) Simulated 2θ and (b) simulated intensities
Figure 6: (a) Corrected 2θ and (b) corrected intensities
Experimental restrictions for the 2 methods used during neutron diffraction analysis
The issues we faced using Neutron Diffraction are that the signal was very weak for the same reason as described previously in XRD.
Moreover, several peaks were observed in the analysis window, which led to difficulties in data treatment.
The plane stress assumption used in sin2 ψ method is not fully suited to characterize welds due to the triaxiality of the stresses involved.
The triaxial method assumptions are not fully valid neither in the case of textured material. Indeed, in triaxial method, the normal direction (ND), transverse direction (TD) and longitudinal direction (LD) are not always the major directions due to texture effects.
RESULTS
Microstructure of the Friction Stir Weld studied
The AZ31 FSWeld microstucture consists in 4 different areas. Figure 7 shows the microstructure of each area. The nugget consists in 2-5µm fine recrystallised grains structure; the TMAZ in 5-15µm elongated grains and the HAZ has the same grain microstructure than the base metal (i.e. 5-15µm equiaxed grains).
Fig. 7: Optical micrographs of FSWeld zones: (a) nugget, (b) TMAZ, (c) HAZ/Base metal.
Influence of the microstructure and magnesium anisotropy on the residual stress calculation
AZ31 hot rolled plates exhibit a strong {0002} basal texture (Figure 8).
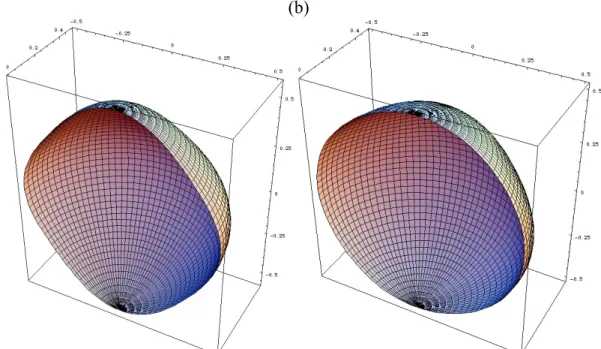
Fig. 8: {0002} pole figure of AZ31 determined using XRD. The magnesium monocrystal does not present a strong anisotropy (Figure 9a). The magnesium monocrystal elastic constants determined by Long [5] were used. Taking into account the AZ31 orientation distribution functions determined experimentally by XRD, the anisotropic elastic constants can be calculated. A very weak anisotropy of the AZ31 textured polycrystal is observed (Figure 9b). Then the strong texture was neglected in the further stress calculations.
(a) (b)
Fig. 9: Analytical calculation of (a) Mg monocrystal E (TPa) and (b) textured AZ31
polycrystal E (TPa) in cartesian coordinates.
X-ray diffraction residual stress analysis
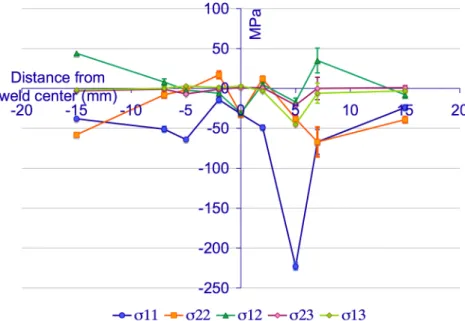
Residual stress profile across the weld width was determined on the top surface of FSW sample. The complete stress tensor was calculated using sin2 ψ method (σ
33=0 assumption). Figure 10 shows the evolution of each stress component versus the distance from the weld center. Higher residual stress levels are observed at the shoulder edge (i.e. corresponding to the TMAZ area).
Fig. 10: Stress tensor components evolution in FSWeld top surface determined with XRD
Neutron diffraction residual stress analysis
The high penetration capability of neutron diffraction technique was used to determine stress profiles through the thickness and along the weld width. Measurements were performed in the transverse direction. The longitudinal direction measurements could not be performed in the beam time allowed, because the neutron flux would have been too low using the 1 ×1×1 mm slits needed to reduce stress gradients in the gage volume. The sin2 ψ analysis method has been used [1].
Stress map across the weld width and within the weld thickness was built using {1124} plane. The gage volume is very large compared to the sample dimension (2 mm thick) and then the results obtained are averaged. The stress gradients could be determined by the extrapolation of the measurements. Figure 11 shows the contour plot of the stress map. The grey areas are the locations where the fitting operation could not be correctly fulfilled. High compressive stresses are observed in the middle of the nugget and slightly tensile stresses are observed in the TMAZ area.
Fig. 11: Stress map in FSWeld determined with HMI-E3 instrument.
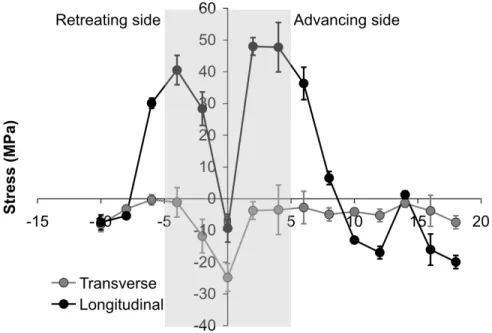
Triaxial residual stress analysis was performed with ILL-SALSA instrument. Analysis was performed in the mid-thickness across the weld. Longitudinal and Transverse stresses were determined and the normal stresses were assumed to be 0. Figure 12 shows the results obtained. A large variation is observed in longitudinal stresses. Low longitudinal compressive stresses are observed in the base metal and in the center of FSW, whereas tensile stresses are observed in the TMAZ. This is the well known ”M” shape generally described in FSW longitudinal residual stresses [6]. An increase in the compressive transverse stresses is observed in the FSW nugget. Higher stresses were observed on the advancing side than on the retreating side.
X Length (mm)
Z Depth (mm)
Fig. 12: Transverse and longitudinal residual stress profiles in FSWeld determined with
ILL-SALSA instrument, the shaded area represents the welded zone.
DISCUSSION
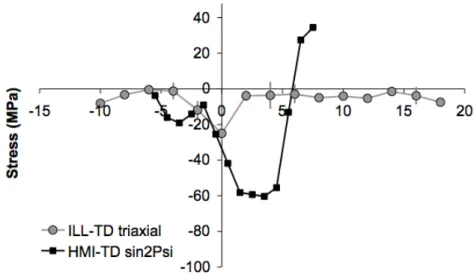
The FSW residual stresses were determined using several experimental techniques and the results showed the same tendencies. The results obtained using sin2 ψ methods (HMI-E3) and triaxial method (ILL-SALSA) were in relative good agreement, exhibiting compressive transverse residual stresses in the nugget (Figure 13). The comparison between XRD and Neutron diffraction techniques (ILL) was performed using equivalent stresses and hydrostatic stresses (equations 1 and 2). ! "eq = 1 2
(
"11#"22)
2 +(
"22#"33)
2+(
"33#"11)
2(
)
+ 6(
"132+"232+"232)
(
)
$ % & ' ( ) 1 2 (1) ! pH =1 3(
"11+"22+"33)
(2)The results both showed higher residual stresses in the TMAZ area. XRD results revealed higher residual stress values (Figure 14). The residual stress analysis is a mean value among a gage volume, which is far smaller in XRD than in Neutron diffraction. Moreover, the XRD experiments were performed on the weld top surface, exhibiting then also the shoulder
contribution that is the main cause of residual stress generation [10]. The influence of the plastic anisotropy could also explain the differences observed [10,11]. Indeed, whereas the elastic anisotropy is very weak, the plastic anisotropy is very strong causing high intergranular strains. This will influence the peak position and therefore, the stresses calculated will also depend on the peak chosen for the analysis. In our study, the pyramidal peak chosen in XRD is very close to a basal peak, whereas the ones chosen for neutron diffraction analysis are closer to prism peaks. The results obtained are consistent with previous studies across FSWelds, which were
mainly performed on aluminum alloys [6, 7, 8]. The asymmetry generally observed between the advancing and retreating sides is confirmed. They also exhibited the "M shape" profile in the LD, which was attributed to the precipitation evolution within the nugget area. A recent neutron diffraction study was done on 6.5 mm thick AZ31 Friction Stir Processed samples (bead on plate) [9]. It showed a similar evolution of the residual stresses in the LD (i.e. "M shape") but also similar evolutions in the TD and ND with a deeper drop in the weld center area. The decrease in residual stresses in the weld nugget can not be due to precipitation evolution in AZ31 alloy [12] but could be caused by the texture evolution in this area [9].
In our study, we also observed high compressive stresses in the weld center area, but the higher tensile stresses at the pin edges were not seen in the ND and TD. This may be due to the different spatial resolution used.
Fig.13: Comparison of transverse residual stress evolution across FSWeld determined with
HMI-E3 and ILL-SALSA instrument
Fig. 14: Comparison of Equivalent stress and hydrostatic stress evolution across FSWeld
determined with XRD and ILL-SALSA instrument
CONCLUSIONS
The residual stress evolution across AZ31 FSWeld was characterized with X-ray diffraction and Neutron diffraction, using triaxial and sin2 ψ methods.
The results obtained with the different methods used showed the same tendencies:
Compressive transverse residual stresses in the FSW nugget and tensile longitudinal residual stresses in the TMAZ.
ACKNOWLEDGEMENTS
This work was performed as a part of AEROMAG Project "Aeronautical Application of Wrought Magnesium" (Project N° AST4-CT-2005-516152) which was supported by the European Union. The authors wish to thank EADS-IWF, Suresnes for Friction Stir Welding, Robert Wimpory of HMI, Berlin and Darren Hughes of ILL, Grenoble for Neutron diffraction investigation.
REFERENCES
[1] H. Dölle, V.Hauk, Z. Metallkde 69, pp. 410, 1978
[2] E. Pluyette, J.M. Sprauel, A. Lodini, M. Perrin, and P. Todeschini
Residual stresses evaluation near interfaces by means of neutron diffraction : modelling a spectrometer. In Proceedings of ECRS4, pp. 153–163, 1996.
[3] E. Pluyette, J.M. Sprauel, M. Cerretti, and P. Todeschiniand A. Lodini. Neutron
diffraction residual stress evaluation around a bimetal welded joint. In: Proceedings of ICRS5, Institute of technology, Linköping’s University, 16-18 june 1997, pp. 604–609, 1997.
[4] E. Pluyette. Evaluation par diffraction de neutrons, des contraintes résiduelles dans les liaisons bi-métalliques. PhD thesis, ENSAM, 1997.
[5] T. R. Long and C. S. Smith. Single-crystal elastic constants of magnesium and magnesium alloys. Acta Metallurgica, 5(4):200–207, 1957.
[6] R.S. Mishraa and Z.Y. Ma. Friction stir welding and processing. Materials Science and Engineering Reports, 50(1-78), 2005.
[7] C.Dalle Donne, E. Lima, J. Wegener, A. Pyzalla, and T. Buslaps. Investigations on residual stresses in friction stir welds, in: Proceedings of the Third International Symposium on Friction Stir Welding, Kobe, Japan, September 27–28, 2001.
[8] M. Peel, A. Steuwer, M. Preuss, and P. J. Withers. Microstructure, mechanical properties and residual stresses as a function of welding speed in aluminium AA5083 friction stir welds. Acta Materialia, 51(16):4791–4801, 2003.
[9] W. Woo, H. Choo, M.B. Prime, Z. Feng and B. Clausen, Microstructure, texture and residual stress in a Friction-Stir-Processed AZ31B Magnesium alloy, Acta Materialia, 56:1701–1711, 2008.
[10] W. Woo, H. Choo, M. Preuss, D.W. Brown, B. Clausen, Z. Feng and P. K. Liaw. Residual strain measurements in a Friction-Stir Processed AZ31B magnesium alloy using neutron diffraction, Materials Science Forum Vols. 539-543, pp. 3795-3800, 2007. [11] D.W. Brown, R. Varma, M.A.M. Bourke, T. Ely, T.M. Holden, and S. Spooner, A neutron diffraction study of residual stress and plastic strain in welded beryllium rings, in: Proceedings of ECRS 6, Coimbra 10-12 july 2002, Materials Science Forum Vol. 404 p. 741, 2002.
[12] L. Commin, J.-E. Masse, M. Dumont, L. Barrallier, FSW of AZ31 magnesium alloy rolled sheets-influence of processing parameters. Acta Materialia, 57 (2), pp. 326-334, 2009.