Science Arts & Métiers (SAM)
is an open access repository that collects the work of Arts et Métiers Institute of Technology researchers and makes it freely available over the web where possible.
This is an author-deposited version published in: https://sam.ensam.eu Handle ID: .http://hdl.handle.net/10985/7434
To cite this version :
Nicolas MARTIN, Jan LINTYMER, Aurélien BESNARD, Fabrice STAHL - Reactive Gas Pulsing Process for Oxynitride Thin Films - 2013
Reactive gas pulsing process for oxynitride thin films
Nicolas MARTIN1,*, Jan LINTYMER2, Aurélien BESNARD3 and Fabrice STHAL1 1. FEMTO-ST Institute, 32, Avenue de l’observatoire, 25044 Besançon, France
2. Comadur SA, Le Col 33, CH-2400 Le Locle, Switzerland
3. LaBoMaP, Centre Arts et Métiers ParisTech de Cluny, Rue porte de Paris, 71250 Cluny, France * Corresponding author: Tel.: +33 (0)3 81 85 39 69; Email: [email protected]
Abstract
An original reactive sputtering method, namely the reactive gas pulsing process (RGPP) was developed for the synthesis of titanium oxynitride thin films. Such a method implements a metallic titanium target DC sputtered, a constant supply of argon and nitrogen gases and a pulsing oxygen mass flow rate, which is periodically controlled versus time. Various period times and different patterns can be generated: rectangle, sine, isosceles triangle, mounting or descending triangle and exponential. Real time measurements of the target potential as well as total sputtering pressure are recorded in order to study the instability phenomena of the process. They are also pertinent diagnostic tools to select the most suitable pulsing patterns required to alternate the process between the nitrided and the oxidized sputtering modes. As a result, alternation is produced for exponential and rectangular patterns. For this latter, the influence of the duty cycle α defined as the ratio of the injection time of oxygen by the pulsing period, on the behaviour of the reactive sputtering process and optical properties of deposited films, is systematically investigated. Finally, the added value brought by the exponential patterns is examined. It is shown that the exponential signal leads to significant improvements of the oxygen injection. The purpose is to introduce the right amount of oxygen so as to poison the titanium target surface without saturating the sputtering atmosphere by oxygen. Thus, the speed of pollution of the target surface appears as an appropriate parameter to better understand the beneficial effect of the exponential shape on the control of the RGPP method.
Keywords
Reactive sputtering, reactive gas pulsing process (RGPP), titanium oxynitride, rectangular pulses, exponential pulses, duty cycle
1. Introduction
Reactive magnetron sputtering process is a widely used technique to deposit many different kinds of compounds. Basically, oxides, nitrides, carbides or sulphides of single or several metallic compounds can be produced by this method [1-4]. However, a typical phenomenon of the reactive sputtering process is an hysteresis loop of some experimental parameters as the reactive gas is injected into the chamber. This non linear evolution of the deposition parameters has deeply been investigated and modelled by many researchers [5-12]. Such attractive field of studies is mainly due to the reactive mode is an exciting way to synthesize
thin solid films with variable compositions. Nevertheless, because of the non linear effects versus the reactive gas flow rate, some compositions are quit difficult, indeed impossible to achieve (e.g. metalloid deficient concentrations) without using improved devices [13-15] or feedback control systems [16-18]. Thus, the strong majority of these studies have been focused on the avalanche-like transition between the metallic and the compound sputtering modes involving a single metallic target and only one reactive gas like oxygen, nitrogen acetylene, etc. [19-23]. For the deposition of ternary compounds like metallic oxynitrides, a single metallic target and two reactive gases – oxygen and nitrogen – can be used. Hence, the reactive sputtering process becomes more complex and it restrains the final properties of the films. In order to reach some compositions, the conventional way employs a very high nitrogen mass flow rate in comparison to that of the oxygen. Since oxygen exhibits a stronger reactivity than nitrogen with regards to the metal, this classical method limits the range of metalloid concentrations and does not solve the drawbacks of the reactive sputtering mode for the synthesis of oxynitride films.
An original approach was recently proposed by Sproul et al. [24, 25] using a feedback control device of oxygen and nitrogen gases by mass spectrometry. It successfully led to the preparation of silicon and titanium oxynitride thin films with adjustable chemical concentrations and a judicious process control. Aronson et al. [26] and recently others [27-34] proposed an innovative approach for the deposition of metallic oxides or nitrides in which, the reactive gas was pulsed on and off at regular times. Finally, Martin et al. [35-39] and afterwards other authors [40-45] developed the reactive gas pulsing process (RGPP) for the deposition of metallic oxynitride thin films.
The motivation of this chapter is a reporting on this RGPP method, especially applied for the synthesis of tuneable titanium oxynitride coatings. A metallic titanium target was sputtered using oxygen and nitrogen as reactive gases. Nitrogen mass flow rate was kept constant whereas that of the oxygen was periodically introduced with various period times and different patterns. A strong emphasis was put in the rectangular signal. A systematic change of the duty cycle α from 0 to 100 % of a constant pulsing period was carried out. Last but not least, the exponential patterns were particularly examined and led to an enhanced control of the oxygen injection, i.e. a better control to introduce the right amount of oxygen gas so as to poison the surface of the target without saturating the sputtering atmosphere by the most reactive gas. From real time measurements of the target potential and sputtering pressure, poisoning of the target surface was discussed. It was correlated with the deposition rates and optical transmittance of the films in order to better understand the reason why RGPP can improve the control of the reactive sputtering for oxynitride thin films.
2. Materials and methods
Titanium oxynitride thin films were sputter deposited by dc reactive magnetron sputtering. A stainless-steel chamber (60 L) was evacuated with pumping units (turbomolecular pump backed by a mechanical pump) down to a residual vacuum close to 10-5 Pa. The metallic titanium target (purity 99.6 at. % and 51 mm diameter) was sputtered with a constant current density JTi = 100 A.m-2. The substrate holder was grounded and maintained at room
temperature during the deposition. The target-to-substrate distance was 50 mm. The pumping speed was kept constant at S = 10 L.s-1. Argon and nitrogen mass flow rates were maintained at 2.30 and 0.80 sccm, respectively. These operating conditions correspond to argon and nitrogen partial pressures of 0.24 and 0.09 Pa, respectively. Thus, these partial pressures lead to the full nitridation of the titanium target surface. Oxygen was introduced using a home-made computer controlled system, namely the reactive gas pulsing process (RGPP). Such a
system allows a well-controlled injection versus time of the oxygen gas according to various patterns and characteristics (cf. § 3). Deposition rates were calculated from thickness measurements and the corresponding deposition time. Optical transmittance was measured at 633 nm for coatings deposited on glass substrates with a constant thickness close to 400 nm.
3. Strategy for pulsing 3.1. Shape of the pulse
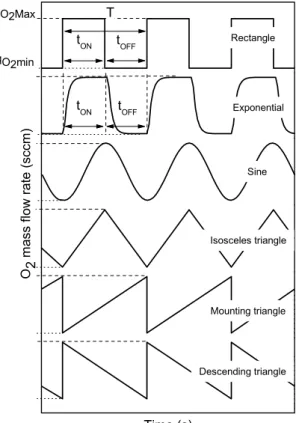
RGPP system allows an accurate control of the oxygen injection versus time. Various periodic mass flow rates versus time can be generated: rectangle, sine, triangle (isosceles, mounting, descending) and exponential patterns (Fig. 3.1).
qO2min qO2Max tOFF tON tOFF tON T Rectangle Isosceles triangle Descending triangle Time (s) Exponential Sine O2 ma ss fl ow r at e ( sc cm ) Mounting triangle
Figure 3.1 Different periodic shapes of pulsing patterns of the oxygen mass flow rate versus time. Pulsing period
T, injection times tON and tOFF as well as maximal qO2Max and minimal qO2min oxygen mass flow rates can be controlled by RGPP.
Period of pulses T, times of injection tON and tOFF, as well as maximal and minimal oxygen
mass flow rates qO2Max and qO2min, respectively, can accurately be modified. For every
deposition, the titanium target was pre-sputtered in argon atmosphere at 0.24 Pa for five minutes. Afterwards, nitrogen was supplied up to a partial pressure corresponding to the nitrided sputtering mode, i.e. N2 pressure close to 0.09 Pa. The process was stabilised for five
minutes in the nitride mode. At last, oxygen gas was introduced according to the different pulsing patterns as illustrated in figure 3.1. The period was first changed from 10 to 400 s. In addition, for rectangular and exponential signals, equal tON and tOFF times were used. For
(cf. § 3.3 for the description of exponential signals). The minimal oxygen mass flow rate was fixed at qO2min = 0 sccm in order to completely stop the oxygen injection during the tOFF time.
On the other hand, the maximum oxygen flow rate was set at qO2Max = 2.0 sccm. Such a value
corresponds to the minimum amount of oxygen required to avalanche the basic Ti – O2
process in the compound (oxidised) sputtering mode [46].
First measurements were focused on the deposition rate as a function of the type of pulsing pattern (Fig. 3.2). 0 100 200 300 400 90 120 150 180 210 240 270 De po si tion rate (nm h -1 ) Period T (s) square exponential sinus isosceles triangle mounting triangle descending triangle
Figure 3.2 Deposition rate of titanium oxynitride thin films versus the pulsing period T for various pulsing patterns.
It is worth to notice that the rate does not only depend on the pulsing period T, but it is also influenced by the shape of the pulse. One can suggest that the signals can be divided into two groups. The first one is composed of all triangular signals whereas the second one puts together rectangular, exponential and sine signals. For all triangular signals, the lowest rates are measured from 115 to 145 nm.h-1 as the pulsing period rises from 10 to 400 s. It is mainly assigned to the trapping of the process in the oxidised sputtering mode. In spite of qO2min = 0
sccm and increasing the triangular pulsing period, the time of nitridation of the target surface associated to the minimal amount of oxygen required to restore the process in the nitrided mode trap the process in the oxidised mode, even for the longest period T of 400 s. As a result, the process remains in the oxidised sputtering mode and transparent titanium oxynitride thin films are always produced for any triangular pattern.
For the second group, deposition rates show a very similar evolution versus the pulsing period. A maximum rate is measured for a pulsing period T in-between 150 to 200 s. A significant drop of the deposition rate is noticed when the period decreases and is lower than 200 s. It is mainly attributed to the alternation of the process between nitrided and oxidised sputtering mode. Such alternation occurs more and more frequently as the pulsing period is reduced. On the other hand, for pulsing periods higher than 300 s, deposition rates of the three types of signals tend to become constant close to 180 nm.h-1. An increasing pulsing period leads to longer time sequences in nitrided or oxidised sputtering modes. Thus, during the tON
time, titanium oxide is mainly deposited whereas during the tOFF time, titanium nitride is
produced. Long enough pulsing periods lead to the synthesis of periodic TiN/TiO2 multilayers
and a constant deposition rate.
The highest deposition rate is obtained for rectangular patterns. For this type of signal, oxygen injection is abruptly changed from 2.0 to 0 sccm at the end of the tON time. It means that the
process rapidly comes back to the nitrided mode compared to the exponential signal. For this latter signal, oxygen mass flow rate does not change so rapidly versus time when tOFF time
starts since τdes = 1 s. Thus, during a single pulsing period, oxidised sputtering mode
predominates for the exponential signal in spite of an alternation of the process between each mode for both signals. In addition, assuming that the sputtering yield Y of titanium dioxide is lower than that of titanium nitride (YTiO2 = 0.015 and YTiN = 0.08 for an argon ion energy of
400 eV [47]), rectangular pulses lead to the highest deposition rate.
From optical transmittance at 633 nm of the films deposited on glass substrates (film thickness is 400 nm), one can easily assess if titanium oxynitrides behave as a nitride or an oxide compound (Fig. 3.3)
0 100 200 300 400 0 20 40 60 80 T ran smitta nc e a t 6 33 nm (%) Period T (s) Square Exponential Sine Isosceles triangle Mounting triangle Descending triangle
Figure 3.3 Optical transmittance measured at 633 nm versus pulsing period T for titanium oxynitride thin films
(400 nm thick) deposited on glass substrates for various pulsing patterns.
For transparent thin films typical of titanium dioxide material, the optical transmittance at 633 nm is higher than 70 % whereas a transmittance lower than few % or null, correlates with absorbent compounds, commonly met in titanium nitride. At first, it is worth to note that optical transmittance remains constant close to 75 % for sine and all triangular patterns and for all pulsing periods. It corresponds to the deposition of transparent TiO2 films with
nitrogen as doping. These highest optical transmittances well correlate with the lowest deposition rates measured in figure 3.2. Titanium dioxide films are also obtained with the sine pulse in spite of enhanced deposition rates observed for pulsing periods higher than 200 s. Thus, a fully oxidized state of the target surface is not systematically required to produce transparent titanium dioxide films.
An important drop from 75 to 10 % of the optical transmittance can be noticed with rectangular and exponential signals when the pulsing period is higher than 200 s. These results well illustrate that rectangular and exponential pulses are the most suitable patterns to produce tuneable titanium oxynitride thin films with behaviours included between those of metallic titanium nitride and dielectric titanium oxide. Such a drop is even more marked for rectangular signals since this kind of patterns abruptly switches the process between nitrided and oxidized sputtering mode. Consequently, rectangular and exponential pulses appear as the most suitable signals to synthesize a wide range of oxynitride compounds.
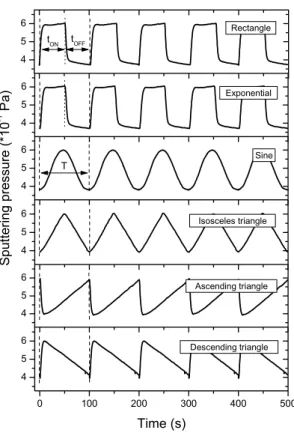
In order to understand the pertinence of rectangular and exponential pulses, real time measurements of the sputtering pressure (Fig. 3.4) and titanium target potential (Fig. 3.5) versus time were systematically recorded.
4 5 6 4 5 6 4 5 6 0 100 200 300 400 500 4 5 6 4 5 6 4 5 6 Exponential Isosceles triangle Ascending triangle Descending triangle Time (s) T Sine Spu tter ing pressure (* 10 -1 Pa ) tOFF tON Rectangle
Figure 3.4 Sputtering pressure versus time for all pulsing shapes and for a constant pulsing period T = 100 s. For
rectangular patterns, tON = tOFF = 50 % of the pulsing period T. The same operating conditions were used for exponential signals with τmou = τdes = 1 s.
The type of patterns can be easily distinguished from the sputtering pressure versus time measurements. It is especially significant for sine and all triangular signals. Because of the process is completely trapped in the oxidized sputtering mode (there is no tOFF time for these
patterns), the target surface is mainly poisoned by the oxygen gas and the sputtering pressure well follows the changes of the oxygen mass flow meter. For ascending and descending triangular patterns, pressure does not accurately show triangular shape at the beginning of the pulsing period. For ascending triangles, oxygen flow rate is abruptly stopped and the drop of the sputtering pressure depends on the pumping speed and on the capacity of the process to be restored to the nitrided mode. For descending triangles, peaks of the sputtering pressure are not sharp because of the low pumping speed (S = 10 L.s-1), but also due to the kinetics of the target oxidation.
Sputtering pressure measured for rectangular and exponential patterns exhibit very similar features because the τ times involved in these experiments, lead to oxygen mass flow rates very close to the rectangle ones. At the beginning of the tON time, pressure abruptly increases
from Psput = 0.33 to 0.63 Pa and becomes nearly constant after few tens seconds. It correlates
with the transition of the process from the nitrided to the oxidized sputtering mode, which depends on the operating conditions such as current density applied to the target, maximum oxygen mass flow rate qO2Max, pumping speed S, etc. When oxygen injection is stopped
rapidly drops and tends to its original value corresponding to the nitrided mode, i.e. Psput =
0.33 Pa. Here again, the abruptness of the pressure decrease depends on the sputtering parameters, especially the pumping speed of the process. Afterwards, the sputtering pressure slightly reduces and tends to the nitrided steady state value (Psput = 0.33 Pa). These pressure
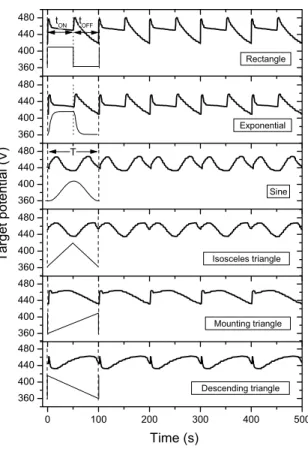
variations can be correlated with the non linear evolutions of the target potential (Fig. 3.5).
360 400 440 480 360 400 440 480 360 400 440 480 360 400 440 480 360 400 440 480 0 100 200 300 400 500 360 400 440 480 Sine Isosceles triangle Mounting triangle Exponential Ta rg et poten tia l (V) T tOFF tON Rectangle Time (s) Descending triangle
Figure 3.5 Titanium target potential as a function of time for all pulsing shapes and for a constant pulsing period T
= 100 s. For rectangular patterns, tON = tOFF = 50 % of the pulsing period T. The same operating conditions were used for exponential signals with τmou = τdes = 1 s.
Such a potential is a fundamental parameter, which gives important knowledge on kinetics and phenomena occurring on the target surface. For sine and isosceles triangular patterns, the evolution of the target potential versus time is very similar. The process is trapped in the oxidized sputtering mode. For the maximum oxygen flow rate (time corresponding to the half period T), target potential is minimum (UTi < 440 V) because the process tends to the steady
state in the oxidized sputtering mode. As the oxygen mass flow rate drops, the process trends to be restored to the nitrided mode since the potential exhibits a maximum. However, this time spent at a very low or null oxygen introduction is too short. The next period starts and the oxidized state prevails. It is also the case for mounting and descending triangular patterns. The process is mainly in the oxidized sputtering mode in spite of some possible times to alternate with the nitrided one at the beginning and at the end of the pulses for mounting and descending triangular signals, respectively.
As previously noticed for the sputtering pressure measurements, the target potential versus time is very identical for rectangular and exponential patterns. Abrupt changes and peaks of the potential are observed at the beginning of each tON and tOFF times. It well correlates with
constant and corresponds to the oxidized sputtering mode. Potential exhibit sharp peaks, which corresponds to a rapid oxidation of the target surface compared to the broader peaks of potential noticed when tOFF starts. The decrease of potential is slower without reaching a
constant value. It means that the process alternates between oxidized and nitrided mode, but nitridation is not completely reached.
Thus, taking into account sputtering pressure in figure 3.4 and target potential measurements in figure 3.5, the process is not necessarily at the steady state conditions just because the sputtering pressure has reached its steady state values [48, 49]. In addition, these results show that rectangular and exponential signals appear as the most suitable patterns to get an alternation of the process between the nitrided and oxidized sputtering modes, and consequently to produce titanium oxynitride thin films with tuneable properties. Pulsing parameters have to be adjusted, especially tON and tOFF times, i.e. the duty cycle parameter. 3.2. Duty cycle
Exponential and rectangular signals are the only patterns involving tON and tOFF times. The
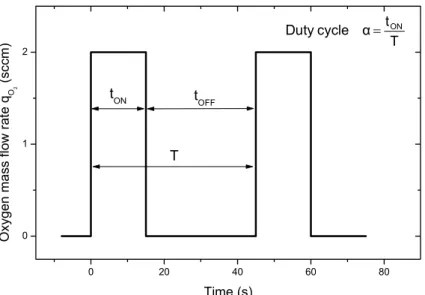
previous part of this chapter particularly showed that the periodic injection and stop of oxygen allowed an alternation of the reactive sputtering process between the nitrided and oxidized sputtering modes. Thus, this second part aims at investigating the role of some temporal parameters of RGPP, especially the influence of the duty cycle α for the rectangular pulses, on the behaviours of the reactive sputtering (Fig. 3.6).
0 20 40 60 80 0 1 2 T t α cycle Duty = ON T tOFF tON O xy ge n m ass f low r at e q O2 (s cc m) Time (s)
Figure 3.6 Typical rectangular signals showing a schematic view of pulsed oxygen mass flow rate versus time
with a pulsing period T = 45 s and a duty cycle α = 0.111, i.e. tON = 15 s and tOFF = 30 s.
To this aim, a constant pulsing period T = 45 s was used. The tON time is related to the time
when the oxygen flows into the sputtering chamber at its maximum value, i.e. qO2Max. It was
set to = qO2Max 2.0 sccm since this value is the minimum amount required to stabilize the
process in the oxidized sputtering mode for single Ti – O2 system in our experimental set-up
described in § 2. The tOFF time corresponds to the minimum oxygen mass flow rate qO2min.
During this time, oxygen injection is completely stopped in order to avoid the trapping phenomenon of the process in the oxidized sputtering mode [50, 51], i.e. = qO2min 0 sccm. So,
ON ON
ON OFF
t t
α = =
t + t T (1)
Such a parameter was systematically changed from 0 to 100 % of the pulsing period T so as to show that this is one of the most relevant parameter, which can be adjusted to tune the properties of titanium oxynitride thin films.
The influence of the duty cycle α on the deposition rate is firstly investigated (Fig. 3.7).
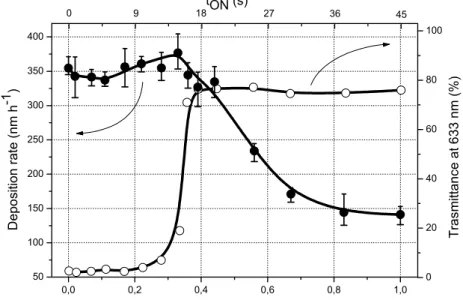
0 20 40 60 80 100 0,0 0,2 0,4 0,6 0,8 1,0 50 100 150 200 250 300 350 400 T rasm itt a nc e a t 63 3 nm ( % ) 0 9 18 tON (s) 27 36 45 D e po sitio n rate (nm h -1 ) Duty cycle α
Figure 3.7 Deposition rate and average optical transmittance at 633 nm of titanium oxynitride thin films sputter
deposited on glass substrate as a function of the duty cycle α and the corresponding tON oxygen injection time.
A continuous evolution of the rate can be noticed as α rises. This behaviour can be considered as a strong advantage compared to the conventional reactive sputtering, where a typical feature is the sudden drop of the deposition rate as a function of the reactive gas flow rate. In addition, non linear phenomena of the process are not observed by RGPP, whereas a metallic target sputtered with argon and oxygen or nitrogen or both, commonly exhibits hysteresis effects of the deposition parameters. In figure 3.7, deposition rate is slightly enhanced for α = 0.33 and is even higher than that of titanium nitride (i.e. 355 nm.h-1). A maximum rate of 375 nm.h-1 is reached at α = 0.33. Afterwards, deposition rate regularly reduces and tends to that
of titanium dioxide (i.e. 140 nm.h-1) measured for a continuous introduction of the oxygen gas.
Similarly, the average optical transmittance measured at 633 nm for titanium oxynitride thin films deposited on glass, exhibits a strong increase for duty cycles corresponding to the maximum deposition rates. These optical measurements are representative of the transparency of the film-substrate system in the visible region. As a result, up to duty cycles α = 0.22, films are strongly absorbent with an optical transmittance lower than few percents. Inversely, transparent and dielectric thin films are produced with duty cycles higher than α = 0.39, where transmittance is close to 75 %. Some typical interference fringes are observed (not shown here). A transition zone occurs for duty cycles in-between 0.22 and 0.39. Transmittance abruptly increases from few to 75 % and semi-transparent titanium oxynitride thin films are synthesized for this range of duty cycles. Such a range appears as the most relevant conditions to reach tuneable oxynitride compounds. As previously examined in § 3.1,
real time measurements of the target potential and sputtering pressure versus time can also be taken into account to understand the smooth transition of the deposition rate versus duty cycle and the gradual change of synthesis from nitride to dielectric compounds. Up to α = 0.28, the process predominantly remains in the nitrided sputtering mode. During a single pulsing period, the average target potential is enhanced leading to an increase of the deposition rate. Absorbent coatings are obtained since the nitrided mode prevails. For duty cycles higher than α = 0.28, the poisoning time of the target surface by the oxygen becomes longer and the time available to recover the nitrided mode is reduced. A titanium oxide layer is formed on the target surface for a longer time. Thus, it decreases the particles ejection from the target since the sputtering yield of titanium dioxide is lower than that of titanium nitride. Consequently, the deposition rate decreases and transparent titanium dioxide thin films are produced. So, the transition from nitride to oxide compounds can be obtained with rectangular pulses playing with the duty cycle. This transition is located for α included between 0.3 and 0.4 assuming the most significant change of the optical transmittance from few to 75 %. It means that about (0.4 – 0.3) × 45 = 4.5 s can be spent to adjust the process so as to get various titanium oxynitride compounds. It will be shown in the next paragraph § 3.3 that this narrow temporal window can be extended using exponential patterns, particularly optimising τmou and τdes
times.
3.3. Exponential signal
Typical exponential equations were used in order to control oxygen mass flow rate versus time according to exponential patterns. The following equation (2) well describes the flow rate during the tON time.
( )
(
)
mou2 2 2 ON 2
mou
-t τ
O O Max O min -t O min
τ 1 - e q t = q - q × + q 1 - e (2)
where qO2(t) is the oxygen mass flow rate versus time (sccm), t the time (s), qO2Max the
maximum oxygen flow rate (sccm), qO2min the minimum oxygen mass flow rate (sccm), τmou
the tau mounting time (s). Similarly, equation (3) gives the oxygen mass flow rate versus time during the tOFF time.
( )
(
)
des2 2 2 OFF 2
des
-t τ
O O Max O min -t O min
τ 1 - e q t = q - q × + q 1 - e (3)
where τdes is the tau descending time (s). These equations well show that the exponential
signals can provide an extended range of pulsing patterns as illustrated in figure 3.8. Taking into account previous results claim in § 3.1 and 3.2, especially about the relevance of using rectangular and exponential patterns, as well as the requirement to implement a tOFF time long
enough to allow an alternation of the process between the nitrided and the oxidized sputtering mode, the tau descending time τdes was kept constant at 10-1 s and the minimum oxygen flow
rate qO2min was set to 0 sccm. It corresponds to a complete stop of the oxygen injection during
the tOFF time (Fig. 3.8). On the other hand, during the tON time, maximum oxygen mass flow
rate qO2Max was maintained at 2 sccm as before and the tau mounting time τmou was
3.8). Such operating conditions allow tuning more accurately the amount of oxygen introduced into the sputtering process.
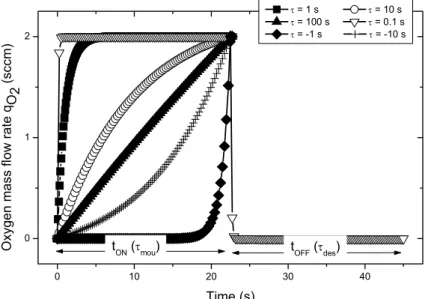
0 10 20 30 40
0 1 2
tON (τmou) tOFF (τdes)
τ = 1 s τ = 10 s τ = 100 s τ = 0.1 s τ = -1 s τ = -10 s Oxyg en mass fl ow rate q O 2 (sccm) Time (s)
Figure 3.8 Various shapes of signals can be generated with exponential pulses adjusting tau mounting time τmou and tau descending time τdes. Tau descending time τdes is set to 0.1 s so as to stop the oxygen injection as similarly employed for rectangular pulses.
As previously performed in § 3.2 with rectangular pulses, the duty cycle was systematically changed from α = 0 to 100 % of a constant pulsing period T = 45 s. Achieved deposition rates as a function of the duty cycle and for various τmou are nearly constant, close to 350 nm.h-1.
The maximum of deposition rate versus α previously observed for rectangular pulses (Fig. 3.7) is not so significant with exponential ones. Moreover, the optical transmittance at 633 nm of the films deposited in glass substrates exhibit the gradual transition from absorbent titanium nitride to transparent titanium dioxide compound as shown in § 3.2 (Fig. 3.9).
0,0 0,2 0,4 0,6 0,8 1,0 0 20 40 60 80 TiN TiO2 45 36 27 18 9 0 tONtime (s) τmou = 10-1 s τmou = 1 s τmou = 10 s τmou = 100 s τmou = -10 s τmou = -1 s Tr an sm ittance at 63 3 nm (% ) Duty cycle α
Figure 3.9 Optical transmittance at 633 nm of titanium oxynitride thin films deposited on glass versus duty cycle α and for τmou = -10, -1, 10-1, 1, 10 and 102 s. The gradual transition zone from absorbent TiN to transparent TiO2 compound depends on duty cycle α and tau mounting time τmou.
The transition is always produced for all positive τmou times and a shift to high duty cycles is
clearly evidenced as τmou rises from 10-1 to 102 s. In addition, it is also worth of noting that the
enhancement of transmittance is not so abrupt as τmou time increases. As a result, a widening
of the duty cycle window suitable to gradually deposit titanium oxynitrides appears. These shift and widening effects are correlated with the amount of oxygen introduced in the process during the tON time. Changing the τmou time allows controlling the shape of the pulse and thus
the injected oxygen. A rectangular-like signal is generated if τmou → 0 s whereas a mounting
triangular-like signal is produced for τmou → + ∞ s.
For negative τmou times, duty cycles lower than 0.44 always lead to absorbent coatings. The
gradual and shifted transition of the optical behaviours from TiN to TiO2 is even more
extended and moved to higher duty cycles for τmou = -10 s. This duty cycle window
corresponds to more than 20 s of the tON time against 4.5 s previously determined with
rectangular pulses in § 3.2 and with deposition rates similar to that of titanium nitride (about 350 nm.h-1). This enhancement is again due the possibility to reduce the amount of oxygen
introduced into the process during the tON time. Besides for negative τmou times in-between -
∞ to 0 s, the pulsing signal can be varied from triangle to Dirac-like shape. A finer injection of oxygen is then achieved. For τmou → 0- s, the shape of the signal looks like an artefact and
injected oxygen becomes negligible. Therefore, negative τmou times must be lower than -10 s,
but higher than -100 s to obtain the maximum size of the transition window from titanium nitride to titanium dioxide compounds.
The widening of this transition zone can be correlated with poisoning kinetics of the target surface via the real time measurements of the target potential (Fig. 3.10).
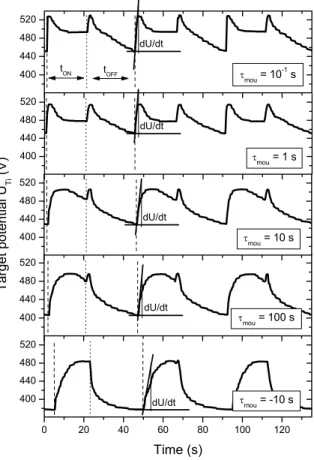
400 440 480 520 400 440 480 520 400 440 480 520 400 440 480 520 0 20 40 60 80 100 120 400 440 480 520 dU/dt dU/dt tOFF tON τ mou = 10 -1 s τmou = 1 s dU/dt τmou = 10 s T ar get po te nt ial U Ti (V) dU/dt τmou = 100 s dU/dt τmou = -10 s Time (s)
Figure 3.10 Titanium target potential versus time for exponential patterns with various tau mounting times τmou. The pulsing period was kept at T = 45 s, the duty cycle α = 0.444 and the tau descending time τdes = 10-1 s. Derivative dU/dt was calculated at the beginning of each tON time in order to determine the speed of pollution of the target surface.
For τmou = 10-1 and 1 s, the potential evolution versus time exhibits a very similar feature to
that previously measured for rectangular pulses in § 3.1. At the beginning of the tON and tOFF
times, potential peaks are systematically observed. They are mainly assigned to the oxidation of the target surface when oxygen is injected as the tON time starts, and when the oxygen is
stopped (beginning of the tOFF time), the process tends to be restored to the nitrided mode.
Thus, an alternation of the process between both modes occurs for these operating conditions. Increasing the τmou time, the abrupt rise of the target potential observed for low τmou times at
10-1 or 1 s, becomes less significant. In addition, the potential peak is not so sharp. It is shifted at the end of the tON time and the maximum target potential decreases from 528 to 495 V as
τmou changes from 10-1 to 102 s. A lower amount of oxygen is injected into the process during
the tON time and the poisoning of the target surface is less efficient. Consequently, the time
required to restore the process in the nitrided mode is reduced. The maximum of the target potential recorded at the beginning of the tOFF time, is strongly diminished and vanishes for
τmou = -10 s.
Target potential does not exceed 485 V for a single period, and exponential growths and decays are periodically measured during the tON and tOFF times, respectively. These
behaviours are closely related to the kinetics of pollution of the target surface. Formation and thickness of the poisoned layer depends on the amount of reactive gas introduced into the chamber. A given time is required to reach the steady state equilibrium and to build up the oxide (or nitride) layer on the target surface. Taking into account the target potential evolution versus time measured for τmou = -10 s, one can claim that a thinner oxide layer is formed on
the target surface than at positive τmou times. Moreover, the potential is down to 385 V for
τmou = -10 s at the end of the tOFF time. This value corresponds to a predominance of the
nitrided state of the target.
The abrupt increase of the target potential noticed at the beginning of the tON time, supplies
valuable information about poisoning kinetics of the target surface. The speed of pollution can be estimated from the time derivative of the potential dU/dt [52]. Such a speed of pollution was determined versus the tau mounting time τmou and for a constant duty cycle α = 50 % of
the pulsing period T, i.e. tON = tOFF (Fig. 3.11).
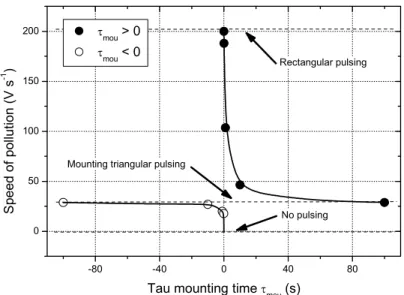
-80 -40 0 40 80 0 50 100 150 200
Mounting triangular pulsing
No pulsing Rectangular pulsing τmou > 0 τmou < 0 S pee d of po llut ion (V s -1 )
Tau mounting time τmou (s)
Figure 3.11 Speed of pollution of the target surface versus τmou time calculated from the time derivative of the target potential. Speed values obtained with rectangular (τdes = 0 s) and mounting triangular pulses (τmou → + ∞ or -∞) are given. No pulsing means no injection of the oxygen gas.
The hyperbolic-like graph produced can be divided into two parts: positive and negative τmou
= 10-1 s times. The maximum speed of pollution reaches 200 V.s-1 and is obtained for positive τmou times as τmou → 0 s. It corresponds to rectangular patterns and thus, a maximum amount
of oxygen is injected during the tON time. A slight increase of the τmou time leads to a sudden
drop of the speed and finally, to an asymptotic value close to 29 V.s-1 as τmou → + ∞ s. This
increasing τmou time also gives rise to a longer time to reach a critical oxygen flow in order to
avalanche the process in the oxidized sputtering mode. It is well correlated with the maximum of the peak potential, which is shifted and attenuated at the end of the tON time as the τmou time
increases. In addition, the asymptotic evolution of the speed does not only depend on the kinetics of the process, it is also due to the pulsing signal itself since a mounting triangular pattern is generated for τmou higher than 102 s. So, it is worth to note that implementing
positive τmou times only, the range of pollution speeds is restricted.
The negative τmou times also exhibit the same asymptotic value of the speed, i.e. dU/dt = 29
V.s-1. Mounting triangular pulses are similarly produced for τmou lower than 10-2 s as
previously generated for τmou → + ∞ s. On the other hand, the speed can be chiefly reduced
and becomes null when τmou times are in-between 0 and -10 s. For this negative range of τmou
times, the amount of oxygen introduced into the process becomes negligible since a peak-like shape is generated (Fig. 3.8). Technical limitations of RGPP appear, i.e. instead of pulsing a sharp and narrow peak (Dirac-like shape), artefact is rather obtained or no pulsing occurs for τmou between -10-2 and 0 s. However, very low speeds of pollution and thus an improved
control of the RGPP can be achieved for τmou times lower than -10-2 s.
4. Conclusion
The reactive gas pulsing process (RGPP) is an original and new method successfully implemented for the synthesis of titanium oxynitride thin films by reactive sputtering. Nitrogen mass flow rate is kept constant whereas that of the oxygen gas is periodically introduced versus time. Various shapes of signals can be generated including rectangle, exponential, sine, isosceles, mounting and descending triangles. Many temporal and flow parameters can be adjusted in order to improve the control of the reactive gas pulsing process. It is clearly established that exponential and rectangular patterns are the most relevant pulsing shapes required to deposit tuneable titanium oxynitride thin films. A large panel of physical and chemical properties from the metallic titanium nitride to the dielectric titanium dioxide can be prepared using rectangular or exponential patterns by RGPP. For both signals, an alternation of the reactive process between the nitrided and oxidized sputtering modes is achieved without trapping the system in the fully oxidized state, as produced with sine and triangular patterns. For such patterns, transparent TiO2-like compounds are systematically
deposited for any operating conditions.
The requirement of a complete stop of oxygen injection (i.e. tOFF time) is demonstrated thanks
the most significant results produced with rectangular and exponential signals. To this aim, the role of the duty cycle α on the behaviours of the reactive sputtering process and the nature of as-deposited films is of fundamental interest. A systematic change of the duty cycle α from 0 to 100 % of a constant pulsing period T clearly demonstrates a gradual transition from nitride to oxide compounds. Deposition rate as well as optical transmittance in the visible region (and consequently other physico-chemical properties) monotonously vary. The full oxidation or nitridation of the target surface can be avoided and a wide range of titanium oxynitrides is achieved by only changing the duty cycle parameter.
Last but not least is the particular case of exponential pulses. They dot not only allow some technical improvements of the RGPP method, but they mainly bring a strong upgrading of the oxygen injection thanks to some adequate adjustments of the temporal parameters peculiar to the exponential signals. Speed of pollution of the target surface is again reduced and alternation of the process between nitrided and oxidized sputtering modes is even more controlled. As a result, implementation of exponential pulses widens the pertinent duty cycles window compared to rectangular ones.
Finally, RGPP is not only an exciting method, which was developed to deposit tuneable and homogeneous titanium oxynitride thin films, it can also be involved to reach periodic multilayered structures of oxide/nitride, oxynitride/oxide, etc. at the micro- and nanoscale. In addition, the method can be extended to more complex systems implementing the pulsing of several reactive gases in a multitarget sputtering process.
Acknowledgements
RGPP was developed in the framework of the European project NMP3-CT-2003-505948 “HARDECOAT”. European Union is acknowledged for its financial support.
References
1 I. Safi, Surf. Coat. Technol. 127, 203 (2000). 2 W.D. Sproul, Science 273, 889 (1996).
3 R.P. Howson, Pure Appl. Chem. 66, 1311 (1994).
4 S. Schiller, K. Goedicke, J. Reschke, V. Kirchhoff, S. Schenider, F. Milde, Surf. Coat. Technol. 61, 331 (1993).
5 S. Berg, H.O. Blom, T. Larsson, C. Nender, J. Vac. Sci. Technol. A5, 202 (1987). 6 D. Depla, R. De Gryse, Surf. Coat. Technol. 183, 184 (2004).
7 E. Kusano, J. Appl. Phys. 70, 7089 (1991). 8 L. Pekker, Thin Solid Films 312, 341 (1998).
9 A. Billard, C. Frantz, Surf. Coat. Technol. 59, 41 (1993).
10 A. Kinbara, E. Kusano, S. Baba, J. Vac. Sci. Technol. A10, 1483 (1992). 11 M. Hecq, A. Hecq, M. Fontignes, Thin Solid Films 115, 45 (1984). 12 S. Kadlec, J. Musil, J. Vyskocil, J. Vac. Sci. Technol. A8, 1560 (1990). 13 G. Este, W.D. Westwood, J. Vac. Sci. Technol. A2, 1238 (1984).
14 T. Larsson, H.O. Blom, C. Nender, S. Berg, J. Vac. Sci. Technol. A6, 1832 (1988). 15 J. Danroc, A. Aubert, R. Gillet, Surf. Coat. Technol. 33, 83 (1987).
16 W.D. Sproul, P.J. Rudnik, C.A. Gogol, R.A. Mueller, Surf. Coat. Technol. 39-40, 499 (1989).
17 W.D. Sproul, Surf. Coat. Technol. 33, 73 (1985). 18 A.F. Hmiel, J. Vac. Sci. Technol. A3, 592 (1984).
19 P. Carlsson, C. Nender, H. Barankova, S. Berg, J. Vac. Sci. Technol. A11, 1534 (1993). 20 N. Martin, C. Rousselot, J. Vac. Sci. Technol. A17, 2869 (1999).
21 H. Barankova, S. Berg, P. Carlsson, C. Nender, Thin Solid Films 260, 181 (1995).
22 T. Kubart, D.H. Trinh, L. Liljeholm, L. Hultman, H. Hogberg, T. Nyberg, S. Berg, J. Vac. Sci. Technol. A26, 565 (2008).
23 F. Vaz, P. Cerqueira, L. Rebouta, S.M.C. Nascimento, E. Alves, P. Goudeau, J.P. Riviere, K. Pischow, J. de Rijk, Thin Solid Films 447, 449 (2004).
25 W.D. Sproul, D.J. Christie, D.C. Carter, S. Berg, T. Nyberg, 46th Annual Technical Conference Proceedings, 98 (2003).
26 A.J. Aronson, D. Chen, W.H. Class, Thin Solid Films 72, 535 (1980).
27 H. Sekiguchi, A. Kanzawa, T. Imai, T. Honda, J. Vac. Sci. Technol. A12, 3176 (1994). 28 H. Sekiguchi, T. Murakami, A. Kanzawa, T. Imai, T. Honda, J. Vac. Sci. Technol. A14,
2231 (1996).
29 D. Gall, R. Gampp, H.P. Lang, P. Oelhafen, J. Vac. Sci. Technol. A14, 374 (1996). 30 R.P. Howson, N. Danson, I. Safi, Thin Solid Films, 351 32 (1999).
31 N. Martin, J. Lintymer, J. Gavoille, J. Takadoum, J. Mater. Sci. 37, 4327 (2002). 32 N.M.G. Parreira, T. Polcar, A. Cavaleiro, Surf. Coat. Technol. 201, 5481 (2007).
33 N.M.G. Parreira, T. Polcar, N.J.M. Carvalho, A. Cavaleiro, European Phys. J.: Appl. Phys. 43, 321 (2008).
34 N.M.G. Parreira, T. Polcar, A. Cavaleiro, Plasma Process. Polym. 4, 62 (2007).
35 N. Martin, O. Banakh, A.M.E. Santo, S. Springer, R. Sanjinès, F. Lévy, Appl. Surf. Sci. 185, 123 (2001).
36 N. Martin, R. Sanjinès, J. Takadoum, F. Lévy, Surf. Coat. Technol. 142-144, 615 (2001). 37 N. Martin, J. Lintymer, J. Gavoille, J.M. Chappé, F. Sthal, J. Takadoum, F. Vaz, L.
Rebouta, Surf. Coat. Technol. 201, 7720 (2007).
38 N. Martin, J. Lintymer, J. Gavoille, J.M. Chappé, F. Sthal, J. Takadoum, F. Vaz, L. Rebouta, Surf. Coat. Technol. 201, 7727 (2007).
39 N. Martin, J. Lintymer, J. Gavoille, J.M. Chappé, F. Sthal, J. Takadoum, F. Vaz, L. Rebouta, Surf. Coat. Technol. 201, 7733 (2007).
40 P. Carvalho, L. Cunha, E. Alves, N. Martin, E. Le Bourhis, F. Vaz, J. Phys. D: Appl. Phys. 42, 195501 (2009).
41 C. Petitjean, M. Grafouté, C. Rousselot, J.F. Pierson, Surf. Coat. Technol. 202, 4825 (2008).
42 H. Le Dréo, O. Banakh, H. Keppner, P.A. Steinmann, D. Brian, N.F. de Rooij, Thin Solid Films 515, 952 (2006).
43 J.M. Chappé, P. Carvalho, S. Lanceros-Mendez, M.I. Vasileskiy, F. Vaz, A.V. Machado, M. Fenker, H. Kappl, N.M.G. Parreira, A. Cavaleiro, E. Alves, Surf. Coat. Technol. 202, 2363 (2008).
44 M. Fenker, H. Kappl, C.S. Sandu, Surf. Coat. Technol. 202, 2358 (2008). 45 A. Aubry, S. Weber, A. Billard, N. Martin, Appl. Surf. Sci. 257, 10065 (2011).
46 T. Kubart, D. Depla, D.M. Martin, T. Nyberg, S. Berg, Appl. Phys. Lett. 92, 221501 (2008).
47 N. Martin, C. Rousselot, Surf. Coat. Technol. 110, 158 (1998).
48 L.B. Jonsson, T. Nyberg, S. Berg, J. Vac. Sci. Technol. A18, 503 (2000).
49 L.B. Jonsson, T. Nyberg, I. Katardjiev, S. Berg, Thin Solid Films 365, 43 (2000).
50 N. Martin, A.R. Bally, P. Hones, R. Sanjinès, F. Lévy, Thin Solid Films, 377-378, 550 (2000).
51 J.M. Chappé, N. Martin, J. Lintymer, F. Sthal, G. Terwagne, J. Takadoum, Appl. Surf. Sci. 253, 5312 (2007).