HAL Id: hal-02399904
https://hal.archives-ouvertes.fr/hal-02399904
Submitted on 9 Dec 2019
HAL is a multi-disciplinary open access
archive for the deposit and dissemination of
sci-entific research documents, whether they are
pub-lished or not. The documents may come from
teaching and research institutions in France or
abroad, or from public or private research centers.
L’archive ouverte pluridisciplinaire HAL, est
destinée au dépôt et à la diffusion de documents
scientifiques de niveau recherche, publiés ou non,
émanant des établissements d’enseignement et de
recherche français ou étrangers, des laboratoires
publics ou privés.
Driver Awareness of Pedestrians
Vincent Frémont, Minh-Tien Phan, Indira Thouvenin
To cite this version:
Vincent Frémont, Minh-Tien Phan, Indira Thouvenin. Adaptive Visual Assistance System for
En-hancing the Driver Awareness of Pedestrians. International Journal of Human-Computer Interaction,
Taylor & Francis, 2019, 36 (9), pp.856-869. �10.1080/10447318.2019.1698220�. �hal-02399904�
of Pedestrians
Vincent Frémont
a, Minh-Tien Phan
b, Indira Thouvenin
baCentrale Nantes, CNRS, UMR 6004, LS2N, Nantes, France;
bSorbonne Universités, Université de Technologie de Compiègne, CNRS, UMR 7253, Heudiasyc, Compiègne, France;
In the past decade, Pedestrian Collision Warning Systems have been proposed to detect pedes-trians and warn drivers of imminent collision. However, such systems are often limited by eye-off-road and cognitive overload problems. Head Up displays with augmented reality are being considered as a key technology for changing drivers’ user experiences. In this paper, we propose a new visual assistance system that can enhance drivers’ perception by dynamically directing attention to pedestrians to avoid collisions using Augmented Reality cues. The pro-posed system takes into account driver behaviors through vehicle driving signals analysis, in order to warn it at the right moments. To that end, we statistically model correct and incorrect driver behaviors in situations with pedestrians. Based on this model, a warning visual metaphor is displayed if unawareness is detected and a driving simulator was used to evaluate the con-cept. The experimental results suggest that our proposed adaptive visual aids can enhance driver awareness of pedestrians in critical situations.
Keywords:driver behavior, augmented reality, human system interaction, pedestrian safety, machine learning
1 Introduction
Pedestrians are considered to be among the most vulner-able road users while also being unpredictvulner-able and difficult to observe in both day-and night-time conditions. A report from (WHO, 2013) stated that half of the world’s road traf-fic deaths occur among pedestrians, cyclists, and motorcy-clists. In high-income countries, pedestrian fatalities are rel-atively low but still represent a large societal and economic cost. In developing countries such as India and China, the problem is much worse, as cars, buses, and trucks share the roads with large numbers of two-and three-wheelers, bicy-clists, and pedestrians as presented in (Mock et al., 2004; Mohan, 2002). Pedestrian safety is therefore a major moti-vation for research by the scientific community and the au-tomobile industry. Several car suppliers currently equip their vehicles with specific Advanced Driver Assistance Systems (ADAS) known as Pedestrian Collision Warning Systems (PCWS) (see (Ahmadi and Machiani, 2019; Dagan et al., 2004)). Such systems detect pedestrians in front of the car, calculate the time to collision, and warn the driver if the colli-sion is imminent. However, engineering such systems
with-Correspondence concerning this article should be addressed to Pr. Vincent Frémont, Centrale Nantes, CNRS, UMR 6004, LS2N, 1 rue de la Noë, Nantes, France. E-mail: [email protected]. ORCID iD: 0000-0002-1627-2241
out understanding driver attention states and driving styles can make them extremely distracting and annoying when de-tecting pedestrians. Moreover, head-down-displays mounted on the dashboard require the driver to turn their head and shift their gaze to identify the problem, augmenting the dan-ger and cognitive overload (Gandhi and Trivedi, 2007).
Head-Up Displays (HUD) in cars become a great oppor-tunity for a wide range of Augmented Reality (AR) applica-tions. The work of (Gabbard et al., 2014) focused on naviga-tion support to display naviganaviga-tional hints in the field of view of the driver. This helps to decrease the time drivers spend looking at dashboard displays rather than the road. AR ap-plications were further studied using simulators in (Charissis and Papanastasiou, 2011; Kim and Dey, 2009; Schall Jr et al., 2013) with promising results in the support of elder drivers. The AR was found to be able to direct driver attention in crit-ical situations without distraction. In (Fisher and Tan, 1989; Jonides, 1981), the authors found that a “dynamic blinking” cue used for highlighting can also be effective for attracting attention. In (Yeh and Wickens, 2001), the authors studied the effects of cue reliability and image realism on attention allocation. They demonstrated that cueing aided target detec-tion in an aviadetec-tion visual task and that target detecdetec-tion accu-racy can be enhanced when object cues are not conspicuous. In another experiment proposed in (Rusch et al., 2013), the authors showed that such AR cues did not interfere with the perception of non-target objects or with driver performance. They also confirmed that highlighting cue alerts helped to
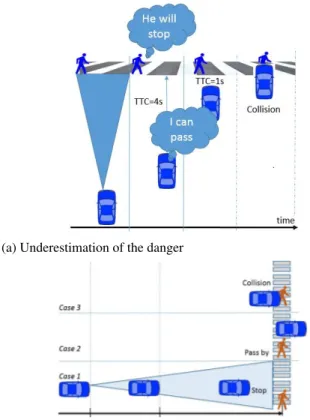
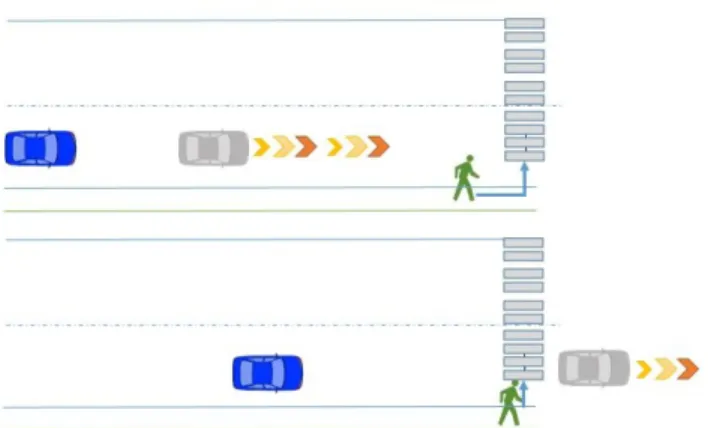
direct driver attention to potential hazards. In scenarios with pedestrians, if the driver notices the pedestrian, carefully an-alyzes the situation, and chooses correctly to stop or pass by the pedestrian safely, they are considered to be aware of the pedestrian (Cases 1 and 2 in Fig 1b). If not, they are considered to be unaware of the pedestrian (Case 3 in Fig. 1b). Cases of unawareness can include a lack of perception of the pedestrian or perception that occurs too late for reac-tion. Most of the time, however, unawareness occurs when the driver underestimates the risk of the given situation (see Fig. 1a).
(a) Underestimation of the danger
(b) Cases 1 and 2: The driver should be aware of the pedestrian. If not (case 3), a warning is activated
Figure 1. Use cases with a pedestrian
In this paper, a visual assistance system that uses AR cues to enhance driver vigilance is proposed. This work fo-cuses on situations in which driver attention is directed to pedestrians by analyzing and guiding driver behavior in spe-cific situations. Using the driving signals such as the vehi-cle speed, the acceleration pedal position, the braking force, the steering wheel angle and the Time-To-Collision, a su-pervised learning approach is proposed to determine if the driver is probably aware or unaware of a pedestrian. Then, based on this driver state estimation an AR metaphor con-taining a bounding box and a warning panel is displayed to enhance the driver’s awareness of the pedestrian in a virtual environment. An experiment involving 23 participants using the driving simulator was carried out to analyze the benefits
of the proposed adaptive visual aid system in a virtual envi-ronment.
The main contributions of the paper are as follows. • We explore the global scope of learning-based
gener-ative models for driver awareness of pedestrian using only driving signals and multivariate Hidden Markov models;
• Based on this original driver’s awareness of the pedes-trian estimation, we propose a new HMI design through virtual and augmented reality cues, evaluated with 25 participants;
• We conducted an extensive review of the relevant state-of-the-art approaches in the field of driver awareness and HMI design through virtual and augmented real-ity;
• To better analyze the benefits of adaptive visual aids, we propose and implement an intelligent AR configu-ration, called iAR, where both the DAP/DUP classifi-cation and the critical situations are taken into account for metaphors display. In that way, the visual aids are displayed only when the driver is determined to be un-aware of a pedestrian.
The paper is organized in five sections. The first section is used to present the model of driver behavior in situations with pedestrians. In the second section, the proposed visual aids for uses in augmented reality are described. In the third section, the experiments, driving simulator, simulated HUD, experimental protocol, and data collection methodology are described. The fourth section presents statistical results sup-porting the proposed approach. A discussion and conclusion are then given in final section.
2 Driver’s behaviors modeling in situations with a pedestrian
In this paper, the main contribution is the design of a su-pervised learning approach that estimates the driver aware-ness of a situation using only the driving signals such as the vehicle speed, the acceleration pedal position, the braking force, the steering wheel angle and the Time-To-Collision. Here, we do not consider eye-off-road issues using for exam-ple, gaze tracking information in our model.
2.1 Related Works
In the driver’s inattention research field, potential direct measures such as physiological signals sensors (Akin et al., 2008; Wesley et al., 2010) and visual behaviors observation (Bergasa et al., 2008; Doshi and Trivedi, 2012; Lin et al., 2012) can be used to detect the degree of driver attention or distraction. In (Imamura et al., 2008) and (Ueno et al., 1994),
driver drowsiness was indirectly detected through vehicle speed, steering wheel motion, lateral position, and acceler-ation pedal states. In 2004, the projects conducted by Hu-man Machine and the Safety of Traffic in Europe (HASTE) (Ostlund et al., 2004) demonstrated that changes from base-line in steering position measurements are significantly af-fected by the visual task. In (Jensen et al., 2011), the authors also proposed a combination of three analysis methods to evaluate the driver’s performance: data threshold violations, phase plane analysis with limits and a recurrence plot with outlier limits. The advantages of such measurements are that they are unobtrusive, easy to obtain, and quite precise. 2.2 Conceptual model
To the best of our knowledge, there are no studies that are directly related to the estimation of the driver unaware-ness of pedestrian or other traffic events. The most closely related works are those of (Fukagawa and Yamada, 2013) who proposed a hypothesis that is likely linked to our work. Their study was based on the driver’s operational data such as pressure on the accelerator pedal, pressure on the brake pedal (called acceleration reaction), steering angle and ve-hicle behavior data such as veve-hicle speed to estimate the driver’s awareness of pedestrian. In our driving simulator, we chose to use the following 4 driving signals, since due to technical limitations, the head/gaze tracking signals were not available.
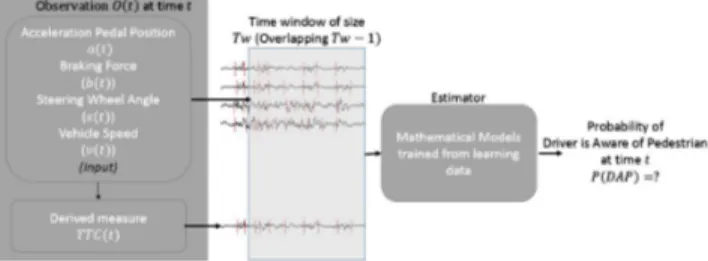
Therefore, in this paper, the considered signals for driver awareness of pedestrian estimation (see Fig. 2), are the fol-lowing:
• The vehicle speed, denoted as v in km h−1;
• The acceleration pedal position, denoted as a, which is normalized to values in the range [0; 1], where val-ues of 0 and 1 correspond, respectively, to the driver completely releasing and completely pressing the ac-celerator pedal;
• The braking force, denoted as b, with values ranging from [0; 400] (Newton Unit - N);
• The steering wheel angle, denoted as s with values ranging from [−π, π] radian rad.
• The TTC in seconds, representing the relationship be-tween the distance to a pedestrian and the speed of the vehicle, is also considered. TTC is the most well-known time-based safety indicator. The TTC is calcu-lated as T T C = |v−vd
p|. Where v and vpare the vehicle
current speed and the pedestrian speed respectively, d is the distance between the vehicle and the pedestrian.
Figure 2. Proposed conceptual model for estimating driver awareness of a pedestrian.
2.3 Learning the Driver’s Behavior from Driving Sig-nals
To formalize the problem into a classification approach, the driving signals are first collected into a vector at each instant j, as follows:
Oj= [aj, bj, sj, vj, T TCj]T (1) A temporal data sequence of several vectors O( j) is then used as a learning model input, making the total input:
Vi= [Oi, Oi+1, ..., Oi+h.Tw]T (2) where T w is the sequence time window and h.T w is the se-quence size in terms of data points for which h is the sensor frequency calculated in (1/Hz). As proposed and detailed in (Phan et al., 2015, 2014), driver behavior in situations in-volving a pedestrian can be considered as a Hidden Markov process with N distinct states S = {S1, S2, ..., SN}. At each time step j for a state Si, we can observe a 5-dimensional vector Ojcomposed of the driving signals presented in the previous section. The main originality of the proposed ap-proach is to use a discrete HMM to classify the DUP and the DAP. As proposed in (Phan et al., 2015), and using the driv-ing actions, two Gaussian-Mixture-HMMs, one for the DAP and the other for the DUP, are used to classify the driver’s behavior. The problem of DAP or DUP detection can then be formulated as a classification problem (see Fig. 3).
Figure 3. Decision process architecture based on two hid-den Markov models representing the DUP and the DAP, re-spectively. The likelihood ratio is used to classify each new observation.
The behavior classification is working as follows. Two HMM models, λDAPand λDU P, that represent the DAP and
DUP models, are learned from two observation sequences (driving signals) VDAP and VDU P, Using the expectation-maximization (EM) algorithm (Bilmes et al., 1998). Next, given a new sequence of driving signals, V, the forward al-gorithm (Rabiner, 1989) is applied to λDAPand λDU Pto cal-culate the posterior probabilities P(V|λDAP) and P(V|λDU P), respectively. Finally, the likelihood ratio for this classifier,
P(V,λDUP)
P(V,λDAP), is calculated to determine whether the driver is
likely to be aware or unaware of a pedestrian. A threshold eτthis appropriately selected to adjust the performance of the
DAP/DUP classification. As shown in Fig. 3, if the likeli-hood ratio is greater than eτth, the considered driving signals
sequence V is classified as DUP; if not, it is classified as DAP.
2.4 Model training
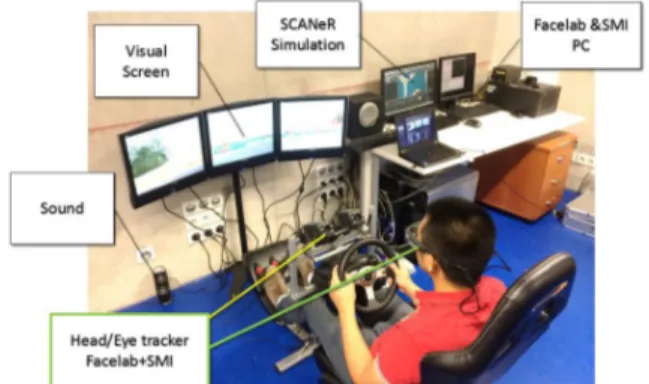
2.4.1 Data collection. A driving simulator was used to obtain training data (see Fig. 4). The user interface of the driving simulator contains a driver seat, a steering wheel, three real pedals, and a clutch kit. 3D images, sound, and interactions between the driver and the simulator interface are piloted using SCANeR Studio software(Oktal, 2015). 10 active drivers (7 men and 3 women) were invited to partici-pate to the study over 10 days. They were asked to drive the simulator as they would drive a real car through predefined scenarios. The driving tests were administered at randomly selected times during the day. The average age of the partic-ipants was 24 years (ranging from 20 to 28).
The main idea here, is to characterize for each driver state DAP and DUP, representative driving data for learning the HMM model. For that purpose, two driving scenarios were designed to represent both DAP and DUP states. For the DAP one, pedestrians appeared in various sections of the driving simulation environment. Before each driving session, the drivers are encouraged to avoid collisions with pedestri-ans, and a message giving the distance to the next pedes-trian is displayed in the bottom-center of the simulator screen throughout the driving time. Furthermore, the driver is asked to press a button on the right-hand side of the steering wheel to indicate that they noticed a pedestrian. If the driver did not collide with a pedestrian during their session, he is con-sidered to be DAP. For the DUP data collection scenario, the same scenarios as in the DAP simulation with neither mes-sages nor button-pressing tasks, were proposed. However, since it is very complicated to provoke unawareness of the driver, artificial collisions were done by masking the pedes-trian (making it invisible for the driver) in the simulation en-vironment. In this way, the driver cannot see any pedestrian, and is then artificially unaware of them. So, if the simulator detected any collisions with the "invisible" pedestrians, the driver was considered to be DUP. Since we conducted exper-iments using a simulator, the DUP considers the unawareness as coming from the environment and not from the driver. In
this case, we could talk about ?Artificial Unawareness? that is to say that the driver is prevented from seeing the pedes-trian, this is not unawareness but a non-event. As we use a simulator, we can only do "Reduced Virtuality", since in that case we can hide elements from the driver and measure its state. To simplify our reporting here, we refer to the two scenarios as DAP and DUP, respectively.
Figure 4. Driving simulator used for manipulating driver awareness of pedestrians.
During the driving assessments, driving data were auto-matically and synchronously logged at 20Hz onto a hard-disk without filtering or smoothing processing. In each DAP driving scenario, the driving data was recorded starting at the time at which the driver pressed the button to the time that the vehicle passed by or stopped in front of the pedes-trian. The same time periods were used to extract data in the DUP driving scenarios, although in these scenarios only driving sessions in which collisions with invisible pedestri-ans occurred were recorded. In this manner, we were able to extract and annotate DAP and DUP behavior, and we ul-timately obtained 2,500 DAP sequences and 1,500 DUP se-quences, which were used in the k − f old cross-validation with k= 4 in the algorithm learning step.
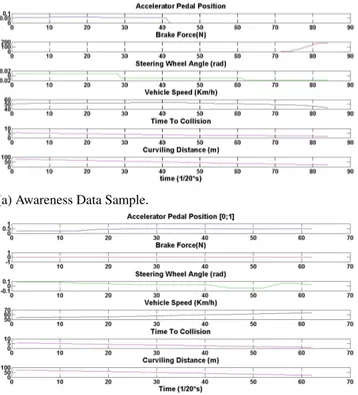
There were some differences between the DAP and the DUP behavior that were readily apparent. Some driver reac-tions, such as decelerating then braking in front of a pedes-trian or turning the steering wheel, appeared to occur when avoiding and then passing the pedestrian. For example, in Fig. 5a, the driver releases the accelerator pedal at 5s of T T C and at 2s of T T C and begins to break. On the other hand, in the DUP manipulations none of these reactions occurred during the same time periods (see Fig. 5b).
We then applied overlapping-sliding-windows of size T w to segment the data into sequences. The T w parameter had to be carefully chosen to capture the characteristics of the respective behaviors; setting T w too long could result in too much noise and can lead to over-fitting, while setting T w too short can lose vital relevant features from the observa-tions. A grid search technique associated with 4− f old cross-validation (Bergstra and Bengio, 2012) and receiver opera-tion characteristic curves (Metz, 1978) was used to
deter-(a) Awareness Data Sample.
(b) Unawareness Data Sample.
Figure 5. DAP and DUP data samples.
mine the optimal parameters of the models. A False Posi-tive Rate (FPR) of 5% was chosen to be in accordance with automotive industry standards as the minimum requirement of the security application value. All combinations of the HMM model parameters were tested to determine the best model parameters for optimizing performance. The decision threshold τh was defined by maximizing the True Positive Rate (TPR) for a given FPR. Thus, the final chosen param-eters were: N = 10, M=2, Tw = 1.5s, and τth= 214. This combination gives the best classification performance with a TPR of 84.2%.
2.5 Visual aids display decisions
Based on the driver’s unawareness estimation proposed above, another contribution of this paper is to create and to evaluate AR aids to warn the driver in critical situations. Two visual aids are chosen: a bounding box around the pedestrian and a warning panel (see Fig. 6). The display decision com-prises a definition of the rules for executing these visual aids. The warning panel is displayed only when a detected sit-uation is considered dangerous or prior to a critical moment. In the first stage, we consider using the time-to-collision (TTC) to determine how dangerous a situation is. Thus, we define the critical TTC (T T Ccritical) to represent the amount of time the driver is given to react after being warned that he is in a potential collision with a pedestrian, and we
fur-Figure 6. The proposed visual cues .
ther define the critical distance (dcritical) as a safety net. In most cases, the T T Ccriticalis given first but, for some cases in which the vehicle approaches a pedestrian with a low speed, the T T Ccritical is met when the vehicle is too close to the pedestrian. To address this gap, the dcriticalis calculated as follows:
dcritical= vveh∗ T T Ccritical (3) For example, when the vehicle speed (vveh) is about 30km h−1 ( 8.3m s−1) and the T T C
critical is found at 2s, the distance is equal to 16.6m, which is already too close to the pedestrian; in this case, dcriticalshould be taken into account first. The critical moment (CM) is then defined as a func-tion of the critical distance (dcritical) to the pedestrian and the T T Ccritical between the vehicle and the pedestrian. As in (Aoude et al., 2012) and (McLaughlin et al., 2008), the choice of T T Ccritical is based on a cumulative human re-sponse time distribution. This distribution answers the fol-lowing question: Given a specific driver response time, what percentage of the population will be able to react to a poten-tial collision?
Generally, for a larger response time a higher percentage of the population will be able to react in time to a warning; paradoxically, however, higher response times are expected to lead to worse performance under warnings because they can become annoying to a driver. Tab. 1 gives the distribu-tion of the cumulative human response distribudistribu-tion at 1.0s, 1.6s, and 2.0s, corresponding to 45%, 80%, and 90% of the population, respectively.
Table 1
Response time population distribution.
T T Ccritical(s) dcritical(m) Population percentage
1.0 8.3 45%
1.6 13.3 80%
2.6 Visual aids configurations
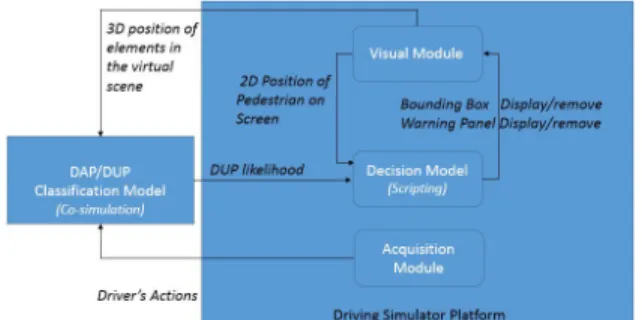
To better analyze and highlight the benefits of adaptive visual aids in terms of distraction and cognitive overload, we tested two different configurations. The first one is a basic configuration (named Augmented Reality or AR) in which, the visual cues are displayed whenever the pedestrian is de-tected, the second one is an intelligent configuration (named intelligent Augmented Reality or iAR), in which, the visual cues are displayed in function of the critical moments (see Tab. 2). In the AR configuration, the bounding box is dis-played whenever a pedestrian is detected in front of the ve-hicle and the warning panel is displayed when a critical mo-ment is detected (i.e., 2s of TTC). In the iAR configuration, the rules are the same as in the AR configuration, except that both the DAP/DUP classification and the critical moments are taken into account. The aids are displayed only when the driver is determined to be unaware of a pedestrian (see Fig. 7).
Figure 7. System architecture for Intelligent Augmented Re-ality (iAR) configuration.
Table 2
Three configurations of the proposed visual aids system.
Configuration Bounding Box
Activation
Bounding Box Deactivation
noAR No No
AR Pedestrian Detected No Pedestrian
iAR DUP detected DAP detected
Panel Activation Panel Deactivation
noAR No No
AR Critical Moment (CM) No CM or
no Pedestrian
iAR DUP Detected at CM DAP detected or
no CM
It is crucial to note that, the reliability plays an impor-tant role in the automation systems. Trust of in-vehicle tech-nology is linked to warning system reliability and sensitiv-ity settings. High False Alarm (FA) rates associated with high sensitivity, can reduce driver trust in the alerting sys-tem and annoy the driver. It can lead to failure of benefit from the warnings and overall increase in driver errors. In
our proposed system, the AR configuration will display the cues with 100% of reliability because of the perfection of the pedestrian detection in the virtual environment. Whereas, in the iAR configuration, the reliability of the display de-cision is strongly related to the reliability of the DAP/DUP classification. Indeed, The DAP/DUP classification has been validated in Section 2.4 and has proven to be at a level of 84.2% of reliability. However, in our case, this result has not been validated on a large number of participants and scenar-ios. Therefore, it is difficult to predict the real benefits of the iAR configuration through a proper statistical analysis. Both configurations have been implemented on a driving simula-tor and an experiment has been set up in order to evaluate the effect of these configurations both in terms of objective and subjective results.
3 Experiments 3.1 Outcome Measures
In this paper, we hypothesized that the systems with AR and iAR configurations would enhance the driver’s vigilance relative to the noAR configuration. Moreover, we expected that the driver’s awareness model is accurate enough (as shown in Section 2.4) and that the iAR could more success-fully warn drivers at the right moment to ensure better perfor-mance during the driving task than in the AR configuration.
In the proposed experiments, independent variable in-cludes the assistance configuration, pedestrian situations, the head vehicle’s behaviors and the participants. The following outcome measures are dependent variables and they are as-sociated with driver awareness of pedestrians and with driver performance.
The outcome measures associated with driver awareness of pedestrians:
• The Visual Reaction Time (VRT) is the moment (cal-culated as a TTC) at which the driver notices the pedestrian and presses the button. This outcome repre-sents the visual attention of the driver and it should be as larger as possible meaning that the driver noticed the pedestrian sooner. We expected that the AR and iAR configurations would enhance pedestrian visibility, al-lowing the driver to notice pedestrians sooner with AR aids.
• The Accelerator Pedal Position (APP) was analyzed. We expected that the driver would be more vigilant when using the visual aids, resulting in smaller APP values in the AR and iAR configurations than in the noAR configuration.
• We also calculated the number of times the driver braked urgently, (Urgent Braking - UB). We hypothe-sized that the driver would perform more urgent brak-ing under the noAR configuration than under the AR
configurations. We expected that the use of visual aids (AR and iAR configurations)would improve driver an-ticipation of pedestrians suddenly crossing the road. The outcome measures associated with driver perfor-mance.
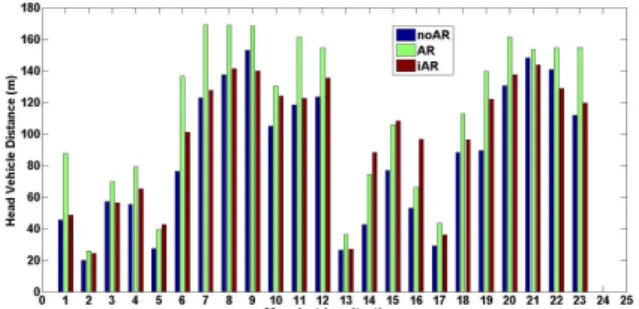
• The Head Vehicle Distance (HVD) was analyzed. We expected that the driver would be more efficient with iAR and would maintain shorter distances to the head vehicle than under the AR configuration.
Subjective measurement. In addition to the above ob-jective outcomes, we also wrote a questionnaire containing 10 main questions and asking the participants their personal opinions on the benefits of the AR cues and on the system in general during their driving task. The questionnaires were filled out at the end of the test.
3.2 Proposed experimental protocol
To evaluate the three configurations (noAR, AR, iAR), the drivers are first cognitively engaged in a specific driv-ing task, the head vehicle-followdriv-ing. Then critical situations with pedestrians are randomly generated and the outcome measures presented above are evaluated.
3.2.1 Driving task principle . During the driving test, a head vehicle-following task was assigned to each driver as a primary task as proposed in (Rusch et al., 2013). The participants had to maintain a constant distance from a head vehicle. At certain road points, pedestrians appears with the intention of crossing the road in front of the vehicle. This head vehicle-following task made the experience more rep-resentative of typical driving situations and engaged drivers so that the perception of pedestrians would be more difficult or easier to dismiss by the driver.
In the experiment, the head vehicle accelerated when it entered into pedestrian situations and passed the pedestrians before the participant’s vehicle did. It was presumed that the participants would also accelerate at this point to catch up with the head vehicle. Furthermore, the pedestrians on the side walk were capable to randomly cross the road at any moment. The participants therefore had to make correct deci-sions between maintaining their separation distance from the head vehicle and lifting up off the accelerator at the pedes-trian crossing (see Fig. 8). The drivers performance in the head vehicle following tasks and their reactions in avoiding accidents with the pedestrians were then measured to evalu-ate the performance of the visual aids.
3.2.2 Designed scenarios. For all configuration (noAR, AR, iAR), 23 pedestrians were placed at the same position on the circuit to create 23 critical situations. So to limit the learning effect between the driving sequences, the pedestrian appearance and behaviors are randomly varying. So for each critical situation, the pedestrian has the same
Figure 8. The head vehicle-following task and situations with a pedestrian. .
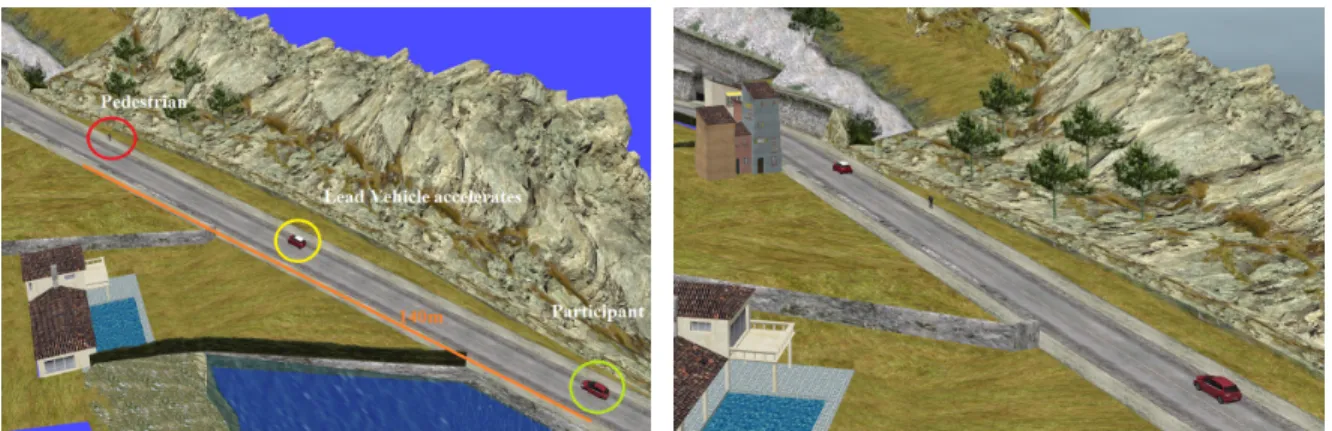
position but it can be a man or a woman, an adult or a child, with diversified clothes colors and it can perform different activities (walking, running, or standing on the sidewalk) randomly generated. The critical situation begins at a distance of 140m from the pedestrian and finishes when both vehicles passed by the pedestrian (see Fig. 9a). When the test vehicle enters the critical situation, the head vehicle increases its speed by 4, 6, 8, or 10 km h−1 and quickly passes by the pedestrian (see Fig. 9b). The acceleration value is chosen randomly to limit the repetition effect. If the distance between the test vehicle and the pedestrian reaches 40m, the pedestrian turns and indicates that they intend to cross the road and, in some cases, actually crosses (see Fig. 9c). Fig. 9d shows a scene from the driver’s point of view at this moment. When both vehicles have passed the pedestrian, the head vehicle decelerates until the distance between the two vehicle reaches 50m prior to initiating a new situation with the next pedestrian. Prior to the driving test, the participant is warned that the pedestrians are vulnerable and can cross the road at any moment even if there is no crossing mark.
3.2.3 Apparatus and participants. To evaluate the proposed system under different display decisions, an ex-periment has been carried out using the driving simulator introduced in the previous section. The experimental trial involved 23 subjects. All of the participants had at least 3 years of licensed driving and were familiar with the simula-tor. Moreover, none of the participants had any eye problems or other physical diminutions. They ranged in age from 21 to 35 years old; 19 subjects were male and 4 were female. Be-cause the subjects were not paid for participating, the sample primarily included only university students, that is obviously a limitation for the evaluation.
3.2.4 Procedure. The experimental procedure com-prises a platform familiarization phase and a testing phase.
Before starting the experiment, each participant receives an explanation of the purpose of the study and provides
con-(a) 3D View of Scenario (phase 1): when both vehicles are in the critical situation (From about 140m from the pedestrian), the head vehicle begins to accelerate.
(b) 3D view of scenario (phase 2): The head vehicle (top) accelerates and passes by the pedestrian.
(c) 3D view of scenario (phase 3): When the distance be-tween the test vehicle and the pedestrian is 40m,the pedes-trian shows intention to cross the road.
(d) Phase 3 from the driver’s viewpoint. At 30m from the pedestrian, the pedestrian suddenly crosses the road.
Figure 9. The proposed scenario with the lead vehicle-following task and a pedestrian crossing the road.
sent. Prior to the drive, the participant is allowed to adjust the seat, steering wheel, and mirrors for comfort. They are then instructed on how to control the simulator. To simplify ma-neuvering by the participant, the vehicle is simulated with an automatic gearbox. We indicate which buttons start and stop the platform, the vehicle pedals and the button they should press whenever they notice a pedestrian.
The participant then engages in two practice sessions. In the first, the participant drives freely to become familiar with the platform. In this driving sequence, they are instructed to adjust the speed to accelerate to 100 km h−1or to stop in front of a crossing mark. The participant is also asked to estimate the vehicle speed. The session ends when the participant pro-vides an accurate answer regarding the actual speed without looking at the dashboard, which is displayed at the upper left corner of the screen. In the second practice session, the par-ticipant is trained to perform the task of following the head vehicle. During this session, the instructor trains the driver to maintain a distance of about 50 m from the head vehicle. There are no pedestrians in the practice sessions, the goal
of which is to train participants in the driving task without using the dashboard, which can influence the effect of the visual cues. When the participants feel that they are familiar with the task, the formal testing begins.
The testing phase comprises 3 driving sequences. Each sequence takes between 15 and 20 minutes, and all three se-quences occur on the same circuit, but traffic elements of in-terest such as the head vehicle’s behavior, the pedestrians’ appearance and their activity (crossing by walking, crossing by running, or standing on the sidewalk) randomly change between tests to eliminate the learning effects. However, due to simulator limitations, the pedestrian geographic positions on the circuit, remain the same.
Moreover, for each driving sequence, the HUD configura-tion is randomly chosen by the instructor using a counterbal-anced design: one driving with no visual assistance (noAR configuration), one with AR aids and one with iAR ones. By changing the order of the configuration between participants, we were able to counterbalance the learning and repetition effects in the overall data set collected from the participants.
4 Results
In the validation step, we considered the mean of each out-come over the sets of participants and pedestrian situations. The differences between the three configurations (noAR, AR, and iAR) were exposed using one-way ANalysis Of VAri-ance (ANOVA) tools. Following up using Tukey’s Hon-est Significant Difference (Tukey’s HSD) test allowed us to specify the configuration with the most varied outcomes. The ANOVA testing enabled us to see how effective the differ-ences between driving with and without visual aids was in term of the driver awareness of pedestrians.
4.1 Objective results
4.1.1 The outcomes associated with the driver aware-ness of pedestrians:
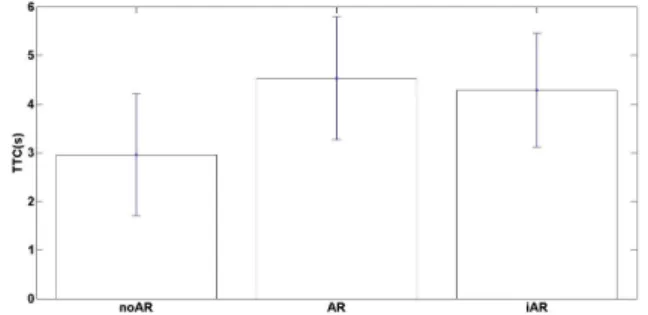
AR followed by iAR configurations increase significantly the Visual Reaction Times. As mentioned previously, this outcome is measured by calculating the TTC at the moment when the driver presses the button to indicate that he has no-ticed a pedestrian in front of the vehicle. For all the exper-iments (driving sequences and aids configurations), only 14 participants followed this specific instruction: “to press the button when seeing a pedestrian”. Therefore we decided to remove the 9 bad answers linked to the VRT and for that point only, the statistics have been done for 14 participants. The VRT corresponds to the perception level of the DAP. Fig 10a shows the VRT results for each of the 23 pedes-trian situations and for the 14 participants that followed cor-rectly the instruction. Fig. 10b shows the mean values of VRT over the three configurations for all pedestrian scenar-ios. The ANOVA results confirmed a statistically significant difference between the noAR, AR, and iAR configurations (F(2, 963) = 18.74, p < 0.05), and Tukey’s HSD test re-vealed that, in the noAR configuration, the drivers noticed pedestrians significantly later when the vehicle was at around 3s of T T C to the pedestrian. Moreover, there was no sig-nificant difference between the AR and iAR configurations, since the drivers noticed the pedestrians at 4.5 and 4.2s of TTC respectively.
Fig. 10a shows that the VRT values for the different pedestrian situations. This is certainly a result of the dif-ferences between road situations, pedestrian behaviors, or latency when pressing the button. However, in each situa-tion the drivers noticed the pedestrian soonest under the AR configuration, followed by iAR and then noAR.
The iAR configuration reduces aggressive accelerations. In each pedestrian situation, the drivers were found to accel-erate more aggressively when there was no visual assistance (the noAR configuration) (see Fig. 11a). The ANOVA results confirmed the difference of APP among the three configura-tions (F(2, 1722) = 9.11, p < 0.05). The Tukey’s HSD test results revealed that the drivers pressed the accelerator pedal
(a) Mean of VRT in each pedestrian situation. The result shows that the driver noticed the pedestrians earliest under the AR configura-tion (in green).
(b) Mean of VRT in all pedestrian situations and over all partici-pants. The drivers noticed the pedestrians soonest under the AR configuration, which is indicated by the TTC being the highest un-der the AR configuration. However, the variance of TTC in each configuration is important because of the variances between partic-ipants or pedestrian situations.
Figure 10. Visual Reaction Times.
most deeply under noAR (mean equal to 0.46), see Fig. 11b. Moreover, there was also a small difference of APP between the AR and iAR configurations.
The AR configuration reduces urgent braking. Brak-ing is considered to be urgent whenever the measured force applied to the pedal is greater than 200N at a TTC smaller than 2s.
Across all of the driving tests, 72, 11, and 26 urgent brak-ing were detected under the noAR, AR, and iAR configura-tions, respectively. This result suggests that the AR configu-ration had the most influence on the drivers’ anticipation in situations with pedestrians. Under the iAR configuration, the bounding box was displayed and removed as a function of the DAP/DUP detection in a manner that was rather quiet. Thus, the missed detection of a DUP could lead to the non-display of cues and could consequently lead to urgent braking when the driver was unaware of a pedestrian. Moreover, whenever cues were removed when a DAP was detected, the drivers tended to think that the danger had disappeared and became less aware of the pedestrian. As a consequence, when the pedestrians crossed the road the drivers had to brake urgently to avoid accidents.
(a) Mean of accelerator pedal position for the three aids configu-rations for each pedestrian situation. Without the AR (noAR con-figuration - blue column), the driver pressed the accelerator pedal most deeply. The AR aid had an effect on the drivers’ acceleration behavior, with the cues provided inducing the drivers to slow down.
(b) Mean of accelerator pedal position for the three aid configura-tions.The drivers pressed the accelerator pedal most deeply under noAR configuration.
Figure 11. Accelerator Pedal Position.
4.1.2 Outcome associated with driving perfor-mances:
The noAR configuration gives best performance for head vehicle distance (shortest). Graphically, the head vehicle-following task was performed best with no AR, in which case it was observed that the drivers maintained the shortest distances to the head vehicle because they were concentrating more closely on the task when there were no aids (see Fig. 12a). The ANOVA results revealed signif-icant differences in HVD among the three configurations (F(2, 1722)= 4.87, p < 0.05). The Tukey’s HSD test results confirmed that, under the AR configuration, the drivers were less concerned with maintaining their distance from the head vehicle (118m), See Fig. 12b. The test also revealed that the drivers performed similarly under the iAR and noAR cases. 4.2 Subjective results
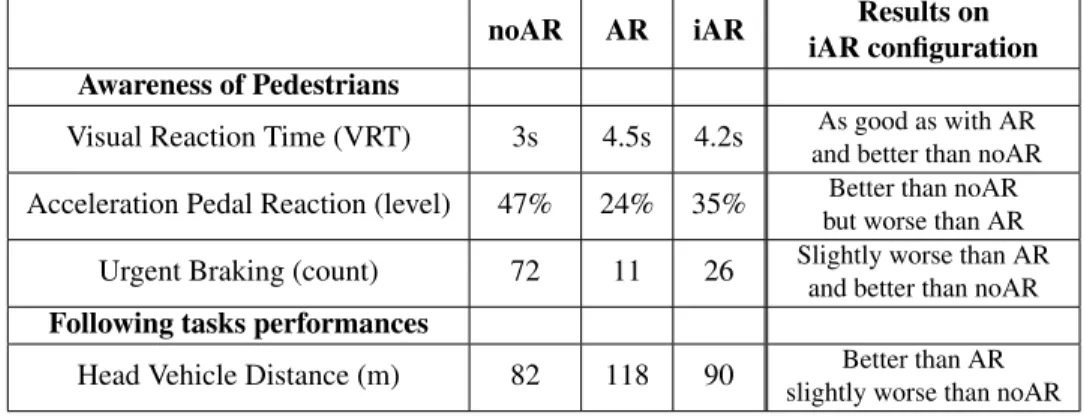
Tab. 3 provides the subjective questions asked after each driving test under the iAR configuration with adaptive visual aids. The subjective feedbacks confirm the objective results presented in Tab. 4 and highlight the overall user experience during the experiments. The results primarily confirmed the advantage of the iAR configuration over classical AR cues.
(a) Head vehicle distances for 23 pedestrian situations. In all pedes-trian situations, the distance between the two vehicles was highest under the AR configuration (green column). The drivers appeared to pay less attention to the head vehicle when the aids were alerting to the presence of a pedestrian. The AR aids were able to direct driver attention from the head vehicle to the pedestrian.
(b) Mean of head vehicle distance (HVD). The results confirm that, under the AR configuration, the drivers were more vigilant to the presence of pedestrians and lost distance from the head vehicle.
Figure 12. Head Vehicle Distance.
In particular, the adaptive behavior of the iAR configuration is positively appreciated by the participants (82%) especially during a specific driving task requiring concentration. The bounding box was found useful for directing driver atten-tion to pedestrians (74%) that corresponds to better visual reaction time while reducing aggressive accelerations (ques-tion Q02- 72%). Moreover, the adaptive nature of the iAR does not degrade the head vehicle distance and gives similar awareness to pedestrian than the full AR cue (question Q07). All of the participants agreed that they had driven in a manner similar to real life (emphquestion Q04). This demonstrated that the drivers felt comfortable with the simulator and the adaptive nature of iAR was not disturbing and distressing. Concerning the focusing task, the head vehicle-following mission was considered to be quite difficult (question Q05), with 87% of the participants answering «difficult», and they commented that the difficulty arose when the head vehicle reacted too spontaneously. This last point is due to the sim-ulator limitation in controlling the head vehicle. However, 83% of drivers answered that they had tried to catch the head vehicle (question Q03) and 82% had been aware of pedes-trians (answered as «normal» or «completely») showing that both the driving task and the adaptive AR were efficient and
without stress (100%). For questions concerning the iAR configuration, all participants answered that they would like to use a HUD in their own cars and most of them (82%) highlighting the efficiency of the iAR configuration (question Q10)in terms of distraction and cognitive overload. On the other hand, 74% of the participants preferred the bounding box cue to the pedestrian panel one (question Q09). They argued that the bounding box helped them to identify where the pedestrian was, while the pedestrian panel forces them to break (73%) and they were not sure if it was an appropriate response (question Q09).
5 Discussion and Conclusion
5.1 Augmented Reality aids have benefits in driver as-sistance systems
This study investigated the potential benefits of using Augmented Reality in driving conditions to enhance drivers attention in situations involving pedestrians. The use of AR aids is expected to enhance driver situational awareness to road users and especially to pedestrians. In this paper, we focused on the adaptive feature of the AR cues. In this con-text, the bounding box was found useful for directing driver attention to pedestrians. This is consistent with the work of (Schall Jr et al., 2013) and (Rusch et al., 2013), who found that bounding boxes can direct driver attention into hazardous events such as pedestrians or road signs. More-over, our accelerator pedal position analysis showed that the presence of a bounding box forced the drivers to slow down and be more vigilant to pedestrians. On the other hand, the manner in which the panel warned the drivers to brake if the situation became critical inducing more urgent braking in front of pedestrians.
Because driving is a visual and motor control process, it is possible that the visual search associated with information retrieval from the aid display degraded driving task perfor-mance. In (Dzindolet et al., 2002), the author highlighted that automation of human aids can cause comparable lev-els of distraction in driver navigation. However, it is also important to remark on the differences between conformal and non-conformal aids: non-conformal aids distract more than conformal aids. Non-conformal aids such as warning panels employ enclosed, non-changing, and opaque rhom-bus shapes, making it difficult for the driver to discriminate between information on targets (pedestrians) on which the aids are highlighted. After our experiments, the participants also commented on this problem. By contrast, the partici-pants commented that the conformal aids (such as the bound-ing box around the pedestrians) did not produce any negative masking effects.
5.2 Taking driver awareness into account is crucial As a supplement to the related work of (Arun et al., 2012), we discuss here an additional important aspect in the design of a new ADAS: The analysis of driver situational awareness while using the system. Essentially, previous works subjec-tively considered driver inattentive states such as sleepiness, drowsiness, or distraction. Such states are helpful but not sufficient in the case of an ADAS for pedestrian safety, as a driver could be in a normal state but, if he underestimates the danger level of the situation, an accident could still occur. Thus, our study was dedicated to a deep analysis of driver interaction with a particular situation involving a pedestrian. Other critical situations have also been considered, includ-ing prior to enterinclud-ing an intersection or more complex danger scenarios ((Aoude et al., 2012; Plavši´c et al., 2010)).
In this paper, through the experiments, the participants were found to be more efficient under the iAR configuration than under the AR configuration. Most participants com-mented that, under the latter configuration, the warning panel displayed at the appropriate moment, allowing the driver to maintain a sufficient distance from the leading vehicle while reacting effectively to the pedestrian; indeed, the results did not show a significant difference between the iAR and the no AR configurations in terms of maintaining distance from the leading vehicle. Moreover, the iAR performed almost as well as the AR configuration in terms of enhancing pedes-trian visibility and the driver’s awareness of the pedespedes-trian (see Tab.4). Thus, the iAR is a compromise solution that helps to enhance driver awareness with good vehicle follow-ing task performances.
5.3 Limitations
During the experiments, we noticed that the drivers’ reac-tions varied significantly among situareac-tions. In the results pre-sented above, the variances of the outcomes are quite impor-tant. Indeed, the drivers’ reactions changed for each pedes-trian situation and during the course of the experiments. The drivers tended to display less caution and vigilance when see-ing the first few pedestrians along the road; after two or three pedestrian crossings, they became more attentive and care-ful. This behavior arose from the fact the drivers did not really consider the simulator to be a real driving situation. This suggests that, in testing with simulators, it is necessary to train the participants and encourage them to engage in the environment to eliminate unrealistic effects. This point has been also highlighted in (Ahmadi and Machiani, 2019).
Since we only focus on driver awareness of pedestrian, the low complexities of the scenarios used could create di ffi-culties in interpreting the results in the iAR configuration. In this case, the pedestrians were easily perceived, so the visibility enhancing effect was superfluous for some drivers and some pedestrian situations. In a previous study of driver
Table 3
Some significant questions asked in the questionnaire
Questions Result
Q01 Do you think you have braked unnecessarily? (never-sometimes-several times) 27%-52%-21% Q02 Did you accelerate at maximum? (never-sometimes-always) 1%-72%-17% Q03 Are you trying to catch the head vehicle? (yes-no) 83%-17% Q04 Do you perform the driving like in real conditions? (yes-no) 100%-0% Q05 How is the driving task? (easy-normal-difficult) 3%-10%-87% Q06 Were you under stress? (not at all-normal-very) 48%-52%-0% Q07 Are you aware of the pedestrians? (completely-normal-not at all) 30%-52%-18% Q08 Would you like to use this combiner HUD? (yes-no) 100%-0% Q09 Which cue do you prefer? (bounding box-warning panel) 74%-26% Q10 Is the iAR efficient? (efficient-average-distracting). 82%-18%-0% Table 4
Summary of experimental results and comments on iAR configuration
noAR AR iAR Results on iAR configuration Awareness of Pedestrians
Visual Reaction Time (VRT) 3s 4.5s 4.2s As good as with AR
and better than noAR
Acceleration Pedal Reaction (level) 47% 24% 35% Better than noAR
but worse than AR
Urgent Braking (count) 72 11 26 Slightly worse than AR
and better than noAR
Following tasks performances
Head Vehicle Distance (m) 82 118 90 Better than AR
slightly worse than noAR
distraction ((Kass et al., 2007)), it was found that impair-ment (increased VRT) depends on scene complexity. Also, consistent with the work in (Yeh and Wickens, 2001), aids saliency played a central role in the ability of the participants to detect targets in this work. The aids helped to ensure that the drivers perceived targets; however, target visibility also played a role in the ability of participants to perceive targets. Some pedestrians were visible before the aid appeared, and therefore in some cases participants responded even before the aid appeared.
Activation and deactivation of aids can be considered to be a driver-vehicle-pedestrian interaction model. In this deci-sion framework, we can take into account the driver’s aware-ness of a pedestrian and the TTC; however, the decision-making module did not take into account pedestrian behav-ior, which may be crucial for this purpose. It is not necessary to display aid cues in cases in which a pedestrian has no in-tention to cross the road. Thus, the system should take into account pedestrian behaviors to provide better aid.
5.4 Conclusion
In this paper, an advanced driving assistance system us-ing visual aids, called AR and iAR, were proposed in the
Figure 13. AR cue on real vehicle equipped with a wind-shield HUD (https://pole-moveo.org/projets/sera/).
context of pedestrian safety. We designed systems that high-light pedestrian presence using a conformal bounding box and warns the driver of a potential collision using a non-conformal warning panel. The study highlighted the impor-tance of taking into account the driver awareness in decision-making. Thus, a model of driver awareness of pedestrians to estimate if a driver is aware or unaware of the presence
of a pedestrian was proposed, with decisions on whether to display visual cues taken based on this awareness model and on TTC information. The results revealed that a system that takes the driver’s behavior into account will maintain the per-formances in the driving task. Moreover, such cues can help the driver to identify pedestrians sooner and to be more vigi-lant of them.
Our findings suggest that adaptive visual aids are promis-ing (iAR) and merit further investigations to highlight their potential as a trade-off between full AR and no AR cues for both driver awareness and efficient driving performances. A more advanced model might also take into account driver visual reactions, and the use of an eye/gaze tracker will be explored in further experiments as proposed in (Martin and Trivedi, 2017). The correlation between the direction of driver gaze to pedestrians and driver reactions will be ana-lyzed to improve the performance of our system.
At this stage, further experiments are planned with the simulator used in this study. However, the protocol should be improved to allow us to measure, both subjectively and objectively, driver awareness of pedestrians. For example, after each passing of a pedestrian, the driving test might emit a buzz and the driver could answer questions concerning the passing conditions (regarding, for instance, the pedestrian’s appearance) to evaluate their situational awareness.
As shown in Fig. 13, a real vehicle with an windshield HUD has been developed and tested with our model to val-idate the proposed ideas in real driving conditions. In this platform, cameras are used for obstacle detection and driver monitoring. Vehicle data from the CAN bus are synchro-nized with this information. We envision multiple future di-rections for the use of this platform. In driver behavior mod-eling, the correlation between driver eye fixation or dynamics and obstacle position will be assessed to enable prediction of driver behavior prior to entering critical situations such as roundabouts or pedestrian crossings. Following a different track, various algorithms including HMM or Deep Neural Networks will be explored using real driving data. Further-more, driver awareness of critical situations will be studied to evaluate driver distraction while using visual aid systems with the real vehicle and its windshield HUD.
Acknowledgements
This work was carried out in the framework of the FUI18 SERA project, and the Labex MS2T which is funded by the French Government, through the program “ Investments for the future” managed by the National Agency for Research (Reference ANR-11-IDEX-0004-02).
6 References
Ahmadi, A. and S. G. Machiani (2019). Drivers’ perfor-mance examination using a personalized adaptive curve
speed warning: Driving simulator study. International Journal of Human–Computer Interaction, 0(0):1–12. Akin, M., M. Kurt, N. Sezgin, and M. Bayram (2008).
Esti-mating vigilance level by using eeg and emg signals. Neu-ral Computing and Applications, 17(3):227–236.
Aoude, G., V. Desaraju, L. Stephens, and J. How (2012). Driver behavior classification at intersections and valida-tion on large naturalistic data set. Intelligent Transporta-tion Systems, IEEE TransacTransporta-tions on, 13(2):724–736. Arun, S., K. Sundaraj, and M. Murugappan (2012). Driver
inattention detection methods: A review. In Sustainable Utilization and Development in Engineering and Technol-ogy (STUDENT), 2012 IEEE Conference on, Pp. 1–6, Kuala Lumpur, Malaysia.
Bergasa, L., M. Nuevo, R. Barea, and E. Lopez (2008). Vi-sual monitoring of driver inattention. In Computational Intelligence in Automotive Applications, D. Prokhorov, ed., volume 132 of Studies in Computational Intelligence, Pp. 19–37. Springer Berlin Heidelberg.
Bergstra, J. and Y. Bengio (2012). Random search for hyper-parameter optimization. The Journal of Machine Learning Research, 13(1):281–305.
Bilmes, J. A. et al. (1998). A gentle tutorial of the em algo-rithm and its application to parameter estimation for gaus-sian mixture and hidden markov models. International Computer Science Institute, 4(510):126.
Charissis, V. and Papanastasiou (2011). Evaluation of col-lision avoidance prototype head-up display interface for older drivers. In International Conference on Human-Computer Interaction, Pp. 367–375, Orlando, FL, USA. Springer.
Dagan, E., O. Mano, G. P. Stein, and A. Shashua (2004). For-ward collision warning with a single camera. In Intelligent Vehicles Symposium, 2004 IEEE, Pp. 37–42. IEEE. Doshi, A. and M. M. Trivedi (2012). Head and eye gaze
dynamics during visual attention shifts in complex envi-ronments. Journal of Vision, 12(2).
Dzindolet, M. T., L. G. Pierce, H. P. Beck, and L. A. Dawe (2002). The perceived utility of human and automated aids in a visual detection task. Human Factors: The Journal of the Human Factors and Ergonomics Society, 44(1):79–94. Fisher, D. L. and K. C. Tan (1989). Visual displays: The highlighting paradox. Human Factors: The Journal of the Human Factors and Ergonomics Society, 31(1):17–30.
Fukagawa, Y. and K. Yamada (2013). Estimating driver awareness of pedestrians from driving behavior based on a probabilistic model. In Intelligent Vehicles Symposium (IV), 2013 IEEE, Pp. 1155–1160, Gold Coast, QLD, Aus-tralia.
Gabbard, J. L., G. M. Fitch, and H. Kim (2014). Behind the glass: Driver challenges and opportunities for ar automo-tive applications. Proceedings of the IEEE, 102(2):124– 136.
Gandhi, T. and M. Trivedi (2007). Pedestrian protection sys-tems: Issues, survey, and challenges. Intelligent Trans-portation Systems, IEEE Transactions on, 8(3):413–430. Imamura, T., H. Yamashita, R. bin Othman, Z. Zhang, and
T. Miyake (2008). Driving behavior classification river sensing based on vehicle steering wheel operations. In SICE Annual Conference, 2008, Pp. 2714–2718, Tokyo, Japan.
Jensen, M., J. Wagner, and K. Alexander (2011). Analysis of in-vehicle driver behaviour data for improved safety. In-ternational journal of vehicle safety, 5(3):197–212. Jonides, J. (1981). Voluntary versus automatic control over
the minn eye movement. Attention and performance IX, 9:187–203.
Kass, S. J., K. S. Cole, and C. J. Stanny (2007). Effects of distraction and experience on situation awareness and simulated driving. Transportation Research Part F: Traffic Psychology and Behaviour, 10(4):321–329.
Kim, S. and A. K. Dey (2009). Simulated augmented reality windshield display as a cognitive mapping aid for elder driver navigation. In Proceedings of the SIGCHI Confer-ence on Human Factors in Computing Systems, Pp. 133– 142. ACM.
Lin, S. T., Y. Y. Tan, P. Y. Chua, L. K. Tey, and C. H. Ang (2012). Perclos threshold for drowsiness detection during real driving. Journal of Vision, 12(9):546.
Martin, S. and M. M. Trivedi (2017). Gaze fixations and dynamics for behavior modeling and prediction of on-road driving maneuvers. In Intelligent Vehicles Symposium Pro-ceedings, Los Angeles, CA, USA.
McLaughlin, S. B., J. M. Hankey, and T. A. Dingus (2008). A method for evaluating collision avoidance systems using naturalistic driving data. Accident Analysis& Prevention, 40(1):8–16.
Metz, C. E. (1978). Basic principles of roc analysis. In Seminars in nuclear medicine, volume 8, Pp. 283–298. Elsevier.
Mock, C., R. Quansah, R. Krishnan, C. Arreola-Risa, and F. Rivara (2004). Strengthening the prevention and care of injuries worldwide. The Lancet, 363(9427):2172–2179. Mohan, D. (2002). Work trips and safety of bicyclists. Indian
Journal of Transport Management, 26(2):225–233. Oktal (2015). Driving simulation engine scaner.
http://www.scanersimulation.com.
Ostlund, J., L. Nilsson, O. Carsten, N. Merat, H. Jamson, S. Jamson, S. Mouta, J. Carvalhais, J. Santos, V. Anttila, et al. (2004). Hmi and safety-related driver performance. ScienceOpen.
Phan, M. T., V. Fremont, I. Thouvenin, M. Sallak, and V. Cherfaoui (2015). Estimation of driver awareness of pedestrian based on hidden markov model. In 2015 IEEE Intelligent Vehicles Symposium (IV), Pp. 970–975, Seoul, South Korea.
Phan, M. T., V. Frémont, I. Thouvenin, M. Sallak, and V. Cherfaoui (2014). Recognizing driver awareness of pedestrian. In 17th International IEEE Conference on In-telligent Transportation Systems (ITSC), Pp. 1027–1032, Qingdao, China.
Plavši´c, M., G. Klinker, and H. Bubb (2010). Situation awareness assessment in critical driving situations at inter-sections by task and human error analysis. Human Factors and Ergonomics in Manufacturing& Service Industries, 20(3):177–191.
Rabiner, L. (1989). A tutorial on hidden markov models and selected applications in speech recognition. Proceedings of the IEEE, 77(2):257–286.
Rusch, M. L., M. C. S. Jr., P. Gavin, J. D. Lee, J. D. Dawson, S. Vecera, and M. Rizzo (2013). Directing driver atten-tion with augmented reality cues. Transportaatten-tion Research Part F: Traffic Psychology and Behaviour, 16(0):127 – 137.
Schall Jr, M. C., M. L. Rusch, and Lee (2013). Augmented reality cues and elderly driver hazard perception. Hu-man Factors: The Journal of the HuHu-man Factors and Er-gonomics Society, 55(3):643–658.
Ueno, H., M. Kaneda, and M. Tsukino (1994). Development of drowsiness detection system. In Vehicle Navigation and Information Systems Conference, 1994. Proceedings., 1994, Pp. 15–20.
Wesley, A., D. Shastri, and I. Pavlidis (2010). A novel method to monitor driver’s distractions. In CHI’10 Ex-tended Abstracts on Human Factors in Computing Sys-tems, Pp. 4273–4278. ACM.
WHO (2013). World health organization, 2013. global status report on road safety supporting a decade of action. Yeh, M. and C. D. Wickens (2001). Display signaling in
aug-mented reality: Effects of cue reliability and image realism on attention allocation and trust calibration. Human Fac-tors: The Journal of the Human Factors and Ergonomics Society, 43(3):355–365.
About the Authors
Vincent Frémont, PhD (Automatic Control, Ecole Cen-trale de Nantes, France, 2003) is a Full Professor of Ecole Centrale de Nantes (France) and member of the LS2N Lab. (UMR CNRS 6004). His research interests belong to percep-tion systems for autonomous mobile robotics with an
empha-sis on computer vision, machine learning and multi-sensor fusion.
Minh-Tien Phan, PhD (Information and Computer Sci-ence, University de Technologie de Compiègne, France, 2016) is a Research Engineer at University de Technologie de Compiègne. His research interests belong to Augmented driving for intelligent vehicles and Human Factors study.
Indira Thouvenin, PhD (Biophysics, University Pierre and Marie Curie, Paris, France, 1989) is Professor at the CNRS Heudiasyc UMR 7253 Lab. at University de Tech-nologie de Compiègne, France. Her research interests belong to Immersion and interaction in virtual environ-ments, Augmented driving for intelligent vehicles and At-tention/inattention estimation.