OATAO is an open access repository that collects the work of Toulouse
researchers and makes it freely available over the web where possible
Any correspondence concerning this service should be sent
to the repository administrator:
[email protected]
This is an author’s version published in:
http://oatao.univ-toulouse.fr/24208
To cite this version:
Duterme, Amandine and Montuir, Marc and Dinh, Binh and Bisson, Julia and
Vigier, Nicolas and Floquet, Pascal
and Joulia, Xavier
New Methodology for
Bias Identification and Estimation – Application to Nuclear Fuel Recycling Process.
(2019) Computer Aided Chemical Engineering, 46. 1363-1368. ISSN 1570-7946
New Methodology for Bias Identification and
Estimation – Application to Nuclear Fuel Recycling
Process
Amandine Duterme
a*, Marc Montuir
a, Binh Dinh
a, Julia Bisson
b,
Nicolas
Vigier
c, Pascal Floquet
d, Xavier Joulia
daCEA Marcoule, Nuclear Energy Division, Research Department on Processes for Mining and Fuel Recycling, 30207 Bagnols-sur-Cèze, France
bORANO, La Hague Plant, Technical Department, 50444 Beaumont-Hague, France cORANO, La Défense, Technical Department – R&D, 92400 Courbevoie, France dLaboratoire de Génie Chimique, Université de Toulouse, CNRS, INP, UPS, Toulouse, France
Abstract
This paper focuses on the data reconciliation technique (DR) in case of numerous biases. DR improves the degree of confidence in available information and generates consistent data. The inventory and analysis of the plant data (position and type of sensors …) enable an evaluation of the process redundancy. Classical Gross Error Detection and Identification (GEDI) techniques delete the biased variables, decreasing the redundancy. This leads to information loss and possibly an inability to apply DR. The methodology proposed here combines DR, based on a reduced model, and rigorous simulations to locate and estimate multiple biases and to make data consistent in case of inter-connected flows. This methodology is applied to the nuclear fuel recycling process within the scope of a state estimation tool built on a process simulation code.
Keywords: simulation, nuclear fuel treatment, data reconciliation, bias estimation.
1.
Introduction
A measurement intrinsically possess uncertainty that prevents straightforward closure of mass and energy balances. In the data reconciliation (DR) methodology, accuracy is given to the measurements by exploiting redundancies in process data and physical constraints, from steady-state mass balances (Simpson et al., 1991) to nonlinear dynamic constraints (Liebman et al., 1992).
There are two main approaches to dealing with gross errors that impact DR. The first uses Gross Error Detection and Identification (GEDI) methods (Narasimhan and Jordache, 2000) and sequentially deletes the biased variables from the DR. The redundancy, which implies the ability of DR to correct the measurements in order to satisfy the process constraints, is reduced. However, performances of DR and GEDI are still limited in disrupted cases, such as multiple flows between two units, numerous gross errors, and the position and magnitude of gross errors (Corderio do Valle et al. 2018). The second
approach, not discussed in this study, modifies the objective function of DR to mitigate the effect of gross errors (Fuente, M.J. et al. 2015).
A new methodology for a nonlinear system is proposed here, combining the DR approach, based on a simplified model, and simulations, based on a first-principle model. It prevents the removal of the biased variables from the measurement set. The bias estimation is performed by the rigorous model, which enables the maximum redundancy to be kept. With a set of consistent input data generated by DR, the simulation can precisely estimate key indicators.
2. Methodology
Graph theory can be used to classify data in order to distinguish observable (measured or calculable) data from non-observable data. Among observable data, three categories can be defined: redundant data (deleting this measurement does not change the system observability), non-redundant and measured data, non-measured data. The redundant data are reconciled.
The n measurement vector XB is linked to the true value of the measured variables XT, the
random error εB (assumed to be independent, with a zero mean and normally distributed),
and the gross error B, here, the bias, by the following equation:
B T B
X
X
B
(1)Data reconciliation consists of minimizing an objective function constrained by a set of constraints f: 1 ,
((
)
)
((
)
)
. . (
, )
0
R B R T B R X B RMin X
B
X
V
X
B
X
s t f X
(2)where XR is the n reconciled values vector, V the (n,n) covariance matrix of the measured
data, and θ the parameters of the system. XR are the best estimates of process variables, in
the sense of the maximum likelihood. A study of the redundant variables, depending on the process topology and the number of independent equations, enables the determination of the ability of the DR to calculate a consistent set of reconciled data.
A global approach is to solve the DR with the rigorous model as constraints and simultaneously estimates the reconciled values XR and the biases B. In most industrial
applications, the entire first-principle model of the process, named rigorous model thereafter, cannot be directly used as the constraints f for the DR. This is generally due to implementation difficulties, such as code interfaces, and complex numerical estimation of the gradient of the constraints. The methodology proposed performs bias estimation outside the DR by an iterative strategy. It divides the problem into two sub problems: the rigorous model estimates the biases while the DR solves Eq. (2), in regards of XR only,
with a reduced model as constraints. This simplified model is made up of a selection of linear and nonlinear equations specially chosen in order to exploit all information available from the measurements. In particular, it contains the total mass balance and, depending on the case study, some partial mass balances and equations for the calculation of physical properties and fluid phase equilibria.
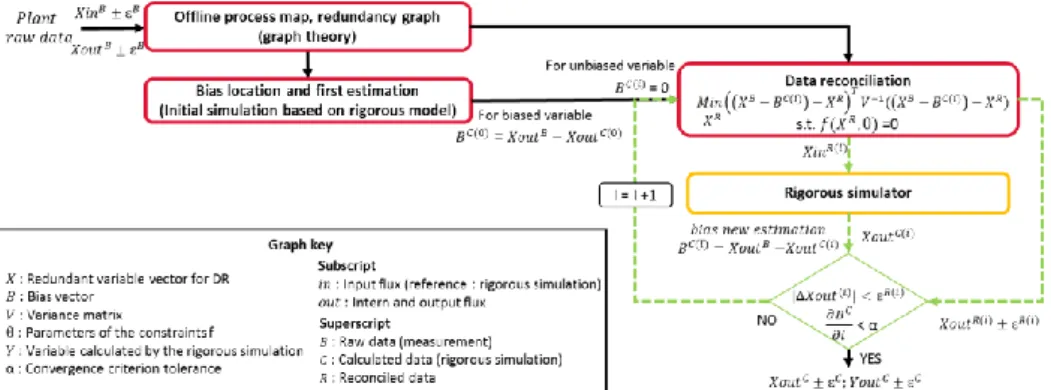
Figure 1 displays the new methodology. First, a map of the process (list of fluxes, units, sensors, uncertainties etc.) is built offline to generate the redundancy graph. The second
step makes use of process expertise to identify bias locations, concerning measurements on internal or output fluxes. An initial simulation, based on the rigorous model, with input fluxes raw measurements XinB as input data, gives a first estimation for the biases BC(0).
As regards the vector of the calculated bias BC, each element is null except for the
identified biased output variables. These elements are equal to the difference between the biased measurements XoutB and the rigorous simulation calculated outputs XoutC.
The DR is then solved iteratively with respect to XR only, the values of biases BC(i) being
considered fixed. Therefore, the process redundancy is unreduced by biases. To solve the nonlinear steady-state DR problem, this study uses the Fmincon function of Scilab software. The uncertainty for reconciled values is estimated at each DR solution by uncertainty propagation (Narasimhan and Jordache, 2000).
Figure 1: Bias identification and estimation methodology
At iteration i, the reconciled values of the input fluxes XinR(i) are transferred to the rigorous
simulator. The reconciled and calculated output flow information, XoutR(i) and XoutC(i)
respectively, are compared. If the difference |XoutC-R(i)| between them is smaller than the
uncertainties of reconciled data, the DR gives consistent values for rigorous model equations in the case of Lipschitz continuity around the solution. New bias values BC(i)
are estimated with the last rigorous calculation. The best estimation of the bias values is reached when the biases between two iterations are constant. If these two criteria are not respected, bias information given to the DR is not satisfactory. The new bias values BC(i)
are given to the DR for the next step. The iterations continue until the bias value estimation enables consistent data to be reached. The final DR is performed with fully known bias information, and has a minimal objective function value.
3. Case study
The methodology proposed in this paper is applied to the PUREX process and uses the PAREX simulation code developed and validated by the CEA (Dinh et al., 2008). This process carries out the treatment of spent nuclear fuel. Spent fuel contains the elements of interest, uranium and plutonium, and the waste, i.e. fission products. TBP (tributyl-phosphate) is the extractive molecule used to recover and purify uranium and plutonium through interconnected liquid-liquid extraction steps. For the final products, very specific features in terms of purity as well as extraction efficiency are required. In order to reach the necessary high performances, the metal loading of the solvent (metal mass flowrate in the solvent for a specific TBP mass flowrate) must be precisely controlled. This ratio is a sensitive parameter which deeply impacts the process state (Bisson et al., 2016). Therefore, DR aims to reduce uncertainty on this key process indicator by giving reliable
input data to the rigorous simulator PAREX. It is based on first-principle models notably taking into account the partitioning of the species, the transfer, and chemical kinetics. This study deals with an extraction-stripping step of the PUREX process where many sensors are implemented, and can be separated into two categories. Major consideration is given to a specific set of sensors essential for operation, control, and to respect the safety regulations (multiple sensors, regular checking, preventive maintenance, etc.). They are listed as reference information for the industrial plant. The secondary sensors are not used for process control or for industrial safety. They give additional information, increasing redundancy, which can help process state estimation. Some of this additional data can have biases non-detectable with previously-acquired data. A scenario is defined in order to encounter identified causes of GEDI performance loss (Corderio do Valle et al., 2018): the biases concern flows connecting the same two units, and their suppression leads to the system being non-redundant.
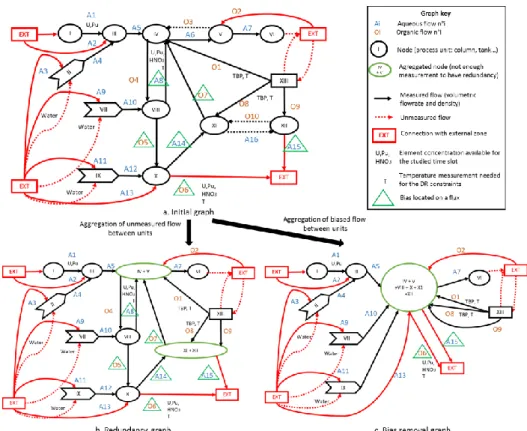
The initial graph of the PUREX process (Figure 2a) contains information about flows (directed arcs) and units (nodes). The redundancy graph (Figure 2b) is free of internal non-measured physical quantities: arcs depict constraints linking measurements of interest from one unit to the other. The measured variables used in the DR problem are volumetric flowrates, densities for each arc, temperature, and uranium, plutonium, nitric acid and TBP composition for specific arcs. The six identified biases are all located on internal and output flowrates measured by secondary sensors.
For the classical GEDI methodology, each time a bias is detected, the redundancy decreases (Narasimhan and Jordache, 2000). The bias removal graph (Figure 2c) shows this loss of redundancy: DR cannot be applied on the aggregated node (IV+V+VIII+X+XI+XII), as only the calculation of the biases on output flowrates is possible in this scenario. In addition, classical GEDI techniques cannot locate a bias within two-way arcs between two units, such as between IV and VIII.
4. Results
The first bias estimation BC(0) was obtained by the comparison between measured internal
and output flow-rates and the initial PAREX calculation. Four iterations were needed to obtain consistent bias estimations BC and the minimum of the objective function. As soon
as all biases can be considered constant, the iterations stop (|BC(4)
-
BC(3)|< α, with α = 10- 4the tolerance of the convergence criterion). Note that the bias values are considerably higher than the measurement uncertainty in this scenario; therefore their contribution must be isolated.
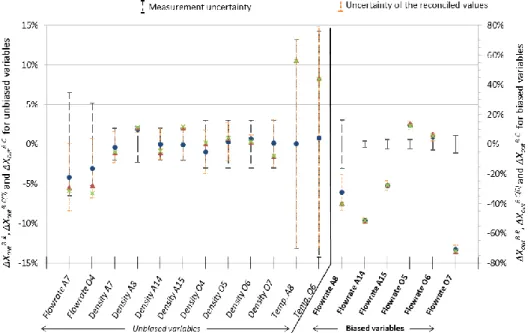
All redundant data (80 variables), biased and unbiased, are reconciled. Figure 3 displays the differences ΔXoutB-R between some of the measured XoutB and reconciled XoutR values
and their corresponding uncertainties. The differences ΔXoutB-C(0) and ΔXoutB-C between the
measured XoutB and, respectively, initial XoutC(0) and final XoutC PAREX values, are also
laid out.
The differences ΔXoutB-C(0) result from input measurement uncertainty. For flowrate A7,
flowrate O4, and density A8, the reconciled values are closer to the PAREX calculations than the measured values, highlighting the consistency of the final data set. Moreover, the uncertainty of the reconciled values is smaller than the measurement uncertainty.
Concerning density A8 and density O6, the uncertainties of the reconciled values are very small and surround the reconciled and calculated values. These densities are linked to uranium and plutonium concentrations through a density equation. The analytical concentration measurement methods are more precise than the density sensors. Thus, the uncertainty propagation through the constraints enables the XoutR to be more precise.
Concerning the other unbiased variables, mostly linked by mass balances, the reconciled
XoutR values are only slightly different from the measured XoutB values. The two PAREX
simulations give very similar results. This reflects the low sensitivity of these physical quantities to the change in the inputs from measured to reconciled values.
As PAREX input data are reconciled, accuracy is given to process indicators estimation. For instance, the uncertainty of the TBP mass flowrate is reduced by half (measurement uncertainty: 5.26 %, uncertainty of the reconciled value: 2.81 %). The uncertainties of uranium and plutonium mass flowrates are also reduced (from 2.8 % to 2.0 %), which leads to a better estimation of the metal loading in the solvent.
5. Conclusions
In classical GEDI methods, each bias decreases the redundancy of the system. The new methodology is based on nonlinear DR in which the biases are fixed and estimated by a rigorous model, with the reconciled values as input data. Therefore, the redundancy is not modified. For the bias estimation to be precise, the rigorous code and the DR iterate until the bias values offer a consistent set of reconciled data. This methodology enables explicit and inexplicit constraints for a DR problem to be addressed.
The proposed methodology was applied with success to a spent nuclear fuel treatment process. As a tool to reduce uncertainty in nuclear matter management within the plant, combining data reconciliation and the PAREX code could help in process monitoring and control.
References
J. Bisson, B. Dinh, P. Huron, C. Huel, 2016, PAREX, a numerical code in the service of La Hague plant operations, Procedia Chemistry, 32, 117-124.
E. Corderio do Valle, R. De Araùjo Kalid, A. Resende Secchi, A. Kiperstok, 2018, Collection of benchmark test problems for data reconciliation and gross error detection and idetnficaition, Computers and Chemical Engineering, 111, 134-148.
B. Dinh, P. Baron, J. Duhamet, 2008, Treatment and recycling of spent nuclear fuel, monograph of CEA DEN, the PUREX process separation and purification operations, 55-70.
M. Fuente, G. Gutierrez, E. Gomez, D. Sarabia, C. de Prada, 2015, Gross error management in data reconciliation, IFAC-PapersOnLine, 48, Issue 8, 623-628.
M. Liebman, T. Edgar, L. Lasdon, 1992, Efficient data reconciliation and estimation for dynamic processes using nonlinear programming techniques, Computers & chemical engineering, 16, 963-986.
S. Narasimhan, C. Jordache, 2000, Data reconciliation and gross error detection: an intelligent use of process data, Gulf Publishing Co.
C. Pantelides, J. Renfro, 2013, The online use of first-principles models in process operations: review, current status and future needs, Computers & chemical engineering, 51, 136-148. D. Simpson, V. Voller, M. Everett, 1991, An efficient algorithm for mineral processing data adjustment, International Journal of Mineral Processing, 31, 73-96.