Naphthenic acids in groundwater overlying undeveloped shale gas and tight oil reservoirs
Jason M.E. Ahad, Hooshang Pakdel, Denis Lavoie, René Lefebvre, Kerry M. Peru, John V. Headley
PII: S0045-6535(17)31587-4
DOI: 10.1016/j.chemosphere.2017.10.015 Reference: CHEM 20037
To appear in: ECSN
Received Date: 14 June 2017 Revised Date: 26 September 2017 Accepted Date: 2 October 2017
Please cite this article as: Ahad, J.M.E., Pakdel, H., Lavoie, D., Lefebvre, René., Peru, K.M., Headley, J.V., Naphthenic acids in groundwater overlying undeveloped shale gas and tight oil reservoirs,
Chemosphere (2017), doi: 10.1016/j.chemosphere.2017.10.015.
This is a PDF file of an unedited manuscript that has been accepted for publication. As a service to our customers we are providing this early version of the manuscript. The manuscript will undergo copyediting, typesetting, and review of the resulting proof before it is published in its final form. Please note that during the production process errors may be discovered which could affect the content, and all legal disclaimers that apply to the journal pertain.
M
AN
US
CR
IP
T
AC
CE
PT
ED
1Naphthenic acids in groundwater overlying undeveloped shale gas
1
and tight oil reservoirs
2
3
Jason M. E. Ahad1*, Hooshang Pakdel2, Denis Lavoie1, René Lefebvre2, Kerry M. Peru3, John 4 V. Headley3 5 6 7 1
Geological Survey of Canada, Natural Resources Canada, Québec, QC, G1K 9A9, Canada, 8
*corresponding author: [email protected], Tel: 1-418-654-3721 9
2
INRS, Centre Eau Terre Environnement, Québec, QC, G1K 9A9, Canada 10
3
Water Science and Technology Directorate, Environment and Climate Change Canada, 11 Saskatoon, SK, S7N 3H5, Canada 12 13 14 15 16 Resubmitted to Chemosphere 17 26 September 2017 18
M
AN
US
CR
IP
T
AC
CE
PT
ED
2 Abstract 19The acid extractable organics (AEOs) containing naphthenic acids (NAs) in groundwater 20
overlying undeveloped shale gas (Saint-Édouard region) and tight oil (Haldimand sector, Gaspé) 21
reservoirs in Québec, Canada, were analysed using high resolution Orbitrap mass spectrometry 22
and thermal conversion/elemental analysis – isotope ratio mass spectrometry. As classically 23
defined by CnH2n+ZO2, the most abundant NAs detected in the majority of groundwater samples
24
were straight-chain (Z = 0) or monounsaturated (Z = -2) C16 and C18 fatty acids. Several
25
groundwater samples from both study areas, however, contained significant proportions of 26
presumably alicyclic bicyclic NAs (i.e., Z = -4) in the C10-C18 range. These compounds may
27
have originated from migrated waters containing a different distribution of NAs, or are the 28
product of in situ microbial alteration of shale organic matter and petroleum. In most 29
groundwater samples, intramolecular carbon isotope values generated by pyrolysis (δ13Cpyr) of
30
AEOs were on average around 2-3‰ heavier than those generated by bulk combustion (δ13C) of 31
AEOs, providing further support for microbial reworking of subsurface organic carbon. 32
Although concentrations of AEOs were very low (< 2.0 mg/L), the detection of potentially toxic 33
bicyclic acids in groundwater overlying unconventional hydrocarbon reservoirs points to a 34
natural background source of organic contaminants prior to any large-scale commercial 35
hydrocarbon development. 36
37
Keywords: Acid extractable organics; Orbitrap; Carbon isotopes; Unconventional hydrocarbons; 38
Bicyclic acids; Principal Components Analysis 39
M
AN
US
CR
IP
T
AC
CE
PT
ED
3 41 Highlights: 42• NAs were found in groundwater overlying undeveloped shale gas and tight oil plays. 43
• Most abundant NAs were straight-chain or monounsaturated C16 and C18 fatty acids.
44
• Alicyclic bicyclic NAs (Z = -4) were detected in several groundwater samples. 45
• Natural background source of organic contaminants prior to hydrocarbon extraction. 46
47
1. Introduction 48
Naphthenic acids (NAs) are a complex mixture of alkyl-substituted acyclic and 49
cycloaliphatic carboxylic acids described by the general chemical formula CnH2n+ZO2, where n
50
indicates the carbon number and Z is zero or a negative, even integer that specifies the hydrogen 51
deficiency resulting from ring formation (Clemente and Fedorak, 2005). Found naturally in crude 52
oil deposits, NAs are toxic to a wide range of aquatic organisms including microalgae (Debenest 53
et al., 2012), fish (Marentette et al., 2015; Scarlett et al., 2013), and amphibians (Melvin and 54
Trudeau, 2012), and also pose a problem during oil refining due to their corrosivity (Jayaraman 55
et al., 1986; Laredo et al., 2004; Tomczyk et al., 2001). Due to their high abundance in bitumen, 56
most recent research into the environmental behaviour and fate of NAs has been focused on 57
northern Alberta’s Athabasca oil sands region, where the alkaline water hot extraction process 58
used in surface mining concentrates these compounds in oil sands process-affected water 59
(OSPW). Potential seepage of the large volumes of OSPW stored in tailings ponds (Ahad et al., 60
2013; Frank et al., 2014; Oiffer et al., 2009; Ross et al., 2012; Savard et al., 2012) poses a risk to 61
M
AN
US
CR
IP
T
AC
CE
PT
ED
4 local ecosystems and is one of the main environmental concerns associated with oil sands mining 62operations. 63
Spurred on by the need to better understand this complex group of emerging 64
contaminants (Headley et al., 2013), the past decade has seen significant advances in the 65
characterization, identification and quantification of NAs in environment samples. High and 66
ultrahigh resolution mass spectrometry (MS) analysis carried out using Orbitrap MS and Fourier 67
Transform Ion Cyclotron Resonance (FTICR) MS has demonstrated that the acid extractable 68
organics (AEOs) fraction of most samples from the oil sands region contain not just the 69
classically defined NAs as described previously, but other compounds which incorporate 70
nitrogen and/or sulfur atoms, and have various levels of unsaturation and aromaticity (see 71
Headley et al., 2016, and references therein). Other work carried out using multidimensional 72
comprehensive gas chromatography mass spectrometry (GC × GC-MS) has identified individual 73
compounds in OSPW such as adamantane diamondoid acids (Rowland et al., 2011a), 74
monoaromatic C-ring steroidal acids (Rowland et al., 2011b) and bicyclic aromatic acids 75
(Bowman et al., 2014; West et al., 2014). 76
Microbial degradation of petroleum hydrocarbons generates carboxylic acids (Atlas, 77
1981; Barth et al., 2004; Meredith et al., 2000; Thorn and Aiken, 1998; Watson et al., 2002); 78
consequently, highly biodegraded, viscous crude oil deposits such as Athabasca oil sands 79
bitumen generally contain a significant component of AEOs. Other organic-rich sediments such 80
as coal and shale, however, may also contain NAs. Straight-chain fatty acids, which fall within 81
the definition of NAs described by CnH2n+ZO2 (i.e., Z = 0), were detected in supercritical gas and
82
solvent extracts of lignite and sub-bituminous coals (Snape et al., 1981). Using FTICR-MS, Scott 83
et al. (2009) detected a range of NAs in distilled water leachates percolated through crush 84
M
AN
US
CR
IP
T
AC
CE
PT
ED
5 samples of lignite and sub-bituminous coal. In shale from the Green River formation in the 85western USA, normal (CnH2nO2) and isoprenoid (CnH2n-2O4) acids were found to be the major
86
extractable acidic constituents (Eglinton et al., 1966; Haug et al., 1971). Naphthyl-carboxylic 87
acids and cycloaromatic acids were also partly identified Haug et al. (1971). Exploiting the much 88
higher resolution afforded by FTICR-MS, Salmon et al. (2011) reported a series of polar CHO, 89
CHOS and CHON compounds between C12 and C50+ in Green River shale. The major series
90
(CHO) confirmed the abundance of normal and isoprenoid acids found in earlier studies, whereas 91
the CHOS and CHON series contained sulfoxide groups and nitrile-type compounds. FTICR-MS 92
analysis has also revealed a wide array of nitrogen-containing compounds in Chinese and 93
Russian shale oils (Bae et al., 2010; Chen et al., 2012; Tong et al., 2013). 94
Although the geochemical properties of bitumen and the processes involved with its 95
extraction can account for the environmental significance of AEOs in the Athabasca oil sands 96
region, as outlined above, the development of unconventional fossil fuels may also release 97
potentially harmful NAs into the subsurface. Recent work has reported a wide range of organic 98
compounds in hydraulic fracturing fluids, produced waters and formation waters from 99
unconventional natural gas extraction throughout the USA (Drollette et al., 2015; Hoelzer et al., 100
2016; Orem et al., 2014; Stringfellow et al., 2017). The organic compounds detected in produced 101
waters included straight-chain fatty acids (e.g., C12, C14 and C16) thought mainly to be the
102
biodegradation products of geopolymeric substances present in the shale (Hoelzer et al., 2016; 103
Orem et al., 2014; Orem et al., 2010). Despite the potential for naturally-occurring NAs in shale 104
to be released into produced waters during unconventional hydrocarbon extraction, to the best of 105
our knowledge, no attempt to characterize these waters specifically for these compounds has 106
been reported in the literature. 107
M
AN
US
CR
IP
T
AC
CE
PT
ED
6 In this study, AEOs in groundwater overlying undeveloped shale gas (Saint-Édouard) and 108tight oil (Haldimand sector, Gaspé) reservoirs located in the province of Québec, Canada, were 109
analysed using high resolution Orbitrap MS and thermal conversion/elemental analysis – isotope 110
ratio mass spectrometry (TC/EA-IRMS). The intramolecular carbon isotope ratios generated by 111
online pyrolysis (δ13Cpyr) using TC/EA-IRMS were previously used to distinguish
bitumen-112
derived sources of AEOs in the Athabasca oil sands region (Ahad et al., 2013; Ahad et al., 2012). 113
AEOs extracted from unprocessed oil and naturally-occurring oil seeps from the Haldimand 114
sector and crushed samples of Upper Ordovician shales from the Saint-Édouard region were also 115
characterized. The main objectives of this study were to 1) confirm the presence of NAs (as 116
defined by the O2 species class in AEOs) in groundwaters from these generally pristine aquifers,
117
2) carry out a Principal Components Analysis (PCA) using all samples’ species data to compare 118
AEO distributions in groundwater with those from potential NA sources, and 3) evaluate the 119
potential of δ13Cpyr values to discriminate sources of AEOs in unconventional hydrocarbon
120
deposits from other locations than Canada’s oil sands region. We have opted to use the classical 121
definition of NAs (CnH2n+ZO2) since much of the paper focuses on the O2 species. The term
122
AEOs is used when discussing the S and N heteratomics and aromatic components in these 123
samples. 124
125
2. Materials and methods 126
2.1. Study sites and samples
127
The Haldimand sector, Gaspé, Québec, Canada (Figure 1), contains a tight sandstone 128
petroleum reservoir (York River and Battery Point formations, Middle Devonian) underlying a 129
M
AN
US
CR
IP
T
AC
CE
PT
ED
7 shallow fractured rock aquifer system (Raynauld et al., 2014; Raynauld et al., 2016). The drilling 130of a horizontal exploration well was halted in December 2012 by a municipal regulation aimed at 131
protecting the local groundwater, although several vertical exploration wells had been previously 132
drilled in the region. One unprocessed oil (Haldimand oil) and two naturally-occurring seep 133
samples (POT2 and S1) from the Haldimand sector were collected during autumn 2012, and 134
groundwater samples (12 L) from three observation wells (PH-02, POH-11-10 and POH-11-14) 135
and one municipal well (SJ/PE-02) were collected during summer 2013. Oil and seep samples 136
were collected using pre-combusted (450 oC for hours) amber glass jars with 137
polytetrafluoroethylene (PTFE)-lined lids. Groundwater samples were collected using 138
fluorinated HDPE carboys. Further information on the geology and hydrogeology of the 139
Haldimand sector and sampling methodology and well locations can be found in (Raynauld et 140
al., 2014) . 141
The Saint-Édouard region (southern Québec, Canada; Figure 1) contains at depth (> 2 142
km) units of the Upper Ordovician Utica Shale, which has been considered as an excellent source 143
rock for conventional hydrocarbon exploration and was recently evaluated for its unconventional 144
reservoir potential (Chatellier et al., 2013; Lavoie et al., 2014; Rivard et al., 2014). Recent 145
interest in the area has focused on potential risks to local aquifers due to potential future shale 146
gas development (Lavoie et al., 2014; Bordeleau et al., 2015; Lavoie et al., 2016) and recent 147
research results have documented the presence of sub-cropping hydrocarbon-loaded Utica-148
equivalent or younger Late Ordovician shales (Lavoie et al., 2016). However, as with the 149
Haldimand sector of Gaspé, the current government of Québec moratorium on fracking has thus 150
far prevented further exploration and the assessment of the commercial shale gas production 151
potential. Groundwater from observations wells examined here were obtained from wells drilled 152
M
AN
US
CR
IP
T
AC
CE
PT
ED
8 in the shallow fractured rock aquifer (< 60 m depth) in the Lotbinière (F1), Les Fonds (F2 and 153F4) and Nicolet formations (F3, F5, F7 and F8) in 2013, 2014 and 2015 (Lavoie et al., 2016). 154
Two shale samples were collected from the Nicolet (F7 and F8), one from the Lotbinière (F20) 155
and one from the Les Fonds formations (F21) wells. Since drilling mud was not used to collect 156
these cores, the drilling process is not expected to have introduced a significant amount of 157
hydrocarbon contamination into the wells. Core samples were wiped down with 70% ethanol 158
after collection, wrapped in pre-combusted (450 oC for 4 hours) aluminum foil and stored in the 159
freezer at -20 oC until analysis. The Lotbinière and Les Fonds formations have significantly 160
higher total organic carbon (TOC), hydrogen index (HI), genetic potential and transformation 161
ratios compared to the Nicolet formation (Lavoie et al., 2016). Groundwater samples (12 L) from 162
observation wells and local residential wells (INRS 447, Zone 10R, Zone 11S, Zone 12R, Zone 163
2S, Zone 5R and Zone 9R) were collected during 2013, 2014 and 2015 using fluorinated HDPE 164
carboys. Further information on the geology and hydrogeology of the Saint-Édouard area and 165
sampling methodology and well locations can be found in Lavoie et al. (2014), Lavoie et al. 166
(2016) and Bordeleau et al. (accepted). 167
2.2. Extraction of acid extractable organics (AEOs)
168
Prior to crushing, shale cores were split into approximately 1 cm thick “disks” using a 169
stainless steel hammer and chisel rinsed with methanol, dichloromethane (DCM) and hexane. 170
Around 1 cm from the edges of the disks were chipped off and discarded. Samples F7 and F8 171
were homogenised using a metallic mortar and pestle, whereas samples F20 and F21 were 172
homogenised using a SPEX SamplePrep (Metuchen, NJ) 8500 Shatterbox grinding mill. The 173
stainless steel grinding container and puck were cleaned with solvents between samples. 174
M
AN
US
CR
IP
T
AC
CE
PT
ED
9 The AEOs containing NAs in groundwater, seep, oil and crushed shale samples were 175extracted following protocols similar to those described by Ahad et al. (2012). For aqueous 176
samples, approximately 0.5 L (seeps) and 12 L (groundwater) was acidified to pH 4.5 and 177
extracted using loose Strata-X-A solid phase extraction sorbent (Phenomenex, Torrance, CA, 178
USA). Crushed shale samples (~ 140 to 1000 g) were extracted in a soxhlet apparatus using a 179
mixture of 9:1 DCM to methanol. Following a subsequent re-dissolution in about 30 mL alkaline 180
solution, AEOs in shale were extracted in the same manner as aqueous samples. The Haldimand 181
oil sample (~ 200 g) with relatively high volatile hydrocarbon content was evaporated in a rotary 182
evaporator for 10 min at 40 oC to remove volatile hydrocarbons and then dissolved in 300 mL of 183
cold hexane while stirring. Asphaltene, the hexane insoluble fraction, was filtered off to recover 184
the maltene fraction. The extraction was repeated twice to remove most of the asphaltenes. The 185
maltene fraction was then dissolved in 100 mL hexane and extracted with 4 × 100 mL 1N NaOH 186
in water. The aqueous phase was further extracted with 2 × 100 mL hexane. The hexane fraction 187
was discarded. The aqueous fraction containing AEOs was acidified to pH 2 and extracted with 188
10% methanol in DCM (5 × 100 mL). Process blanks were carried out using 12 L of Mill-Q 189
water for aqueous samples and an equal amount of solvents as used for extraction of oil and 190
crushed shale samples. 191
2.3. High-resolution mass spectrometry (MS)
192
Qualitative and semi-quantitative analysis of subsamples of AEOs were completed at 193
Environment and Climate Change Canada (Saskatoon, SK, Canada) by 5 µL loop injection (flow 194
injection analysis) using a Surveyor MS pump (Thermo Fisher Scientific Inc.) and a mobile 195
phase of 50:50 acetonitrile/water containing 0.1% NH4OH. Mass spectrometry analysis was
196
carried out using a dual pressure linear ion trap−orbitrap mass spectrometer (LTQ Orbitrap Elite, 197
M
AN
US
CR
IP
T
AC
CE
PT
ED
10 Thermo Fisher Scientific, Bremen, Germany) equipped with an ESI interface operated in 198negative ion mode. Data was acquired in full scan mode from m/z 100 to 600 at a setting of 199
240,000 resolution. The majority of ions were singly charged, and the average mass resolving 200
power (m/∆m50%) was 242,000 at m/z 400. Mass accuracies of less than 1 ppm were obtained 201
using a lock mass compound (n-butyl benzenesulfonamide) for scan-to-scan mass calibration 202
correction. Concentrations of AEOs were determined using a five point external standard 203
calibration of Athabasca oil sands OSPW-derived AEOs at known concentrations as described 204
elsewhere (Frank et al., 2014; Hughes et al., 2017). 205
2.4. Intramolecular and “bulk” stable carbon isotope (δ13C) analysis
206
The carbon isotope ratio of the CO2 generated by the pyrolytic decarboxylation of AEOs
207
(δ13Cpyr) was determined by TC/EA-IRMS (Delta+ XL, Thermo-Finnigan) at the Delta-Lab of
208
the Geological Survey of Canada (Québec, QC, Canada). Full details of the protocol for these 209
analyses are found in Ahad et al. (2012). As no significant variability in intramolecular carbon 210
isotope values was observed across the entire molecular weight range of AEOs (Ahad et al., 211
2012), here we report δ13Cpyr values from samples not separated into different mass fractions.
212
The “bulk” or non-intramolecular carbon isotope ratios of AEOs generated by combustion were 213
analyzed by EA-IRMS using a Costech EA (Valencia, CA, USA) interfaced with the Delta+ XL 214
IRMS system. Based on replicate standard and sample analyses, the uncertainty for δ13Cpyr and
215
bulk δ13C analyses was ±0.6 and ±0.3‰, respectively. 216
217
3. Results and Discussion 218
3.1 Distributions of AEOs
M
AN
US
CR
IP
T
AC
CE
PT
ED
11 At 0.01% by weight of petroleum, the amount of AEOs in Haldimand oil was around 10 220times lower than that determined in Athabasca oil sands bitumen (Ahad et al., 2012). The amount 221
of blank-corrected AEOs in the two shales from the Lotbinière (F20; 0.51 µg/g dry weight) and 222
the Les Fonds (F21: 0.49 µg/g dry weight) formations were greater than the Nicolet formation 223
shales (F7 and F8; 0.19 and 0.27 µg/g dry weight). While this discrepancy may be largely 224
attributed to the higher TOC and hydrogen index values in the F20 and F21 cores (Lavoie et al., 225
2016), the more robust homogenization technique used to prepare these two samples (i.e., 226
electric mill versus manual grinding) may have also contributed to this difference. 227
The concentrations of total AEOs in all groundwater samples were low, ranging from 0.1 228
to 1.0 mg/L in the Haldimand sector and from 0.1 to 1.9 mg/L in the Saint-Édouard region 229
(Supplementary data, Table S1). The concentrations of total AEOs in seeps from the Haldimand 230
sector were slightly higher at 2.1 and 4.0 mg/L for samples POT2 and S1, respectively. The low 231
levels of AEOs in groundwater observed here were similar to those found in background surface 232
water and groundwaters in the Athabasca oil sands region not significantly impacted by bitumen, 233
whether mining-related or naturally occurring (Ahad et al., 2013; Frank et al., 2014; Ross et al., 234
2012). 235
Naphthenic acids, as classically defined by CnH2n+ZO2, were detected in all the samples
236
analysed here. As a percentage of the total AEOs, the O2 species class (Table S1) was highest in
237
oil (39.4%), seep (16.7 to 59.4%) and shale samples (34.1 to 73.8%) compared to groundwater 238
samples from both Saint-Édouard (3.7 to 12.3% and 0.5 to 9.7% in observation and residential 239
wells, respectively) and Gaspé regions (0.7 to 4.8%). The most common compounds found 240
within the O2 species class in shale and the majority of groundwater samples were straight-chain
241
(Z = 0) or monounsaturated (Z = -2) C16 and C18 fatty acids (Table 1). These ubiquitous
M
AN
US
CR
IP
T
AC
CE
PT
ED
12 compounds are two of the most abundant biologically-produced lipids and thus typically 243comprise a main component of naturally-occurring “background” AEOs (Headley et al., 2011; 244
Ross et al., 2012). Process blanks were also dominated by straight-chain C16 and C18 fatty acids
245
(Figure S1), however, since the blank comprised < 1% of the total AEO mass in oil, seep and 246
groundwater samples, it is considered a negligible component in these samples’ profiles. In 247
contrast, the concentrations of AEOs in shale process blanks were between 6 to 20% of the total 248
AEO masses. The higher shale process blank is attributed to trace fatty acid contamination in the 249
DCM used during extraction. 250
The distributions of NAs as a function of carbon number, Z value and percentage of the 251
total O2 species class are plotted in Figure 2 for four representative samples from each of the
252
Gaspé and Saint-Édouard regions. Due to their predominantly high levels in many of the 253
samples, Z = 0 (all) and Z = -2 (C16 and C18 ) fatty acids were excluded from most of the profiles
254
to better illustrate the distribution patterns of less abundant NAs, in a manner similar to that 255
carried out in another study examining natural background levels NAs (Ross et al., 2012). The 256
two exceptions are the oil and seep samples from the Haldimand sector, for which the 257
distributions of all NAs are presented on Figure 2. 258
Comprising almost half of the total O2 class, straight-chain NAs in the C8 to C20 range
259
centred on C12 dominated the Z series distribution in the Haldimand oil (Figure 2). Significant
260
abundances of NAs with Z = -2 (one cycloalkyl ring) and Z = -8, likewise centred on C12, were
261
also detected. The dominance of light molecular weight straight-chain or monocyclic NAs points 262
to a low degree of degradation in the Haldimand crude oil (Hughey et al., 2008; Kim et al., 263
2005). The representative seep sample (POT2) contains a higher component of Z = -2 to -12 264
NAs, and a slightly heavier distribution centred between C16 to C18. This shift in NA distribution
M
AN
US
CR
IP
T
AC
CE
PT
ED
13 is expected as crude oil undergoes degradation (Hughey et al., 2008; Kim et al., 2005) and thus 266points to natural weathering in the surface oil seep over time. 267
Regardless of geological unit, the distributions in all four Saint-Édouard region shale 268
samples were similar and dominated by C10 to C18 NAs ranging from Z= -2 to Z= -16 (Table 1
269
and Figure 2). The compounds included a suite of NAs with Z = -8 and -10 in the C8 to C16
270
range, which given the number of carbon atoms points to compounds containing aromatic rings 271
(Figure 2). Relatively smaller proportions of monocyclic NAs or monounsaturated fatty acids 272
(i.e., Z = -2) and presumably alicyclic bicyclic NAs (Z = -4) in the C11 to C18 range were also
273
detected (Figure 2). With the exception of a minor component of C8 to C10 Z = -8 NAs, none of
274
the compounds shown on Figure 2 were found in shale process blanks (Figures 2 and S1). 275
Bearing in mind the dominant C16 and C18 fatty acid peaks found in most samples, the NA
276
distributions in the majority of groundwaters (as represented by wells F7 and PH-02 on Figure 277
2), irrespective of regional origin (Saint-Édouard or Gaspé) or well type (observation, residential, 278
municipal), could in general be characterized as containing very low amounts of a narrow range 279
of NAs. The exceptions to this pattern were three wells from the Saint-Édouard region (F2, F4 280
and Zone 10R) and one from the Gaspé region (POH-11-14); all four of which contained 281
noticeably more significant levels of presumably alicyclic bicyclic (Z = -4) C10-C18 NAs (Figure
282
2). Interestingly, in the Saint-Édouard region, several of these wells (Zone 10R and F2) were 283
situated near fault zones (Bordeleau et al., accepted), suggesting the migration of waters 284
containing a distribution of NAs different from that extracted from the shale samples examined 285
here. Another possibility is that bicyclic acids were generated from in situ microbial alteration of 286
shale organic matter (Saint-Édouard) and petroleum (Gaspé), as was inferred for the POT2 seep 287
sample from the Haldimand region (Figure 2). For instance, Wilde et al. (2015) has suggested 288
M
AN
US
CR
IP
T
AC
CE
PT
ED
14 that the bicyclic acids identified in OSPW represent the biotransformation products of the 289initially somewhat more recalcitrant bicyclanes of petroleum. Synthetic bicyclic acids in the C11
290
to C13 range were found to be acutely toxic (Jones et al., 2011); thus the occurrence of similar
291
NAs in groundwater from the Saint-Édouard and Gaspé regions indicates a potential background 292
source of organic contaminants. 293
3.2 Principal Components Analysis (PCA)
294
Principal Components Analysis (PCA) was carried out on log-transformed (log(x+1)) 295
species percentages (Nx, NxSx, NxOx, NxOxSx, OxSx, O1 to O10 and Sx) in AEOs using SigmaPlot
296
13.0 (Systat Software Inc., San Jose, CA). The data was log-transformed to improve normality 297
and to avoid the inherent bias in compositional (i.e., closed) datasets consisting of proportions 298
that sum up to a constant such as 100% (Filzmoser et al., 2009). The PCA loadings (Figure 3a) 299
and scores (Figure 3b) for the first (PC1) and second (PC2) principal components accounted for 300
51.50 and 15.44% of the total explained variance, respectively. PC1 was strongly (r > 0.5) 301
positively correlated with Nx, NxSx, and O5 to O10, and strongly (r > 0.5) negatively correlated
302
with OxSx, O2 and O3. PC2 was strongly (r > 0.5) negatively correlated with NxOxSx, OxSx, O1,
303
O4 and Sx.
304
As illustrated on Figure 3b, the PCA scores plot revealed several distinct groupings for 305
the samples analysed as part of this study. The Haldimand oil, shale samples, shale process blank 306
and one of the groundwater process blanks were grouped closely together on the left side of the 307
plot and away from most of the other samples chiefly as a result of their greater component of O2
308
and O3 species (Figure 3a). Another groundwater process blank containing a high amount of
309
OxSx plotted in the lower left section of the graph away from any other samples. Groundwater
M
AN
US
CR
IP
T
AC
CE
PT
ED
15 samples plotted to the right as a reflection of the greater components of more oxygenated, Nx and311
NxSx species (Figure 3a), with the four groundwater samples from the Gaspé region grouped
312
together further to the right than most samples from the Édouard region. Amongst Saint-313
Édouard region samples, as a result of greater components of N- and S-containing species in 314
residential wells, these samples generally plotted lower on the y-axis than groundwaters from 315
observation wells (Figure 3a). The two seep samples from the Haldimand region plotted between 316
the oil/shale and groundwater groupings, with the oil seep sample (POT2) containing a 317
naphthenic acid profile suggestive of degraded oil (Figure 2) plotting further to the left and 318
closer to the oil/shale grouping (Figure 3b). 319
The wide range of highly oxygenated and nitrogen- and sulfur-bearing compounds 320
present in both pristine and contaminated groundwaters (e.g., Ahad et al., 2013; Longnecker and 321
Kujawinski, 2011) reflects both the origin and biogeochemical processing of dissolved organic 322
matter. Given the variability in water types and well conditions found in the Saint-Édouard 323
region (Bordeleau et al., accepted), therefore, it is not surprising that groundwater samples from 324
this area were plotted across a wide spectrum on the PC2 axis (Figure 3b). An additional PCA 325
carried out using only observation and residential wells from the Saint-Édouard region, however, 326
suggested an important geological role in controlling AEO distributions (Figure S2). A greater 327
number of samples from the Lotbinière and Les Fonds formations are needed to further examine 328
this influence. 329
3.3 Stable carbon isotope analysis
330
Stable carbon isotope ratios of AEOs (Figure 4) generated by pyrolysis (δ13Cpyr) ranged
331
between -35.2 to -19.5‰ and were on average around 2-3‰ heavier compared to those 332
M
AN
US
CR
IP
T
AC
CE
PT
ED
16 generated by bulk combustion (δ13C; -31.7 to -27.2‰). The one noticeable exception was the 333Haldimand oil sample, whose bulk δ13C value (-28.5‰) was significantly more positive than its 334
δ13Cpyr value (-35.2‰). The first and previous application of intramolecular isotopic analysis of
335
AEOs, carried out on environmental samples from the Athabasca oil sands region, found an ~9‰ 336
enrichment in samples containing predominantly bitumen-derived AEOs (δ13Cpyr around -21‰)
337
compared to those comprised of non-bitumen-derived plant and soil organic matter, 338
demonstrating the ability of this technique to discriminate certain sources of NAs (Ahad et al., 339
2013; Ahad et al., 2012). In contrast, bulk δ13C values of AEOs showed no systematic variation 340
between sample types and thus were not considered suitable for source apportionment (Ahad et 341
al., 2012). Samples containing mostly bitumen-derived AEOs were also strongly correlated with 342
O2 and O2S species classes (Ahad et al., 2013).
343
In groundwater samples from the Saint-Édouard and Gaspé regions, neither systematic 344
trends in δ13Cpyr values (Figure 4) nor significant linear relationships between δ13Cpyr and key
345
species classes were evident (Figure S3). Other than the distinct offset between δ13C and δ13Cpyr
346
values, the lack of any discernible trends in isotopic data is attributed to the overall low 347
proportions of O2 and dominance of C16 and C18 fatty acids in most groundwater samples.
348
Although the proportion of O2 is relatively high in shale and petroleum samples (Figure 3, Table
349
S1), the organic matter in the Saint-Édouard and Gaspé regions has not been subjected to the 350
same geological processes which has resulted in much more enriched δ13Cpyr values (i.e., ~
-351
21‰) in oil sands bitumen AEOs. For instance, the significantly more depleted δ13Cpyr compared
352
to bulk δ13C value in the Haldimand oil sample (Figure 4) conforms to the notion of petroleum 353
that has not undergone extensive degradation, since carboxyl group carbon is generally presumed 354
to be isotopically lighter than the rest of the carbon atoms in the molecule (Sun et al., 2004). 355
M
AN
US
CR
IP
T
AC
CE
PT
ED
17 Given that biodegradation of fatty acids involves a decarboxylation step (Sun et al., 1997), the 356enrichment in δ13Cpyr relative to bulk δ13C values found in groundwater and oil seep samples
357
from the Gaspé region and in groundwater samples from the Saint-Édouard region suggests 358
microbial reworking associated with isotopic fractionation of carboxyl group carbon in AEOs. 359
Significant isotopic fractionation was previously reported in linear fatty acids (Dai et al., 2005) 360
and could potentially explain the most enriched δ13Cpyr value of -19.5‰ found in well F7, a
361
sample that contained high percentages of Z = 0 and -2 C16 and C18 (Table 1).
362
363
4. Conclusions 364
Naphthenic acids were detected in groundwater overlying two undeveloped, 365
unconventional hydrocarbon reservoirs in the province of Québec, Canada. The concentrations 366
of total AEOs were low and characterized by highly oxygenated and N- and S-containing species 367
classes. The distribution patterns of NAs in most samples were dominated by straight-chain (i.e., 368
Z = 0) C16 and C18 fatty acids – ubiquitous compounds found in plant and soil organic matter.
369
However, a range of C10 to C18, Z = -4 to Z = -12 NAs were also found, with several samples
370
containing relatively greater proportions of potentially toxic alicyclic bicyclic acids (i.e., Z = -4). 371
The occurrence of these compounds points to a natural background source of organic 372
contaminants prior to large-scale hydrocarbon development. Moreover, their detection in wells 373
near fault zones implies a potential for migration of NAs during extraction activities such as 374
hydraulic fracturing, as has been reported for other organic contaminants in the Marcellus Shale 375
region (Llewellyn et al., 2015). In the Saint-Édouard region, however, recent work has shown 376
that faults are not likely to offer a fluid flow-path reaching all the way to the Utica Shale 377
M
AN
US
CR
IP
T
AC
CE
PT
ED
18 (Ladevèze, 2017). It is uncertain whether the presumably bicyclic acids (Z = -4) and other NAs 378in groundwater samples originated from mixing with a different water source or were generated 379
by in situ microbial transformation of shale organic matter (Saint-Édouard) or petroleum 380
(Gaspé). The latter is supported by the 2-3‰ enrichment in δ13Cpyr compared to bulk δ13C values
381
of AEOs which suggests a possible isotopic fractionation due to biodegradation. 382
In light of the findings reported here in the Saint-Édouard and Gaspé regions, routine 383
screening for NAs in environmental samples from areas undergoing shale gas or tight oil 384
development may be warranted. In addition, future investigations into the origins and 385
distributions of NAs in these regions should incorporate the use of other analytical techniques 386
such as GC × GC-MS to identify and quantify individual compounds, in particular those which 387
are toxic and pose a risk to the environment. 388
389
Acknowledgements 390
The authors wish to thank Jade Bergeron, Anna Smirnoff and Marc Luzincourt for help 391
with sample preparation and laboratory analyses, Geneviève Bordeleau, Christine Rivard and 392
Xavier Malet for collection of groundwater and shale samples, and Martine M. Savard for 393
helpful comments that greatly improved the manuscript. This research was funded by Natural 394
Resources Canada’s Environmental Geoscience Program through both Shale Gas and SOURCES 395
Projects, and by the Québec Environment Ministry (Ministère du Développement durable, de 396
l’Environnement et de la Lutte contre le changement climatique). This is NRCan Contribution # 397
20170094. 398
M
AN
US
CR
IP
T
AC
CE
PT
ED
19 Appendix A. Supplementary data400
Supplementary data related to this article can be found at xxxx. 401
402
References 403
Ahad, J.M.E., Pakdel, H., Savard, M.M., Calderhead, A.I., Gammon, P.R., Rivera, A., Headley, 404
J.V., Peru, K.M., 2013. Characterization and Quantification of Mining-Related 405
“Naphthenic Acids” in Groundwater near a Major Oil Sands Tailings Pond. 406
Environmental Science & Technology 47, 5023−5030. 407
Ahad, J.M.E., Pakdel, H., Savard, M.M., Simard, M.-C., Smirnoff, A., 2012. Extraction, 408
separation and intramolecular carbon isotope characterization of Athabasca oil sands 409
acids in environmental samples. Analytical Chemistry 84, 10419−10425. 410
Atlas, R.M., 1981. Microbial degradation of petroleum hydrocarbons: an environmental 411
perspective. Microbiological reviews 45, 180. 412
Bae, E., Na, J.-G., Chung, S.H., Kim, H.S., Kim, S., 2010. Identification of about 30 000 413
Chemical Components in Shale Oils by Electrospray Ionization (ESI) and Atmospheric 414
Pressure Photoionization (APPI) Coupled with 15 T Fourier Transform Ion Cyclotron 415
Resonance Mass Spectrometry (FT-ICR MS) and a Comparison to Conventional Oil. 416
Energy & Fuels 24, 2563-2569. 417
Barth, T., Høiland, S., Fotland, P., Askvik, K.M., Pedersen, B.S., Borgund, A.E., 2004. Acidic 418
compounds in biodegraded petroleum. Organic Geochemistry 35, 1513-1525. 419
Bordeleau, G., Rivard, C., Lavoie, D., Lefebvre, R., Malet, X., Ladevèze, P., accepted. 420
Geochemistry of groundwater in the Saint-Édouard area, Quebec, Canada, and its 421
influence on the distribution of methane in shallow aquifers. Applied Geochemistry. 422
Bordeleau, G., Rivard, C., Lavoie, D., Mort, A., Ahad, J., Malet, X., Xu, X., 2015. Identifying 423
the Source of Methane in Groundwater in a ‘virgin’ Area with Regards to Shale Gas 424
Exploitation: A Multi-isotope Approach, Procedia Earth and Planetary Science, 11th 425
Applied Isotope Geochemistry Conference, pp. 219-222. 426
Bowman, D.T., Slater, G.F., Warren, L.A., McCarry, B.E., 2014. Identification of individual 427
thiophene-, indane-, tetralin-, cyclohexane-, and adamantane-type carboxylic acids in 428
composite tailings pore water from Alberta oil sands. Rapid Communications in Mass 429
Spectrometry 28, 2075-2083. 430
Chatellier, J.-Y., Ferworn, K., Larsen, N.L., Ko, S., Flek, P., Molgat, M., Anderson, I., 2013. 431
Overpressure in shale gas: when geochemistry and reservoir engineering data meet and 432
agree. In: J. Chatellier and D. Jarvie (Editors), Critical assessment of shale resource 433
plays: AAPG Memoir 103, pp. 45–69. 434
Chen, X., Shen, B., Sun, J., Wang, C., Shan, H., Yang, C., Li, C., 2012. Characterization and 435
Comparison of Nitrogen Compounds in Hydrotreated and Untreated Shale Oil by 436
Electrospray Ionization (ESI) Fourier Transform Ion Cyclotron Resonance Mass 437
Spectrometry (FT-ICR MS). Energy & Fuels 26, 1707-1714. 438
M
AN
US
CR
IP
T
AC
CE
PT
ED
20 Clemente, J.S., Fedorak, P.M., 2005. A review of the occurrence, analyses, toxicity, and 439biodegradation of naphthenic acids. Chemosphere 60, 585-600. 440
Dai, J., Sun, M.-Y., Culp, R.A., Noakes, J.E., 2005. Changes in chemical and isotopic signatures 441
of plant materials during degradation: Implication for assessing various organic inputs in 442
estuarine systems. Geophysical Research Letters 32. 443
Debenest, T., Turcotte, P., Gagné, F., Gagnon, C., Blaise, C., 2012. Ecotoxicological impacts of 444
effluents generated by oil sands bitumen extraction and oil sands lixiviation on 445
Pseudokirchneriella subcapitata. Aquatic Toxicology 112–113, 83-91. 446
Drollette, B.D., Hoelzer, K., Warner, N.R., Darrah, T.H., Karatum, O., O’Connor, M.P., Nelson, 447
R.K., Fernandez, L.A., Reddy, C.M., Vengosh, A., Jackson, R.B., Elsner, M., Plata, D.L., 448
2015. Elevated levels of diesel range organic compounds in groundwater near Marcellus 449
gas operations are derived from surface activities. Proceedings of the National Academy 450
of Sciences of the United States of America 112, 13184-13189. 451
Eglinton, G., Douglas, A.G., Maxwell, J.R., Ramsay, J.N., Ställberg-Stenhagen, S., 1966. 452
Occurrence of isoprenoid fatty acids in the Green River shale. Science 153, 1133-1135. 453
Filzmoser, P., Hron, K., Reimann, C., 2009. Univariate statistical analysis of environmental 454
(compositional) data: Problems and possibilities. Science of The Total Environment 407, 455
6100-6108. 456
Frank, R.A., Roy, J.W., Bickerton, G., Rowland, S.J., Headley, J.V., Scarlett, A.G., West, C.E., 457
Peru, K.M., Parrott, J.L., Conly, F.M., Hewitt, L.M., 2014. Profiling Oil Sands Mixtures 458
from Industrial Developments and Natural Groundwaters for Source Identification. 459
Environmental Science & Technology 48, 2660–2670. 460
Haug, P., Schnoes, H.K., Burlingame, A.L., 1971. Studies of the acidic components of the 461
Colorado Green River Formation oil shale: Mass spectrometric identification of the 462
methyl esters of extractable acids. Chemical Geology 7, 213-236. 463
Headley, J.V., Barrow, M.P., Peru, K.M., Fahlman, B., Frank, R.A., Bickerton, G., McMaster, 464
M.E., Parrott, J., Hewitt, L.M., 2011. Preliminary fingerprinting of Athabasca oil sands 465
polar organics in environmental samples using electrospray ionization Fourier transform 466
ion cyclotron resonance mass spectrometry. Rapid Communications in Mass 467
Spectrometry 25, 1899-1909. 468
Headley, J.V., Peru, K.M., Barrow, M.P., 2016. Advances in mass spectrometric characterization 469
of naphthenic acids fraction compounds in oil sands environmental samples and crude 470
oil—A review. Mass Spectrometry Reviews 35, 311-328. 471
Headley, J.V., Peru, K.M., Mohamed, M.H., Frank, R.A., Martin, J.W., Hazewinkel, R.R.O., 472
Humphries, D., Gurprasad, N.P., Hewitt, L.M., Muir, D.C.G., Lindeman, D., Strub, R., 473
Young, R.F., Grewer, D.M., Whittal, R.M., Fedorak, P.M., Birkholz, D.A., Hindle, R., 474
Reisdorph, R., Wang, X., Kasperski, K.L., Hamilton, C., Woudneh, M., Wang, G., 475
Loescher, B., Farwell, A., Dixon, D.G., Ross, M., Pereira, A.D.S., King, E., Barrow, 476
M.P., Fahlman, B., Bailey, J., McMartin, D.W., Borchers, C.H., Ryan, C.H., Toor, N.S., 477
Gillis, H.M., Zuin, L., Bickerton, G., McMaster, M., Sverko, E., Shang, D., Wilson, L.D., 478
Wrona, F.J., 2013. Chemical fingerprinting of naphthenic acids and oil sands process 479
waters—A review of analytical methods for environmental samples. Journal of 480
Environmental Science and Health, Part A 48, 1145-1163.Hoelzer, K., Sumner, A.J., 481
Karatum, O., Nelson, R.K., Drollette, B.D., O’Connor, M.P., D’Ambro, E.L., Getzinger, 482
G.J., Ferguson, P.L., Reddy, C.M., Elsner, M., Plata, D.L., 2016. Indications of 483
Transformation Products from Hydraulic Fracturing Additives in Shale-Gas Wastewater. 484
M
AN
US
CR
IP
T
AC
CE
PT
ED
21 Environmental Science & Technology 50, 8036-8048.Hughes, S.A., Huang, R., 485Mahaffey, A., Chelme-Ayala, P., Klamerth, N., Meshref, M.N.A., Ibrahim, M.D., Brown, 486
C., Peru, K.M., Headley, J.V., Gamal El-Din, M., 2017. Comparison of methods for 487
determination of total oil sands-derived naphthenic acids in water samples. Chemosphere 488
187, 376-384. 489
Hughey, C.A., Minardi, C.S., Galasso-Roth, S.A., Paspalof, G.B., Mapolelo, M.M., Rodgers, 490
R.P., Marshall, A.G., Ruderman, D.L., 2008. Naphthenic acids as indicators of crude oil 491
biodegradation in soil, based on semi-quantitative electrospray ionization Fourier 492
transform ion cyclotron resonance mass spectrometry. Rapid Communications in Mass 493
Spectrometry 22, 3968-3976. 494
Jayaraman, A., Singh, H., Lefebvre, Y., 1986. Naphthenic acid corrosion in petroleum refineries. 495
A review. Revue de l'Institut français du pétrole 41, 265-274. 496
Jones, D., Scarlett, A.G., West, C.E., Rowland, S.J., 2011. Toxicity of Individual Naphthenic 497
Acids to Vibrio fischeri. Environmental Science & Technology 45, 9776-9782. 498
Kim, S., Stanford, L.A., Rodgers, R.P., Marshall, A.G., Walters, C.C., Qian, K., Wenger, L.M., 499
Mankiewicz, P., 2005. Microbial alteration of the acidic and neutral polar NSO 500
compounds revealed by Fourier transform ion cyclotron resonance mass spectrometry. 501
Organic Geochemistry 36, 1117-1134. 502
Ladevèze, P., 2017. Aquifères superficiels et gaz de shale : le rôle des failles et des réseaux de 503
fractures sur la circulation des fluides [In French and English]. Ph.D. Thesis. Centre Eau 504
Terre Environnement. Institut national de la recherche scientifique (INRS), Québec, QC, 505
Canada. 506
Laredo, G.C., López, C.R., Álvarez, R.E., Cano, J.L., 2004. Naphthenic acids, total acid number 507
and sulfur content profile characterization in Isthmus and Maya crude oils. Fuel 83, 1689-508
1695. 509
Lavoie, D., Pinet, N., Bordeleau, G., Ardakani, O.H., Ladevèze, P., Duchesne, M.J., Rivard, C., 510
Mort, A., Brake, V., Sanei, H., Malet, X., 2016. The Upper Ordovician black shales of 511
southern Quebec (Canada) and their significance for naturally occurring hydrocarbons in 512
shallow groundwater. International Journal of Coal Geology 158, 44-64. 513
Lavoie, D., Rivard, C., Lefebvre, R., Séjourné, S., Thériault, R., Duchesne, M.J., Ahad, J.M.E., 514
Wang, B., Benoit, N., Lamontagne, C., 2014. The Utica Shale and gas play in southern 515
Quebec: Geological and hydrogeological syntheses and methodological approaches to 516
groundwater risk evaluation. International Journal of Coal Geology 126, 77-91. 517
Llewellyn, G.T., Dorman, F., Westland, J., Yoxtheimer, D., Grieve, P., Sowers, T., Humston-518
Fulmer, E., Brantley, S.L., 2015. Evaluating a groundwater supply contamination 519
incident attributed to Marcellus Shale gas development. Proceedings of the National 520
Academy of Sciences 112, 6325-6330. 521
Longnecker, K., Kujawinski, E.B., 2011. Composition of dissolved organic matter in 522
groundwater. Geochimica et Cosmochimica Acta 75, 2752-2761. 523
Marentette, J.R., Frank, R.A., Bartlett, A.J., Gillis, P.L., Hewitt, L.M., Peru, K.M., Headley, J.V., 524
Brunswick, P., Shang, D., Parrott, J.L., 2015. Toxicity of naphthenic acid fraction 525
components extracted from fresh and aged oil sands process-affected waters, and 526
commercial naphthenic acid mixtures, to fathead minnow (Pimephales promelas) 527
embryos. Aquatic Toxicology 164, 108-117. 528
M
AN
US
CR
IP
T
AC
CE
PT
ED
22 Melvin, S.D., Trudeau, V.L., 2012. Growth, development and incidence of deformities in 529amphibian larvae exposed as embryos to naphthenic acid concentrations detected in the 530
Canadian oil sands region. Environmental Pollution 167, 178-183. 531
Meredith, W., Kelland, S.J., Jones, D.M., 2000. Influence of biodegradation on crude oil acidity 532
and carboxylic acid composition. Organic Geochemistry 31, 1059-1073. 533
Oiffer, A.A.L., Barker, J.F., Gervais, F.M., Mayer, K.U., Ptacek, C.J., Rudolph, D.L., 2009. A 534
detailed field-based evaluation of naphthenic acid mobility in groundwater. Journal of 535
Contaminant Hydrology 108, 89-106. 536
Orem, W., Tatu, C., Varonka, M., Lerch, H., Bates, A., Engle, M., Crosby, L., McIntosh, J., 537
2014. Organic substances in produced and formation water from unconventional natural 538
gas extraction in coal and shale. International Journal of Coal Geology 126, 20-31. 539
Orem, W.H., Voytek, M.A., Jones, E.J., Lerch, H.E., Bates, A.L., Corum, M.D., Warwick, P.D., 540
Clark, A.C., 2010. Organic intermediates in the anaerobic biodegradation of coal to 541
methane under laboratory conditions. Organic Geochemistry 41, 997-1000. 542
Raynauld, M., Peel, M., Lefebvre, R., Crow, H., Molson, J., Ahad, J., Gloaguen, E., 2014. 543
Caractérisation hydrogéologique du secteur Haldimand, 544
http://www.mddelcc.gouv.qc.ca/eau/etudehydro.htm. Institut national de la recherche 545
scientifique, Centre Eau Terre Environnement, pp. 229. 546
Raynauld, M., Peel, M., Lefebvre, R., Molson, J.W., Crow, H., Ahad, J.M.E., Ouellet, M., 547
Aquilina, L., 2016. Understanding shallow and deep flow for assessing the risk of 548
hydrocarbon development to groundwater quality. Marine and Petroleum Geology 78, 549
728-737. 550
Rivard, C., Lavoie, D., Lefebvre, R., Séjourné, S., Lamontagne, C., Duchesne, M., 2014. An 551
overview of Canadian shale gas production and environmental concerns. International 552
Journal of Coal Geology 126, 64-76. 553
Ross, M.S., Pereira, A.d.S., Fennell, J., Davies, M., Johnson, J., Sliva, L., Martin, J.W., 2012. 554
Quantitative and Qualitative Analysis of Naphthenic Acids in Natural Waters 555
Surrounding the Canadian Oil Sands Industry. Environmental Science & Technology 46, 556
12796-12805. 557
Rowland, S.J., Scarlett, A.G., Jones, D., West, C.E., Frank, R.A., 2011a. Diamonds in the rough: 558
Identification of individual naphthenic acids in oil sands process water. Environmental 559
Science and Technology 45, 3154-3159. 560
Rowland, S.J., West, C.E., Jones, D., Scarlett, A.G., Frank, R.A., Hewitt, L.M., 2011b. Steroidal 561
aromatic Naphthenic Acids in oil sands process-affected water: Structural comparisons 562
with environmental estrogens. Environmental Science and Technology 45, 9806-9815. 563
Salmon, E., Behar, F., Hatcher, P.G., 2011. Molecular characterization of Type I kerogen from 564
the Green River Formation using advanced NMR techniques in combination with 565
electrospray ionization/ultrahigh resolution mass spectrometry. Organic Geochemistry 566
42, 301-315. 567
Savard, M.M., Ahad, J.M.E., Gammon, P., Calderhead, A.I., Rivera, A., Martel, R., Klebek, M., 568
Headley, J.V., Lefebvre, R., Welsh, B., Smirnoff, A., Pakdel, H., Benoit, N., Liao, S., 569
Jautzy, J., Gagnon, C., Vaive, J., Girard, I., Peru, K.M., 2012. A local test study 570
distinguishes natural from anthropogenic groundwater contaminants near an Athabasca 571
oil sands mining operation, Geological Survey of Canada, Natural Resources Canada, 572
Ottawa, Open File 7195, doi:10.4095/292074. 573
M
AN
US
CR
IP
T
AC
CE
PT
ED
23 Scarlett, A.G., Reinardy, H.C., Henry, T.B., West, C.E., Frank, R.A., Hewitt, L.M., Rowland, 574S.J., 2013. Acute toxicity of aromatic and non-aromatic fractions of naphthenic acids 575
extracted from oil sands process-affected water to larval zebrafish. Chemosphere 93, 415-576
420. 577
Scott, A.C., Whittal, R.M., Fedorak, P.M., 2009. Coal is a potential source of naphthenic acids in 578
groundwater. Science of the Total Environment 407, 2451-2459. 579
Snape, C.E., Stokes, B.J., Bartle, K.D., 1981. Identification of straight-chain fatty acids in coal 580
extracts and their geochemical relation with straight-chain alkanes. Fuel 60, 903-908. 581
Stringfellow, W.T., Camarillo, M.K., Domen, J.K., Sandelin, W.L., Varadharajan, C., Jordan, 582
P.D., Reagan, M.T., Cooley, H., Heberger, M.G., Birkholzer, J.T., 2017. Identifying 583
chemicals of concern in hydraulic fracturing fluids used for oil production. 584
Environmental Pollution 220, Part A, 413-420. 585
Sun, M.-Y., Wakeham, S.G., Lee, C., 1997. Rates and mechanisms of fatty acid degradation in 586
oxic and anoxic coastal marine sediments of Long Island Sound, New York, USA. 587
Geochimica et Cosmochimica Acta 61, 341-355. 588
Sun, M.-Y., Zou, L., Dai, J., Ding, H., Culp, R.A., Scranton, M.I., 2004. Molecular carbon 589
isotopic fractionation of algal lipids during decomposition in natural oxic and anoxic 590
seawaters. Organic Geochemistry 35, 895-908. 591
Thorn, K.A., Aiken, G.R., 1998. Biodegradation of crude oil into nonvolatile organic acids in a 592
contaminated aquifer near Bemidji, Minnesota. Organic Geochemistry 29, 909-931. 593
Tomczyk, N.A., Winans, R.E., Shinn, J.H., Robinson, R.C., 2001. On the nature and origin of 594
acidic species in petroleum. 1. Detailed acid type distribution in a California crude oil. 595
Energy and Fuels 15, 1498-1504. 596
Tong, J., Liu, J., Han, X., Wang, S., Jiang, X., 2013. Characterization of nitrogen-containing 597
species in Huadian shale oil by electrospray ionization Fourier transform ion cyclotron 598
resonance mass spectrometry. Fuel 104, 365-371. 599
Watson, J.S., Jones, D.M., Swannell, R.P.J., Van Duin, A.C.T., 2002. Formation of carboxylic 600
acids during aerobic biodegradation of crude oil and evidence of microbial oxidation of 601
hopanes. Organic Geochemistry 33, 1153-1169. 602
West, C.E., Pureveen, J., Scarlett, A.G., Lengger, S.K., Wilde, M.J., Korndorffer, F., Tegelaar, 603
E.W., Rowland, S.J., 2014. Can two-dimensional gas chromatography/mass 604
spectrometric identification of bicyclic aromatic acids in petroleum fractions help to 605
reveal further details of aromatic hydrocarbon biotransformation pathways? Rapid 606
Communications in Mass Spectrometry 28, 1023-1032. 607
Wilde, M.J., West, C.E., Scarlett, A.G., Jones, D., Frank, R.A., Hewitt, L.M., Rowland, S.J., 608
2015. Bicyclic naphthenic acids in oil sands process water: Identification by 609
comprehensive multidimensional gas chromatography–mass spectrometry. Journal of 610 Chromatography A 1378, 74-87. 611 612 613 614
M
AN
US
CR
IP
T
AC
CE
PT
ED
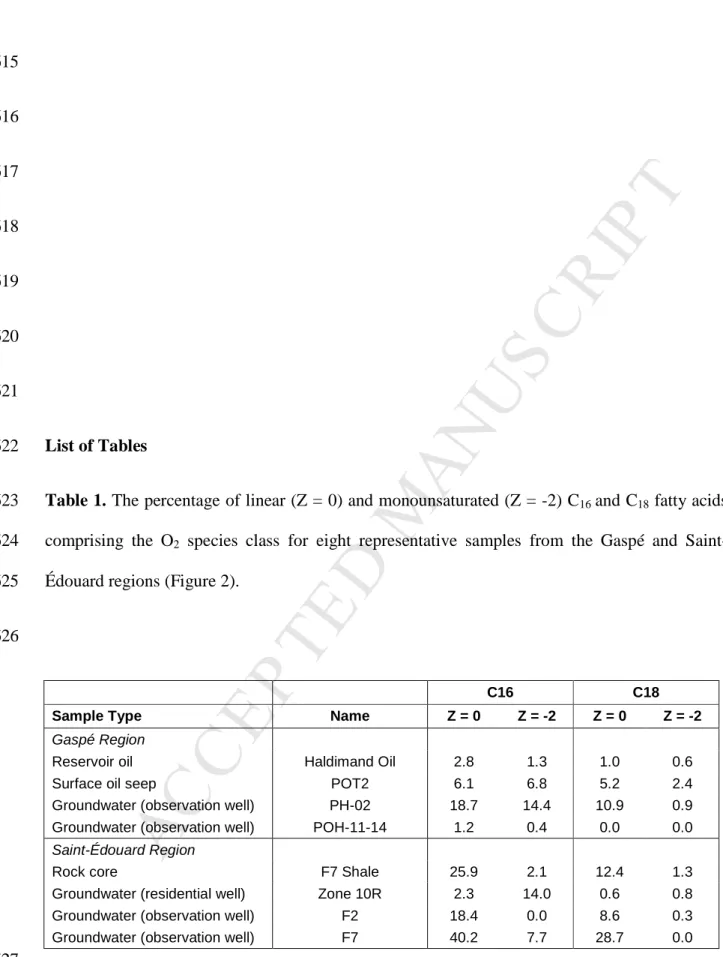
24 615 616 617 618 619 620 621 List of Tables 622Table 1. The percentage of linear (Z = 0) and monounsaturated (Z = -2) C16 and C18 fatty acids
623
comprising the O2 species class for eight representative samples from the Gaspé and
Saint-624
Édouard regions (Figure 2). 625
626
C16 C18
Sample Type Name Z = 0 Z = -2 Z = 0 Z = -2
Gaspé Region
Reservoir oil Haldimand Oil 2.8 1.3 1.0 0.6
Surface oil seep POT2 6.1 6.8 5.2 2.4
Groundwater (observation well) PH-02 18.7 14.4 10.9 0.9
Groundwater (observation well) POH-11-14 1.2 0.4 0.0 0.0
Saint-Édouard Region
Rock core F7 Shale 25.9 2.1 12.4 1.3
Groundwater (residential well) Zone 10R 2.3 14.0 0.6 0.8
Groundwater (observation well) F2 18.4 0.0 8.6 0.3
Groundwater (observation well) F7 40.2 7.7 28.7 0.0
627
M
AN
US
CR
IP
T
AC
CE
PT
ED
25 628 629 630 631 632 633 634 List of Figures 635Figure 1. Map of the study area showing the locations of the Saint-Édouard region and 636
Haldimand sector (Gaspé) in the province of Québec, Canada. 637
638
Figure 2. The distributions of naphthenic acids (NAs) in representative samples from the Gaspé 639
(Haldimand reservoir oil, natural surface oil seep POT2, groundwater from observation wells 640
PH-02 and POH-11-10) and Saint-Édouard (shale F7, groundwater from residential well Zone 641
10R and observation wells F2 and F7) regions plotted according to carbon number, the 642
percentage of O2 species class and Z value. NAs are defined by the classical chemical formula
643
CnH2n+ZO2, where n indicates the carbon number and Z is zero or a negative, even integer that
644
specifies the hydrogen deficiency resulting from ring formation. 645
M
AN
US
CR
IP
T
AC
CE
PT
ED
26 Figure 3. Principal Components Analysis (PCA) loadings (a) and scores (b) carried out on log-646transformed (log(x+1)) species percentages (Nx, NxSx, NxOx, NxOxSx, OxSx, O1 to O10 and Sx) in
647
acid extractable organics (AEOs) determined in Haldimand sector oil (open square), natural seep 648
(solid red squares) and groundwater samples (inverted yellow triangles), and Saint-Édouard 649
region shale (black circles), residential well groundwater (solid blue triangles) and observation 650
well groundwater samples (open triangles). The solid green diamond is the shale sample process 651
blank, and the open diamonds are the groundwater sample process blanks. 652
Figure 4. Stable carbon isotope ratios of acid extractable organics (AEOs) generated by 653
pyrolysis (δ13Cpyr; solid colours) and bulk combustion (δ13C: open symbols) in Haldimand sector
654
reservoir oil (red squares), natural surface oil seep (red diamonds) and groundwater samples (red 655
inverted triangles), and Saint-Édouard region residential well (blue circles) and observation well 656
groundwater samples (blue triangles). 657
658
M
AN
US
CR
IP
T
AC
CE
PT
ED
27 660 Figure 1 661 662M
AN
US
CR
IP
T
AC
CE
PT
ED
28 663 Figure 2 664M
AN
US
CR
IP
T
AC
CE
PT
ED
29 665 Figure 3 666 667 668 669 670 671 672 673 674 675M
AN
US
CR
IP
T
AC
CE
PT
ED
30 676 Figure 4 677M
AN
US
CR
IP
T
AC
CE
PT
ED
Highlights:• NAs were found in groundwater overlying undeveloped shale gas and tight oil plays. • Most abundant NAs were straight-chain or monounsaturated C16 and C18 fatty acids. • Alicyclic bicyclic NAs (Z = -4) were detected in several groundwater samples. • Natural background source of organic contaminants prior to hydrocarbon extraction.