OATAO is an open access repository that collects the work of Toulouse
researchers and makes it freely available over the web where possible
Any correspondence concerning this service should be sent
to the repository administrator:
[email protected]
This is an author’s version published in:
http://oatao.univ-toulouse.fr/25314
To cite this version:
Duguet, Thomas
and Gavrielides, Andreas
and Esvan, Jérôme
and
Mineva, Tzonka and Lacaze-Dufaure, Corinne
DFT Simulation of XPS
Reveals Cu/Epoxy Polymer Interfacial Bonding. (2019) The Journal of
Physical Chemistry C, 123 (51). 30917-30925. ISSN 1932-7447
Official URL: https://doi.org/10.1021/acs.jpcc.9b07772
transition temperature, in contrast with metal/thermoplastics interfaces.16,18−21Finally, when the adsorption is accompanied by a degradation of the polymer chain by cissions, the most reactive metals (e.g., Cr or Ni) form carbides or phosphides.13,22
An important general observation of the above mentioned studies is that almost all metal/polymer bond creations or interactions correspond to a change in X ray photoelectron spectroscopy (XPS) spectra. Hence, XPS is very well suited for the determination of adsorption mechanisms at metal/polymer interfaces. But, as stated by Wolany et al.“The main problems for line analysis are the exact calibration of the binding energy scale in the absence of a well defined aliphatic C 1s line and the number of peaks to be included into thefit of the C 1s line at a given energy resolution of the spectral data.”.14This is one of the major limitations of XPS in complex systems that contain a variety of bonds and environments. There, the support of theoretical calculations is of great value. Several codes and methods are available in the density functional theory (DFT) or Hartree−Fock frameworks.23−34We recently proposed a decomposition of the C 1s peak of the poly epoxy formed by polyaddition of diglycidylether of bisphenol A (DGEBA) and ethylene diamine (EDA),first with rough initial state DFT calculations35 and then with a high accuracy Hartree−Fock ΔSCF study that accounts for both initial and final state effects and simulates relative peak intensities.36
The high accuracy decomposition of the C 1s peak includes 9 contributions instead of 3 when performed empirically. Additionally, we demonstrate that whereas some C bonds are found at discrete binding energies, others allow quite large binding energy domains. This is due to different second neighbor interactions that may add further uncertainty to experimental decomposition.36
In the present work, we further study this system and its interaction with Cu. We use a different method by simulating XPS spectra by density functional theory (DFT) in the framework of the unrestricted generalized transition state theory (uGTS). Accurate simulations of XPS spectra have to take into account both initial state andfinal state effects. It can be achieved (i) at the Hartree−Fock (H−F) ΔSCF level of theory36,37and (ii) in the framework of the density functional theory using Slater’s Transition State theory (TS).38The latter method is based on the Taylor series expansion of the energy in terms of the shell occupation and the idea is to remove a fraction of electron from the molecular orbital of interest. Slater’s transition state (TS) method leads to a calculation of the core electron BEs witheq 1
BE 1 2 k ε = − i k jjj y{zzz (1)
withεkbeing the energy of the molecular orbital of interest,
with an occupation number of 1/2 electron.
This was generalized by Williams et al.,39who demonstrated that the core ionization energy is more accurate witheq 2
BE 1 4 (1) 3 1 3 k k ε ε = − i + × k jjjj ikjjj y{zzzy{zzzz (2) withεkbeing the energy of the molecular orbital of interest,
with successively an occupation of 1 and 1/3 electrons. Chong et al.40,41and Endo et al.42−45later showed that the most accurate results are obtained with an occupation of 1/3 and calculations performed as unrestricted. This latter
development is known as the unrestricted Generalized Transition State (uGTS) theory.
Within the uGTS framework, we reproduce and improve the simulation of the XPS spectra of the pristine epoxy polymer as compared to our previous results. Then, we use simulated XPS to assess the bonding mechanisms responsible for thefirst step of formation of Cu thin films on the epoxy polymer. The experimental counterpart consists in the UHV evaporation of Cu thinfilms, followed by XPS and atomic force microscopy (AFM).
2. EXPERIMENTAL AND COMPUTATIONAL DETAILS
2.1. Experimental Details. The poly epoxy is formed by poly addition of diglycidylether of Bisphenol A (DGEBA) and ethylene diamine (EDA) poured on 1 × 1 cm2 Si wafer coupons. Samples are obtained by slow polymerization at ambient temperature (24 h), followed by post curing above the glass transition temperature (2 h, 140°C) in an Ar glovebox. This protocol (published elsewhere17,35) maximizes the polymerization rate and limits the formation of surface defects to a minimum.
Samples are then transferred to a UHV chamber where pure Cu (99.999%) is evaporated in a chamber with a base pressure of 5 × 10⁻¹⁰ mbar with a Mantis M−EV e beam evaporator (293 K, 8 × 10⁻¹ mbar, 6 min, 25 W, 23.2 nA). X ray photoelectron spectroscopy (XPS) is performed using a Thermo Scientific K alpha apparatus (hν(Al Kα) = 1486.6 eV). The pass energy isfixed at 40 eV. A Shirley background is systematically subtracted. Sputtering is achieved with Ar+ions (500 eV, 10 mA, Raster area of 2 mm2) to remove the
pollution layer formed during transfer to the XPS apparatus. For the latter, we monitor the recovery of metallic copper by analyzing the Cu 2p peaks and the shape of the Cu LMM peaks and by measuring the modified Auger parameter (α′ = BECu2p+ KECuLMM).46After 60 s of sputtering, the Cu LMM
and Cu 2p peaks are identical to our pure Cu0 foil reference
and the modified Auger parameters are almost equal: α′Cu film=
1851.29 eV and α′Cu ref = 1851.35 eV. Therefore, the O 1s signal after 60 s sputtering originates from the oxygen of the poly epoxy underneath the Cu film. The C 1s peak is also monitored: its intensityfirst decreases upon sputtering (for 5, 10, 15, and 20 s total sputtering time) before it increases again (for 25, 30, 60, 80, and 100 s total sputtering time). At the selected time of 60 s used in the study below, the C 1s peak then originates from the poly epoxy sample underneath. By doing so, we are able to analyze and discuss chemical bonding at the buried Cu/epoxy interface based on the fine decomposition of C 1s and O 1s peaks.
Finally, the surfaces of the Cufilms are also characterized by atomic force microscopy (AFM, Agilent Technologies model 5500) in ambient conditions in Tapping mode with tips of k = 25−75 N/m (AppNano). The scanning rate is 2 μm/s. Images are processed with the software Gwyddion version 2.19.47
2.2. Computational Details. The molecular model that we use to simulate the surface properties of the epoxy polymer is composed of one DGEBA molecule connected to one EDA molecule (Figure 1). This model, called the“dimer model” in the following, is used to study the adsorption of Cu atoms on poly epoxy and to simulate the XPS spectra for the pristine surface and for the Cu covered poly epoxy surface. Carbon atoms are numberedfirst, from the right to the left, and then O atoms are numbered from the left to the right, as shown in
2.2.1. Identification of Cu-Adsorption Sites. The geo metries of the systems were fully optimized using conjugate gradient methods with the Gaussian09 package.48To identify the most favorable adsorption site(s) for Cu atoms, we initially positioned one Cu atom in many adsorption sites on the dimer molecule and we optimize the Cu/dimer molecule system without constraint. Two functionals were tested: the B3LYP hybrid functional49,50 and the gradient corrected PBE func tional.51 The geometry optimizations were done with the 6 31G* basis set and the stationary points were characterized as minima by a vibrational analysis. This step was followed by a Mulliken population analysis to obtain the charge on each atom.
2.2.2. Simulation of XPS Spectra. The XPS spectra are simulated in the framework of the unrestricted Generalized Transition State theory (uGTS) using the PBE functional.51 To this aim, the following computational scheme is used with the deMon2k code:52(i) we fully optimize the systems with a relativistic valence basis set, GENA2 auxiliary functions,53and relativistic Stuttgart pseudopotentials54 for all of the atoms, except for the H atoms (DZVP); (ii) we then remove the pseudopotential on the atom of interest, i.e., C or O atoms, to calculate the energy of the 1s orbital for this atom and we apply the large AUG cc pVTZ orbital basis set55 to this atom to perform single point calculation of the energy of the neutral molecule and of the energy −εk(1) of the 1s orbital for the atom of interest; and (iii) finally, we perform a single point calculation of the energy on the ionized molecule, with 0.33 electron on the 1s orbital for the atom of interest. We obtain the energy−εk(1/3) of the 1s orbital; (iv) we then applyeq 2
and compose the simulated spectra with calculated binding energy shifts (ΔBE). Finally, these theoretical XPS results are compared to the experimental XPS data to estimate the ability of the limited size theoretical model to correctly capture the Cu/polymer interaction.
3. RESULTS AND DISCUSSION
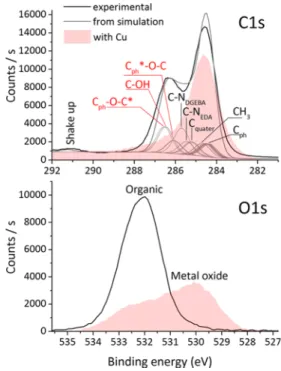
3.1. Characterization of the Epoxy Polymer/Copper Thin-Film Interface by XPS and AFM. The experimental C 1s and O 1s XPS spectra of the clean epoxy surface are shown in black in Figure 2. The C 1s peak is composed of three features: the main peak centered at a binding energy (BE) of 284.6 eV, a high BE shoulder centered at 286.3 eV, and a shake up satellite centered at 291.2 eV. After Cu deposition, the shoulder is strongly diminished. The O 1s peak is centered at BE = 532.1 eV (FWHM = 1.8 eV), typical of organic environments. After Cu deposition, the O 1s peak shape is strongly modified with the occurrence of a metal oxide contribution at BE = 530.1 eV.
To decompose the spectra with a greater accuracy than by using database BEs, we use calculated BEs arising from the uGTS DFT calculations (namely from the molecular orbitals energiesεk(1) andεk(1/3)) detailed inSection 2. Calculation results are summarized inTable 1. The orbital ID follows the numbering of the C atoms of the model dimer shown inFigure 1. Chemical shifts (ΔBEs) refer to the orbital with the lowest energy (C9),fixed at 0 eV.
The calculated chemical shifts and the relative intensities are used to fit the experimental C 1s spectrum. In other words, energies and intensities are all dependent on each other, but the absolute positioning and spectral intensity arefitted to the experiment. The FWHM isfixed at 0.9 eV for all contributions. The result is shown inFigure 2(gray line), where thefitting is very satisfactory. Each individual contribution is identified with its originating bond (an asterisk pin points the carbon atom of interest when needed). As compared to our previous simulations of the same system in the framework of Hartree−Fock ΔSCF calculations,36 the positioning of the high BE peak is better. Anyway, bonds appear with the same increasing chemical shift order as in our previous work, and the qualitative result is similar.
The experimental C 1s XPS spectrum after Cu deposition is also shown in Figure 2with the filled area. It shows a wide peak centered at BE = 284.6 eV. Discrepancies with the pristine surface are obvious with the drastic decrease of the high BE shoulder and the disappearance of the shake up satellite. Therefore, through Cu deposition, the contributions of Cph−O−C*, C−OH, and Cph*−O−C are modified or
suppressed, indicating a strong interaction of Cu atoms with these groups. In addition, the shake up satellite that arises from π−π* transitions in phenyls groups disappears, further indicating interactions with Cph.
We further characterize the surface of the Cu thinfilm with AFM. The surface roughness, Ra, is determined by the post
Figure 1. Dimer model. The color code is as follows: blue for nitrogen atoms, gray for carbon atoms, and red for oxygen atoms.
Figure 2.Experimental C 1s and O 1s XPS spectra of the pristine surface (black line) and of the Cu covered surface (filled area), along with the simulated spectrum (gray line), obtained by fitting experimental intensity atfixed (calculated) binding energies.
processing of 500× 500 nm2AFM images obtained in tapping
mode with the Gwyddion software.47 The pristine surface exhibits a low surface roughness Ra = 0.23 nm. The Cu thin film shows an Raof 0.99 nm, i.e., greater than the initial surface,
yet still limited. A 500× 500 nm2AFM image of the Cufilm is
shown inFigure 3.
The morphology of thefilm is three dimensional and rough, with a peak to peak roughness Rz= 6.01 nm, and some darker
contrast holes that might point to uncovered substrate locations. Although the majority of the substrate is covered with Cu, we make sure that C 1s XPS spectra of the substrate/ film interface are still intense. With this buried interface method, we circumvent the problem of the exposure of the sample to air during its transfer from the evaporation chamber to the XPS chamber. Additionally, we determine that a 60 s mild sputtering (Ar+, 500 eV, 10μA) is adequate to get rid of
atmospheric contaminants and recover a pure Cu surface and the elements of the epoxy underneath. We thus monitor the Cu LMM shape and the C 1s and N 1s peaks’ shape and intensity. We do not measure the Cufilm thickness, but the large C 1s peak intensity indicates that it is well below 3 times the IMFP of electrons in Cu, i.e.,≪5.4−5.7 nm.
3.2. Identification of Cu-Adsorption Sites on Epoxy Polymer. The deposition of thin films with vapor phase deposition techniques mainly proceeds through an atom by atom mechanism (PVD) or can be simulated by an atom by atom process (CVD).56−58In the case of the deposition of Cu on several polymers, it is established that first atoms that adsorb on the surface undergo long distance surface diffusion (in the μm range sometimes!) before they stabilize. Once chemisorbed, they act as anchor points for the formation of Cu clusters, where the Cu−Cu interaction is favored at the expense of Cu−polymer surface atom interactions.59 This is also well supported by the absence of interfacial adhesion in these metal/polymer assemblies in practical applications.5,6,60 Therefore, a good practice in DFT calculations consists of evaluating the adsorption energies by optimizing the geometry of a molecule or a surface in close vicinity to an isolated atom. The limitations of modeling a surface with a representative molecule arise if one observes the deformation of the molecule around the metal atom. For instance, this is observed when a 4 atom cluster is used in the present work: the DGEBA−EDA molecule folds around the cluster, as a coordination complex would do (not shown). In this latter case, the molecular model is no longer relevant and should be replaced by a slab model, where the polymer“surface” is sufficiently cohesive to prevent strong deformation. Unfortunately, there is no surface model Table 1. Chemical Shifts,ΔBE (uGTS), Calculated for Each C 1s Orbital of the Model Dimer Identified by an ID and the Group to Which It Belongsa
model dimer poly-epoxy (2 DGEBA + 1 EDA)
orbital ID ΔBE (uGTS) (eV) functional groups number of C 1s orbitals relative composition (%)
C9 0.00 C*phenyl Cquaternaire 2 9.1 C15 0.02 C*phenyl Cquaternaire 2 C11 0.08 Cphenyl 2 36.4 C8 0.08 Cphenyl 2 C17 0.09 Cphenyl 2 C16 0.09 Cphenyl 2 C10 0.12 Cphenyl 2 C20 0.14 Cphenyl 2 C7 0.20 Cphenyl 2 C19 0.21 Cphenyl 2 C13 0.34 CH3 2 9.1 C14 0.35 CH3 2 C12 0.84 Cquaternaire 2 4.5 C2 1.12 C*H2 NH 2* 4.5 C1 1.30 C*H2 NH2 0 n/a C3 1.36 C(OH) C* NHC 4 9.1 C6 1.73 C*phenyl O CH2 C(OH) 2 9.1 C18 1.75 C*phenyl O CH2 Cepoxy 2 C4 2.13 C* O H 4 9.1 C5 2.21 Cphenyl O C*H2 C(OH) 4 9.1
C21 2.53 Cphenyl O C*H2 Cepoxy 0 n/a
C22 2.64 CHepoxy 0 n/a
C23 2.67 CH2epoxy 0 n/a
aThe two columns on the right show the number of orbitals and the corresponding relative composition in the stoichiometric mixture 2 DGEBA +
1 EDA used for samples’ synthesis. Lines C1, C21, C22, and C23 show irrelevant results for bonds that do not actually exist in the fully polymerized epoxies.
yet for most of the polymers in the state of the art; hence, the isolated atom in interaction with a molecular model of the surface remains the fairest option.
Before we simulate the XPS spectra for the metalized polymer, we try to identify the most favorable adsorption site(s) for Cu atoms, by calculating the adsorption energy (Eads), following the generaleq 3.
Eads=ECu/dimer −(ECu atom+Edimer) (3) where ECu/dimeris the total energy of the system with one Cu atom adsorbed on the dimer molecule, and ECu atomand Edimer
are the total energies of an isolated Cu atom and of the isolated free dimer, respectively.
The interaction energy (Eint) corresponds to the adsorption
energy (Eads), except when the dissociation of the O−H bond
occurs, leading to a dehydrogenated RO dimer radical (see
cases 2a and 2b, inTable 2). In this latter case,eq 4is used instead.
E E 1E E
2
ads= diss OH+ formation H2+ int (4)
corresponding to the thermodynamics path5.
RO H Cu RO H Cu RO 1 2H Cu RO Cu 1 2H E E E 1/2 2 2 diss OH form H2 int − + ⎯⎯⎯⎯⎯⎯→ + + ⎯⎯⎯⎯⎯⎯⎯⎯⎯⎯→ + + ⎯→⎯ − + (5)
Ediss OH equals 4.575 eV with B3LYP or 4.434 eV with PBE
functionals, respectively. The H2formation energy Eform H2
equals −4.760 or −4.547 eV with B3LYP and PBE. The interaction energy Eintis calculated as in6
Eint=ERO Cu− −(ECu atom+ ERO) (6) where ERO‑Cu is the total energy of the system with one Cu atom adsorbed on the RO dehydrogenated dimer molecule, and ECu atomand EROare the total energies of an isolated Cu atom and of the isolated free RO dehydrogenated dimer radical, respectively.
The results are shown inTable 2. All sites that are tested are found to be stable for the adsorption of Cu.
The three bottom configurations that evaluate interactions with the O27 atom show the largest adsorption energies. Case 1 assumes that the Cu atom is adsorbed on the oxygen O27
and that the hydrogen atom remains. Cases 2a and 2b, on the other hand, assume the departure of the hydrogen atom from O27. The interaction energy in case 1 corresponds to the adsorption energy of Cu (−1.802 eV with B3LYP and −3.222 eV with PBE). For case 2a, the interaction energy calculated with eq 6 equals −5.175 eV for B3LYP and −6.508 eV for PBE. For case 2b, the interaction energy is−3.938 eV for the B3LYP calculation and −4.897 eV for the PBE calculation. These values show that the interaction of the Cu atom is much stronger with the dehydrogenated RO dimer radical than with the ROH dimer. Following the mechanism presented ineq 5, the strongest adsorption energy is found for case 2a (Eads=
−2.980/−4.347 eV with B3LYP/PBE). It is worth noting that although the PBE functional predicts systematically larger adsorption energies, it reveals the same trend as the hybrid B3LYP functional. In addition, Eads reported here are not normalized by the bond numbers, which explains the somewhat large Eadsvalues.
The optimized geometries for cases 1, 2a, and 2b are presented inFigure 4(PBE calculations).
The Cu−O27 distances are 1.976/1.792/1.787 Å for cases 1/2a/2b, respectively. In case 1, the Cu atom is also bound to two carbon atoms of the phenyl ring (1.901 and 1.992 Å). In case 2a, the Cu atom is in interaction with two carbon atoms (C6 and C7) of the phenyl ring (1.909 and 1.965 Å) but also slightly with the O26 atom (distance Cu−O: 2.558 Å). For the last case (2b), the Cu atom is in interaction with O26 (distance Cu−O: 1.942 Å) and with C5 and C4 atoms (distance Cu−C: 2.423 and 2.306 Å, respectively). Therefore, the most favorable adsorption site is the O27 atom, preferably with the release of the H atom. In these cases, the Cu atom has a net charge of +0.34/+0.46e, i.e., it is oxidized. Unfortunately, the experimental methodology we use (interface burying, post mortem XPS + ion etching) does not allow the proper experimental monitoring of the Cu LMM Auger and Cu 2p peaks, where Cu oxidation is usually observed.48,49In our case, the proportion of bulk Cu within the nanometric thickness is Table 2. Adsorption Energies of the Cu Atom on the Native
or Dehydrogenated Dimer Moleculea
adsorption site Eadswith B3LYP Eadswith PBE
N 1.591 eV ( QCu= 0.14e) 2.593 eV (QCu= 0.13e) O26 1.022 eV (QCu= +0.01e) 2.007 eV (QCu= +0.03e) phenyl ring 1.428 eV (QCu= 0.09e) 2.867 eV (QCu= 0.08e)
O27 (in O27 H case 1) 1.802 eV
(QCu= +0.11e)
3.222 eV (QCu= +0.13e)
O27
(H is removed case 2a)
2.980 eV (QCu= +0.46e)
4.347 eV (QCu= +0.45e)
O27
(H is removed case 2b) 1.742 eV(QCu= +0.39e) 2.737 eV(QCu= +0.34e)
aQ
Cuis the Mulliken net charge on the Cu atom in the Cu/polymer
system.
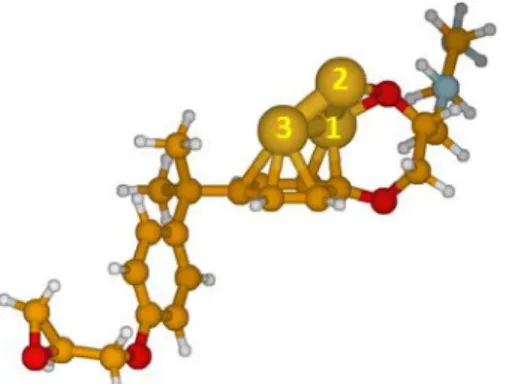
Figure 4.Representation of the optimized dimer configurations with Cu in the vicinity of the O10 atom, with H (1) and without H (2a and 2b). The larger (yellow) ball corresponds to the Cu atom.
largely superior to the proportion of interface Cu; hence, it is not possible to distinguish Cu−O contributions.
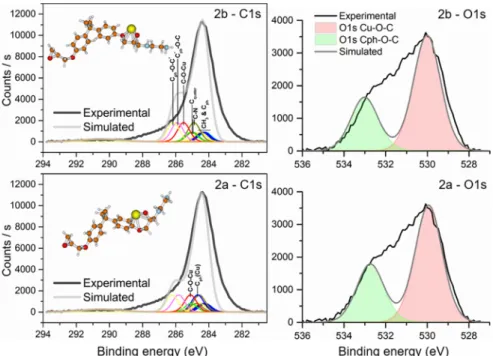
3.3. Cu−Polymer Surface Interactions as Evidenced from the Combined Theoretical and Experimental XPS Analysis. The 2a configuration corresponds to the strongest adsorption site for Cu. However, geometries 1, 2a, and 2b have been tested for further simulation of the XPS spectrum of the metalized surface to correlate with the experimental counter part. Case 1 calculations with a partial occupancy of the C 1s molecular orbitals do not converge or converge with unrealistic binding energy shifts, indicating either a numerical issue or an unstable configuration. Therefore, in the following, we present the results for cases 2a and 2b. Table 3 shows the chemical shifts calculated with the uGTS method in these two cases.
These computed data are used to build the simulated C 1s and O 1s spectra with the FWHM fixed at 0.9 and 1.6 eV, respectively. The resulting XPS decompositions are shown in
Figure 5.
Black lines represent the experimental envelopes and gray lines represent the simulated spectra. The XPS C 1s spectrum simulated in case 2a is closer to the experimental counterpart. The high BE shoulder is attenuated as compared to the 2b case. Two differences explain this change of the spectrum shape. First, the C−O−Cu contribution is shifted by ΔBE = 1.33 eV in 2a, whereas it is shifted byΔBE = 0.91eV only in 2b with regard to the reference BE(C*ph−Cquater). Second, a new
contribution denoted Cph(Cu) appears in 2a because of the strong interaction between the adsorbed Cu atom and the C atom of the phenyl group. These two shifts of the binding energy are responsible for the concomitant decrease of the shoulder intensity and increase of the main peak intensity. However, in both cases, the shoulder is much less intense than
on the pristine surface (Figure 2), where the C−OH bonds’ contribution is strong (ΔBE = 2.13 eV). This shift toward lower binding energies from the initial C−OH contribution to the final C−O−M (M = metal) contribution (such as 2a or 2b) has already been observed experimentally on a variety of polymers.14,61−63 But these works refer to in situ and sequential Cu depositions, unlike our case with the buried Cu/poly epoxy interface. The former methodology permits the monitoring of Cu LMM and Cu 2p spectra, further confirming the hypothesis for the Cu partial oxidation. When Cu is deposited on the PMDA−ODA polyimide surface,62,63 the initial C−OH contribution to the C 1s peak decreases to the benefit of a new contribution at lower BE, and a Cu+ valence
state is identified in the LMM Auger spectrum. The preferential interaction of Cu with the hydroxyl groups to form Cu−O−C bonds is further confirmed with a plasma pretreatment of the polyimide surface that increases strongly the concentration of hydroxyls and then the concentration of Cu−O−C (and Cu−N) bonds, a consequence being a large increase of the interfacial adherence.14
The simulation of the O 1s spectrum gives similar results for cases 2a and 2b. Two contributions to the peak are taken into account in the model dimer, either Cu−O−C or Cph−O−C.
ΔBE are found to be close: 3.00 eV in case 2a and 2.82 eV in case 2b, differences arising from the intensity of the interactions with the adsorbed Cu. The simulated spectra are then made of two distinct contributions that do not match the central part of the experimental O 1s peak. This is likely due to additional environments of O atoms that are not taken in the present model.
In the present work, it is clear from DFT calculations that hydroxyls are the preferential adsorption sites and that a dehydrogenation of the hydroxyl group proceeds simulta neously with the Cu oxidative adsorption. The XPS spectra are well reproduced with the formed Cu−O−C bonds; then, it may be the main chemical interaction at the Cu film/poly epoxy interface. Nevertheless, after the anchoring of thefirst atoms (Cu1) on hydroxyls, further Cu atoms aggregate on Cu1. Then, the Cu−O−C bond modeled in the present work is likely modified by the final coordination of the Cu1 atoms that share electrons with more Cu neighbors in the film. Hence, there is a possibility that charge transfers of Cu1 to O and C involved in the Cu−O−C bonds are slightly different from the one simulated with the single Cu atom DFT method, and that chemical shifts of O 1s and C 1s may be slightly different for the film. To test this mechanism further, we optimizefinal geometries 2a and 2b with 1 additional Cu atom, and obtain a final 2 Cu geometry. On this latter geometry, a third atom is placed in the vicinity of a Cu−Cu bridge position, and the geometry is optimized again to obtain the 3 Cu geometry. Then, a Cu atom is placed in the vicinity of the three fold Cu hollow site, and the geometry is again optimized to obtain the 4 Cu geometry. In 2 Cu, 3 Cu, and 4 Cu optimizations, the DGEBA−EDA atoms’ positions are fixed to mimic a surface, and prevent the folding of the molecule around the Cu cluster. At the end, we obtain 8 stable n Cu/ poly epoxy configurations (1 < n < 4), on which we determine net charges of Cu atoms involved in the Cu−O−C bond. Net charges and optimized geometries are shown in Supporting Information. It appears that the charge on the first chemisorbed Cu atom (QCu1) is modified, following: QCu1(1
Cu) = +0.45e, QCu1(2 Cu) = +0.38e, QCu1(3 Cu) = +0.29e, et QCu1(4 Cu) = 0.16e. In cases 3 Cu and 4 Cu, another Cu atom
Table 3. O 1s and C 1s Binding Energy Shifts (ΔBE) Derived from uGTS Calculations for the Adsorption of the Cu Atom on the Dimer in Cases 2a and 2b and Functional Group to which the Atom of Interest (See Asterisk) Belongs
ΔBE (uGTS) (eV) BE (uGTS) (eV)
case 2a case 2b functional groups
0.00 0.00 C O* Cu 3.00 2.82 Cphenyl O* CH2 C(OCu) 0.00 0.00 C*phenyl Cquaternaire 0.01 0.02 C*phenyl Cquaternaire 0.01 0.06 Cphenyl 0.01 0.07 Cphenyl 0.08 0.08 Cphenyl 0.09 0.11 Cphenyl 0.14 0.11 Cphenyl 0.15 0.15 Cphenyl 0.21 0.19 Cphenyl 0.33 0.19 Cphenyl 0.35 0.34 CH3 0.38 0.34 CH3 0.48 0.70 C(OCu) C* NHC 0.57 0.79 C*H2 NH 0.82 0.85 Cquaternaire 0.91 1.33 C* O Cu 1.63 1.71 C*phenyl O CH2 C(OCu) 1.70 1.73 C*phenyl O CH2 Cepoxy 2.02 1.95 Cphenyl O C* C(OCu) 2.46 2.51 Cphenyl O C*
donates electrons, resulting in QCu1(3 Cu) + ∑Qneighbor =
+0.35e et QCu1(4 Cu) + ∑Qneighbor = +0.46e. Therefore, whereas there is a slight change due to neighboring Cu atoms, the total charge transfer to O27 remains similar (−0.15e < ΔQO27 < −0.21e). Therefore, chemical shifts calculated by
uGTS on the 1 Cu/poly epoxy system are valid to simulate the XPS spectra of thefilm/poly epoxy.
4. CONCLUSIONS
These DFT uGTS calculations on the DGEBA−EDA system confirm and improve our previous XPS simulations in the framework of Hartree−Fock ΔSCF calculations.36 Interest ingly, this methodology improves the accuracy of the description of the C 1s peak by allowing afine decomposition with 8 components, unlike the standard empirical method that may include three contributions only. The evaporation of Cu leads to the formation of a covering thinfilm of about 5.5 nm thickness, therefore to the formation of a buried Cu/epoxy interface that can be probed by XPS. The XPS peaks arising from the interface are strongly modified as compared to the clean surface with the disappearance of the high BE C−O shoulder on C 1s, and the appearance of a metal oxide contribution on O 1s. These are first hints indicating the preferential interaction of Cu with oxygen. DFT is then used to check this hypothesis by adsorbing a Cu atom on different sites of the dimer molecule and to calculate adsorption energies. The three most stable adsorption sites are found on the hydroxyl group, with or without the H atom removal. XPS is then simulated in these configurations. It shows that the charge transfer from the Cu atom to the atoms involved in the chemisorption shifts the initial C−OH component of the pristine surface toward a lower BE for the new C−O−Cu bond, and new components are created such as Cph(Cu) that further modify the spectrum shape. For O 1s, two distinct molecular orbital energies are found: one for the organic O atoms of the Cph−O−C chain fragment and one for the newly formed Cu−O−C bonds.
The metallization of polymers has been studied for quite a long time, originally driven by the microelectronic develop ment. In these times, a lot of knowledge has been acquired concerning the formation of metal thin films, including first steps, such as adsorption, nucleation, and growth. Never theless, while experimental evidence seems to converge, there are a limited number of theoretical studies to support and better explain the atomistic mechanisms involved. To that purpose, the major contributions of the present work are as follows:
• a substantial improvement of the decomposition of the XPS spectra as compared to purely experimental methods, with a DFT method that takes initial and final state effects and that has never been applied on such a big molecule.
• the identification of preferential adsorption sites for the first Cu atoms impinging and diffusing on the surface. Our calculations/experimental results match with the following scenario. Cu atoms interact preferentially with C−OH sites to form Cu−O−C bonds. These bonds are stabilized by a transfer of approximately 0.5 electrons from Cu to O; hence, Cu is partially oxidized.
• a fair decomposition of the Cu/epoxy C 1s and O 1s spectra that is only rendered possible by the determination of ΔBEs through DFT. Without calcu lations, bonds’ details are hidden in the broad C 1s peak with no possibility to decipher these.
• a theoretical/experimental support for a nucleation− aggregation scenario of the Cu thin film. In this assumption,first Cu atoms diffuse until they chemisorb, then additional atoms aggregate on these anchor points, and growth proceeds via a Wolmer−Weber mode.
■
ASSOCIATED CONTENT*
Supporting InformationThe Supporting Information is available free of charge at
https://pubs.acs.org/doi/10.1021/acs.jpcc.9b07772.
Figure 5.Simulated XPS spectra using the uGTS theory. Both correspond to an oxidative adsorption of the Cu atom on the polymer (case 2). Top: the Cu atom is away from the phenyl (2b). Bottom: the Cu atom is close to the phenyl (2a). Hydrogen atoms are not shown.
photoelectron binding energies and chemical shifts. J. Electron Spectrosc. Relat. Phenom. 1999, 104, 195−207.
(29) Travaly, Y.; Vanderbilt, D.; Gonze, X. Calculation of C 1s core level shifts in poly(ethylene terephthalate) and comparison with x ray photoelectron spectroscopy. Phys. Rev. B: Condens. Matter Mater. Phys. 2000, 61, 7716−7721.
(30) Haerle, R.; Riedo, E.; Pasquarello, A.; Baldereschi, A. sp2/sp3 hybridization ratio in amorphous carbon from C 1s core level shifts: X ray photoelectron spectroscopy and first principles calculation. Phys. Rev. B: Condens. Matter Mater. Phys. 2001, 65, No. 045101.
(31) Takahata, Y.; Chong, D. P. DFT calculation of core electron binding energies. J. Electron Spectrosc. Relat. Phenom. 2003, 133, 69− 76.
(32) Endo, K.; Shimada, S.; Ida, T.; Suhara, M.; Kurmaev, E. Z.; Moewes, A.; Chong, D. P. Theoretical X ray photoelectron and emission spectra of Si and S containing polymers by density functional theory calculations using model molecules. J. Mol. Struct. 2001, 561, 17−28.
(33) Bureau, C.; Chong, D. P.; Lecayon, G.; Delhalle, J. Accurate density functional calculation of core electron binding energies. 5. Application to nitriles. Model molecules for polyacrylonitrile revisited. J. Electron Spectrosc. Relat. Phenom. 1997, 83, 227−234.
(34) Bagus, P. S.; Ilton, E. S.; Nelin, C. J. The interpretation of XPS spectra: Insights into materials properties. Surf. Sci. Rep. 2013, 68, 273−304.
(35) Duguet, T.; Bessaguet, C.; Aufray, M.; Esvan, J.; Charvillat, C.; Vahlas, C.; Lacaze Dufaure, C. Toward a computational and experimental model of a poly epoxy surface. Appl. Surf. Sci. 2015, 324, 605−611.
(36) Gavrielides, A.; Duguet, T.; Esvan, J.; Lacaze Dufaure, C.; Bagus, P. S. A poly epoxy surface explored by Hartree FockΔSCF simulations of C 1s XPS spectra. J. Chem. Phys. 2016, 145, No. 074703.
(37) Ziegler, T.; Rauk, A.; Baerends, E. J. On the calculation of multiplet energies by the hartree fock slater method. Theor. Chim. Acta 1977, 43, 261−271.
(38) Slater, J. C. The Theory of Complex Spectra. Phys. Rev. 1929, 34, 1293−1322.
(39) Williams, A. R.; deGroot, R. A.; Sommers, C. B. Generalization of Slater’s transition state concept. J. Chem. Phys. 1975, 63, 628−631. (40) Chong, D. P. Accurate calculation of core electron binding energies by the density functional method. Chem. Phys. Lett. 1995, 232, 486−490.
(41) Chong, D. P.; Hu, C. H.; Duffy, P. Accurate density functional calculation of core electron binding energies with a scaled polarized triple zeta basis set. Twelve test cases and application to three C2H4O2 isomers. Chem. Phys. Lett. 1996, 249, 491−495.
(42) Endo, K.; Maeda, S.; Kaneda, Y. Analysis of C 1s spectra of N , O , and X containing polymers in X ray photoelectron spectroscopy by ab initio molecular orbital calculations using model molecules. Polym. J. 1997, 29, 255−260.
(43) Endo, K.; Maeda, S.; Aida, M. Simulation of C 1s Spectra of C and O Containing Polymers in XPS by ab initio MO calculations using model oligomers. Polym. J. 1997, 29, 171−181.
(44) Endo, K.; Ida, T.; Shimada, S.; Ortiz, J. V.; Deguchi, K.; Shimizu, T.; Yamada, K. Valence XPS, IR, and C13 NMR spectral analysis of 6 polymers by quantum chemical calculations. J. Mol. Struct. 2012, 1027, 20−30.
(45) Endo, K.; Shimada, S.; Ida, T.; Suhara, M.; Kurmaev, E. Z.; Moewes, A.; Chong, D. P. Theoretical X ray photoelectron and emission spectra of Si and S containing polymers by density functional theory calculations using model molecules. J. Mol. Struct. 2001, 561, 17−28.
(46) Biesinger, M. C.; Lau, L. W. M.; Gerson, A. R.; Smart, R. S. C. Resolving surface chemical states in XPS analysis of first row transition metals, oxides and hydroxides: Sc, Ti, V, Cu and Zn. Appl. Surf. Sci. 2010, 257, 887−898.
(47) Nečas, D.; Klapetek, P. Gwyddion: an open source software for SPM data analysis. Open Phys. 2012, 10, 181−188.
(48) Frisch, M. J.; Trucks, G. W.; Schlegel, H. B.; Scuseria, G. E.; Robb, M. A.; Cheeseman, J. R.; Scalmani, G.; Barone, V.; Petersson, G. A.; Nakatsuji, H.; et al. Gaussian 09, revision A.02; Gaussian, Inc.: Wallinford, CT, 2016.
(49) Lee, C.; Yang, W.; Parr, R. G. Development of the Colle Salvetti correlation energy formula into a functional of the electron density. Phys. Rev. B: Condens. Matter Mater. Phys. 1988, 37, 785−789. (50) Becke, A. D. Density functional thermochemistry. III. The role of exact exchange. J. Chem. Phys. 1993, 98, 5648−5652.
(51) Perdew, J. P.; Burke, K.; Ernzerhof, M. Generalized gradient approximation made simple. Phys. Rev. Lett. 1996, 77, 3865−3868.
(52) Koster, A. M.; Geudtner, G.; Alvarez Ibarra, A.; Calaminici, P.; Casida, M. E.; Carmona Espindola, J.; Dominguez, V. D.; Flores Moreno, R.; Gamboa, G. U.; Goursot, A.; et al. deMon2k, version 4, The deMon developers; Cinvestav: Mexico City, 2016.
(53) Calaminici, P.; Janetzko, F.; Köster, A. M.; Mejia Olvera, R.; Zuniga Gutierrez, B. Density functional theory optimized basis sets for gradient corrected functionals: 3d transition metal systems. J. Chem. Phys. 2007, 126, No. 044108.
(54) Flores Moreno, R.; Alvarez Mendez, R. J.; Vela, A.; Köster, A. M. Half numerical evaluation of pseudopotential integrals. J. Comput. Chem. 2006, 27, 1009−1019.
(55) Dunning Thom, H., Jr. Gaussian basis sets for use in correlated molecular calculations. I. The atoms boron through neon and hydrogen. J. Chem. Phys. 1989, 90, 1007−1023.
(56) Psarellis, G. M.; Aviziotis, I. G.; Duguet, T.; Vahlas, C.; Koronaki, E. D.; Boudouvis, A. G. Investigation of reaction mechanisms in the chemical vapor deposition of al from DMEAA. Chem. Eng. Sci. 2018, 177, 464−470.
(57) Aviziotis, I. G.; Duguet, T.; Vahlas, C.; Boudouvis, A. G. Combined macro/nanoscale investigation of the chemical vapor deposition of Fe from Fe(CO)5. Adv. Mater. Interfaces 2017, 4, No. 1601185.
(58) Aviziotis, I. G.; Cheimarios, N.; Duguet, T.; Vahlas, C.; Boudouvis, A. G. Multiscale modeling and experimental analysis of chemical vapor deposited aluminum films: Linking reactor operating conditions with roughness evolution. Chem. Eng. Sci. 2016, 155, 449− 458.
(59) Faupel, F.; Zaporojtchenko, V.; Thran, A.; Strunskus, T.; Kiene, M. Metal Diffusion in Polymers and on Polymer Surfaces. In Diffusion Processes in Advanced Technological Materials; Gupta, D., Ed.; Springer: Berlin, Heidelberg, 2005; pp 333−363.
(60) Zhang, A.; Addou, F.; Duguet, T.; Caussé, N.; Vahlas, C. Adaptation of a dry metalorganic chemical vapor deposition metallization process to a wet chemical pretreatment of polymers. J. Vac. Sci. Technol., A 2017, 35, No. 061101.
(61) Bébin, P.; Prud’homme, R. E. Comparative XPS study of copper, nickel, and aluminum coatings on polymer surfaces. Chem. Mater. 2003, 15, 965−973.
(62) Haight, R.; White, R. C.; Silverman, B. D.; Ho, P. S. Complex formation and growth at the Cr− and Cu−polyimide interface. J. Vac. Sci. Technol., A 1988, 6, 2188−2199.
(63) Pertsin, A. J.; Pashunin, Y. M. An XPS study of the in situ formation of the polyimide/copper interface. Appl. Surf. Sci. 1991, 47, 115−125.
Supplementary Information (SI)
DFT Simulation of XPS Reveals Cu/ Epoxy Polymer Interfacial Bonding
Thomas Duguet
*, Andreas Gavrielides, Jérôme Esvan, and Corinne Lacaze-Dufaure
CIRIMAT, Université de Toulouse, CNRS–INPT–UPS, 4 Allée Emile Monso, BP
44362,31030 Toulouse, France
Tzonka Mineva
Institut Charles Gerhardt, CNRS–Université de Montpellier, 240 Avenue du Pr. Émile
Jeanbrau, 34090 Montpellier, France
*Author to whom correspondence should be addressed: Email:
[email protected]
,
Phone: +33 534 323 439
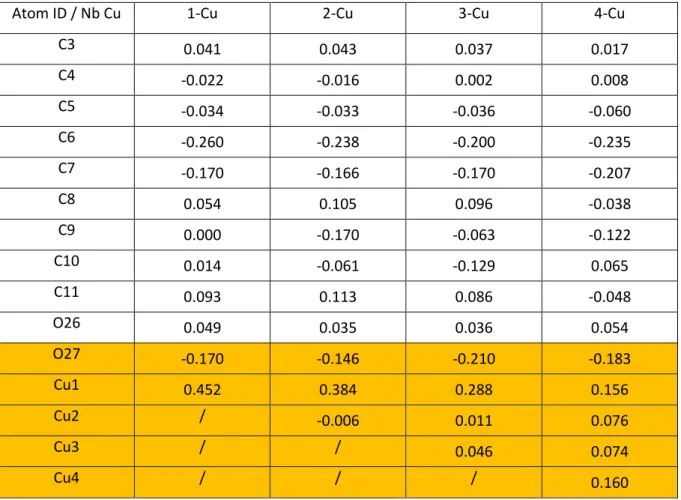
Table S1. Mulliken net charges variations (∆QX in e) for relevant atoms (most stable Cu/epoxy geometries). For numbering, see Figures S1-5. ∆QX = QX(R-OCu)-QX(R-O), where R-O is the DGEBA-EDA dimer with one dehydrogenated hydroxyl group.
Atom ID / Nb Cu 1-Cu 2-Cu 3-Cu 4-Cu
C3 0.041 0.043 0.037 0.017 C4 -0.022 -0.016 0.002 0.008 C5 -0.034 -0.033 -0.036 -0.060 C6 -0.260 -0.238 -0.200 -0.235 C7 -0.170 -0.166 -0.170 -0.207 C8 0.054 0.105 0.096 -0.038 C9 0.000 -0.170 -0.063 -0.122 C10 0.014 -0.061 -0.129 0.065 C11 0.093 0.113 0.086 -0.048 O26 0.049 0.035 0.036 0.054 O27 -0.170 -0.146 -0.210 -0.183 Cu1 0.452 0.384 0.288 0.156 Cu2 / -0.006 0.011 0.076 Cu3 / / 0.046 0.074 Cu4 / / / 0.160
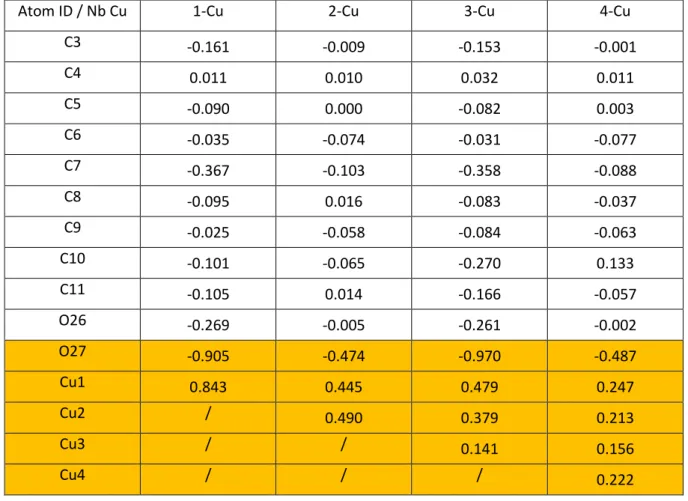
Table S2. NBO net charges variations (∆QX in e) for relevant atoms (most stable Cu/epoxy geometries). For numbering, see Figures S1-5. ∆QX = QX(R-OCu)-QX(R-O), where R-O is the DGEBA-EDA dimer with one dehydrogenated hydroxyl group.
Atom ID / Nb Cu 1-Cu 2-Cu 3-Cu 4-Cu
C3 -0.161 -0.009 -0.153 -0.001 C4 0.011 0.010 0.032 0.011 C5 -0.090 0.000 -0.082 0.003 C6 -0.035 -0.074 -0.031 -0.077 C7 -0.367 -0.103 -0.358 -0.088 C8 -0.095 0.016 -0.083 -0.037 C9 -0.025 -0.058 -0.084 -0.063 C10 -0.101 -0.065 -0.270 0.133 C11 -0.105 0.014 -0.166 -0.057 O26 -0.269 -0.005 -0.261 -0.002 O27 -0.905 -0.474 -0.970 -0.487 Cu1 0.843 0.445 0.479 0.247 Cu2 / 0.490 0.379 0.213 Cu3 / / 0.141 0.156 Cu4 / / / 0.222
Figure S1. Most stable optimized geometry for the DGEBA-EDA model.
Figure S2. Most stable optimized geometry for the adsorption of 1 Cu atom on the DGEBA-EDA model.
Figure S3. Most stable optimized geometry for the adsorption of 2 Cu atoms on the DGEBA-EDA model.
Figure S4. Most stable optimized geometry for the adsorption of 3 Cu atoms on the DGEBA-EDA model.
Figure S5. Most stable optimized geometries for the adsorption of 4 Cu atoms on the DGEBA-EDA model.