an author's https://oatao.univ-toulouse.fr/22767
Pant, Vatsal and Demmou, Hamid and Chaudemar, Jean-Charles Safety Analysis of Pilot-System Interaction. (2018) In: 12th International Conference on MOdeling, Optimization and SIMulation (MOSIM18), 27 June 2018 - 29 June 2018 (Toulouse, France).
”The rise of connected systems in industry and services”
Safety Analysis of Pilot-System Interaction
Vatsal PANT, Jean-Charles CHAUDEMAR Hamid DEMMOU
ISAE-SUPAERO LAAS-CNRS, Universit´e de Toulouse, CNRS, UPS
Toulouse - France Toulouse - France
[email protected], [email protected] [email protected]
ABSTRACT: This paper presents on-going work in the scope of development of a new methodology of safety analysis taking into account pilot’s behavior. The initial part of the research deals with understanding pilot error and to model his behavior against required tasks. The paper presents the methodology and the tool developed for this purpose.
KEYWORDS: STAMP, STPA, MBSE, MBSA, Process Model, Flight Control, Safety
1 INTRODUCTION
Flight travel has become safer and safer over the years thanks to the various state-of-the-art technolo-gies used in design and development of the aircraft (Clinton V. Oster Jr. 2013). But, the human error as cause of accident still remains at the same ratio. It was shown in a research by 1 the cause of human er-ror due to bad decision making amounts to around 25 percent (Wiegmann & Shappell 2011). Researchers are trying to study what more (or in some case -less) information should be given to the pilot in or-der to improve his decision making and reduce any chances of error. Our research has the same objec-tive, i.e, to provide the pilot with information about what might go wrong based on the current situation he is in. For example, based on the descend trend at a particular instant, an automated analysis is per-formed and then the pilot is inper-formed of the possible hazardous situation he might enter into. In this pro-cess, the time is of the utmost importance in order to perform a possible corrective maneuver. One of our objectives in this study is to develop a safety analysis method that takes into account pilot’s task behavior. To do this a new hazard analysis technique devel-oped in MIT, USA called STAMP-STPA has been used (Leveson 2011).
The paper presents this new hazard analysis process
in the second section. Third section explains the
methodology used to meet that objective. Fourth sec-tions details about modeling the pilot task behavior, moving on to the fifth section where the use of ADS-B data in our project has been described. The follow-ing section introduces the tool developed for carryfollow-ing out the aforementioned analysis. Some results and conclusions are presented at the end.
2 STAMP and STPA
This section defines the STAMP process model, the hazard analysis process based on STAMP called STPA, and a brief introduction to use STPA.
System Theoretic Accident Modeling Processes
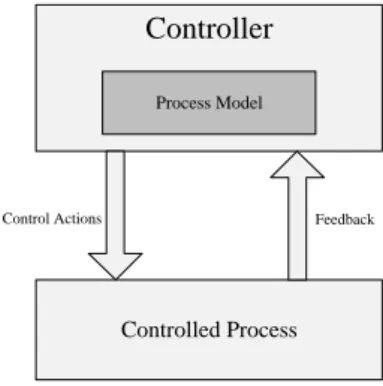
(STAMP) is a methodology used to model a system and/or a process. It is based on the concepts of Sys-tems Engineering and Control Theory. The model-ing is done on the base of functional structure rather than the physical component structure. The entire process is classified in different level of complexities starting from the most complex at the top and then going down to the least complex at the bottom. This complexity corresponds to the functions performed at each level. Each level has a controller and a process as shown in Figure 1. Each controller gives some control actions as input to the process and receives feedback from the process. (Thomas 2017)
Controller
Controlled Process
Process Model
Control Actions Feedback
Figure 1 – Control based STAMP model
According to this modeling, an associated definition of failure is proposed, thus failure is defined as loss
MOSIM18 - June 27-29, 2018 - Toulouse - France
of control since the focus is on early functional archi-tecture instead of physical one. The basic ideology is that there have been incidents in the past where nei-ther components failed nor humans made error yet accidents occured (Nancy Leveson & Marais 2003). Another useful concept in safety is the hazardous con-dition depicting the result of a failure in the STAMP framework.
Moreover, STAMP offers a collection of processes, in-cluding a System Theoretic Process Analysis (STPA), which is of interest for our study. STPA is a top-down method that makes use of a control structure. It is performed in following two steps (Leveson & Thomas 2013) :
• Define Accidents and Hazards (associated with these accidents) and obtain loss of control that can lead to a hazardous state
• Identify how these unsafe control actions could oc-cur in the control structure.
Unsafe Control Actions (UCA) are the commands given by the controller to the process that can result in a hazardous situation. UCA is defined as:
Context + ControlAction + Hazard
Here, Context is defined as the scenario or condition or constraint that helps us in assigning safe or unsafe nature to a control action (Thomas 2013). For exam-ple, one can imagine that the pilot lowers the landing gear, this is a control action but it becomes an unsafe control action if it is lowered at a high speed and at a high altitude, as it increases the drag on the aircraft and it becomes even more critical if there is a criti-cal situation like fuel starvation. This might result in stall. Hence it is very important to carefully consider the context.
According to STPA there are four types of possible unsafe control actions:
• Providing a control action will cause a hazard. In this case, the control action may be tagged as ”inappropriate”.
• Not providing a control action will cause a hazard. This is the absence of a required control action. • Providing it too early/too late will cause a hazard. The focus is on the time at which a control action is provided.
• Providing it for too long or stopping it too soon will cause a hazard (this is more applicable when
the input is continuous). The focus is on the
duration of the control action.
Given these STAMP and STPA concepts, our study relates to an original approach enabling to extend STPA analysis for on-line safety analysis.
3 PROPOSED METHODOLOGY
This section defines the approach used in order to integrate the concept of unsafe control actions with safety analysis.
As aforementioned, the UCA concept becomes a cen-tral component of our methodology, which requires to formalize it. For that, a formal tabular specification (Russo, Miller, Nuseibeh & Kramer 2000) is used to
define the unsafe control action ucaij, such as for any
i, j :
ucaij = < Ci, U Cj, uij>
where:
• C represents the Context, i.e. the current
state variables characterizing the system
behav-ior with its given environment; then, Ci is the
ith element of this list of context.
• U C stands for the type of the control action as defined in STAMP; we assume there are 6 types as described below.
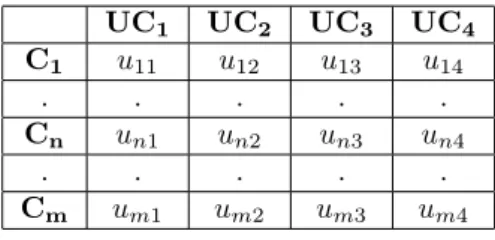
• u corresponds to the textual description of the hazard of the concerned unsafe control action; i, j is for the posiion of the cell in the table. An illustration of STPA table structure is shown in table 1, where n > m. UC1 UC2 UC3 UC4 C1 u11 u12 u13 u14 . . . . . Cn un1 un2 un3 un4 . . . . . Cm um1 um2 um3 um4
Table 1 – Unsafe Control Actions table
On the one hand, this UCA table structure implic-itly reveals a time characteristic for a control action (noted ca, later on). Let be t0 the starting time whose discrete value belongs to ok, +, −, ∞, ok is the appro-priate time, + too late time, - too early, and ∞ for absence of ca . Similarly, td the duration whose value belongs to ok, +, −, ok is the appropriate duration, + too long, and - too short.
On the other hand, the types of UCA 3 and 4 are split hereafter, since their description states two distinct features. Therefore, the type rearrangement is given as follows:
• U C1: for providing ca which is inappropriate, noted uca(t0 = ok, td = ok).
• U C2: for absence of ca, noted ca(t0 = ∞, td =
ok).
• U C3: for providing ca too early, noted ca(t0 =
−, td = ok).
• U C4: for providingca too late, noted ca(t0 =
+, td = ok).
• U C5: for stopping ca too soon, noted ca(t0 =
ok, td = −).
• U C6: for a long duration of ca, noted ca(t0 =
ok, td = +).
Contrary to the UCA types, the Context relies on ac-tual data extracting from aircraft acac-tual behavior. To be relevant, these data are given by actual records of several flights, in approach phase for our study case. The process using this data base is described here-after.
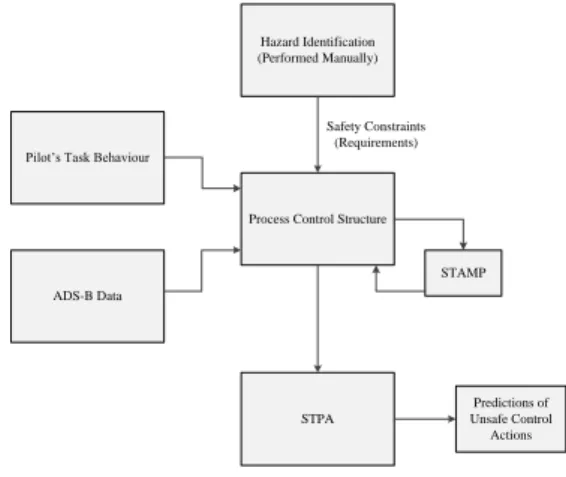
Figure 2 explains the proecess of our study.
Pilot’s Task Behaviour
ADS-B Data
Process Control Structure Hazard Identification (Performed Manually) STAMP STPA Predictions of Unsafe Control Actions Safety Constraints (Requirements) Figure 2 – Methodology
Our proposed methodology deals with studying a very critical phase of a flight, e.g. approach phase. This methodology consists of several steps depicted as fol-lows:
Step1 : To build an initial STPA table in order to obtain control actions.
Step2 : To collect data in order to understand how pilot actually perform successful approaches. To do this, ADS-B was used.
Step3 : To develop and use a tool that takes current position of the aircraft and improves STPA anal-ysis in order to list unsafe control actions that a pilot might give.
As far as the prediction of UCA is concerned, STPA table and the ADS-B data base are necessary for the tool to be developed, however the performance of the prediction would actually be improved if we are able to add a model of pilot tasks, which reduces the number of possible irrelevant unsafe control ac-tions. For multiple failure, we assume for instance
that an U CA4 can not be immediately followed by
an U CA3, thus, the time analysis is taken into
ac-count (Bruggemann & Campbell 2017).
The next section shows an ideal pilot task model that we would like to generate automatically from the STPA table, ADS-B and official procedures.
4 MODELLING PILOT TASK
BE-HAVIOUR
The first part of the research deals with model-ing the behavior of pilot in response to tasks that he/she has to perform. To be able to do that the available manuscripts that aid pilot in training and subsequently performing certain tasks, e.g., FCTM,
FCOM, and SOPs are used. (To be noted that
these are not the official documents from aircraft
manufacturers but the ones available online. ref:
www.airbusdriver.net) Since our study is based on one of the most critical phase of flight, i.e., approach and landing, we will, for the moment, look only at those actions that will be performed during this phase. Figure 3 gives an idea of the task performed during approach phase.
Flaps at Initial Setting
Localizer + Glidescope Capture Gear Down Flaps Full Landing Checklist Stable Approach Decision Height (Continue/Go Around Decision)
Flare and Touch Down
Figure 3 – Approach Procedure
These tasks are to be performed by the pilots at cer-tain altitude, speed and at required distance from the Touch Down Zone. It can be seen that these tasks correspond to some actions that the pilots have to perform. Each time they perform these tasks they need to make certain decisions based on current state of the aircraft, environmental conditions and other external factors (like Air Traffic Controllers
instruc-MOSIM18 - June 27-29, 2018 - Toulouse - France
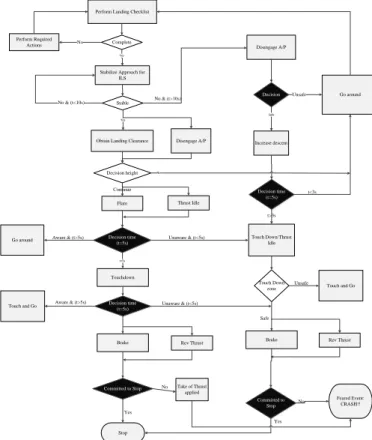
tions). We tried to study the hazardous conditions that might exist and based on it we constructed a flowchart (Figure 4). This flowchart enables us to im-prove STPA analysis by providing important control actions. It also gives some idea on some decisions that the pilots make based on their mental model (expere-ince, fatigue, stress level, etc.). These are different from the actions he performs based on the prescribed procedures. We call these two type of decisions as procedure based decisions (represented in Figure 4 as white diamonds) and human factors based decisions (represented as black diamonds)
Perform Landing Checklist
Complete
Stabilize Approach for ILS
Yes
Stable
Yes
Obtain Landing Clearance
Decision height Flare Decision time (t=5s) Touchdown t<5s Decision time (t=5s) Brake Thrust Idle Committed to Stop Yes Rev Thrust Disengage A/P No & (t>10s) Decision Increase descent Safe Decision time (t=5s) Touch Down/Thrust Idle t>3s Touch Down zone Go around Unsafe t<3s Touch and Go Unsafe Safe Committed to Stop
Brake Rev Thrust Disengage A/P No Yes Perform Required Actions No No & (t<10s) No Continue
Go around Aware & (t>5s) Unaware & (t<5s)
Touch and Go Aware & (t>5s) Unaware & (t<5s)
Take of Thrust applied No Stop Feared Event: CRASH!!
Figure 4 – Pilot Task Flowchart
Based on this model we obtain control actions that we use next. The next section gets an insight into the utilization of ADS-B for actual pilot behavior.
5 ADS-B DATA
ADS-B stands for Automated Dependent Surveillance - Broadcast, it is a technology that helps an aircraft obtain its position based on satellite navigation and broadcasts it. This allows ground based receivers to track an aircraft. This is very useful for ATC and other aircraft to know exact position of other air-craft in order to maintain safe separation. The ADS-B data packet contain information about the track, ground speed, call-sign (it is a type of aircraft iden-tifier) and position of the aircraft. ADS-B data help on-line flight tracking platforms to track air traffic in
real time.
We have used the data from various approach pat-terns of Airbus A320 aircraft in Toulouse, Blagnac airport (ICAO: LFBO). We extract data that enables us to understand how diferent pilots react in certain situations while performing the required task. This was done by studying how the speed and altitude changes with time (Figure 5).
1.5133193 1.5133194 1.5133195 1.5133196
TimeStamp (seconds from a specific date) ×109 0 1000 2000 3000 Feet Altitude vs TimeStamp 1.5133193 1.5133194 1.5133195 1.5133196
TimeStamp (seconds from a specific date) ×109 120 140 160 180 Knots Speed vs TimeStamp
Figure 5 – Altitude and Speed vs Time Studying these graphs over a wide range of data will provide us an understanding of the normal trends of altitude and speed change for successful landings that might help us define our safety margin.
Another interesting plot that was extracted was Al-titude vs Speed. This was particularly interesting as this eliminated time variable. Since not all pilot per-form similar actions at same time, it is interesting to find a way to find a common performance graph.
0 50 100 150 200 250 300 350 400 450
Speed (in knots)
0 0.5 1 1.5 2 2.5 3
Altitude (in feet)
×104 Altitude vs Speed
Figure 6 – Altitude vs Speed
Figure 6 shows an example Altitude vs Speed graph. It is normal to have an approach curve like this, it should not be confused with unstable flight as the
curve doesn’t represent the actual position of the air-craft. It shows the trends in altitude and speed. Some sudden spikes and drops in the curves arise mainly due to missing data or some changes that occur due to operational reasons like extension of landing gears, etc.
6 INTRODUCTION TO THE TOOL
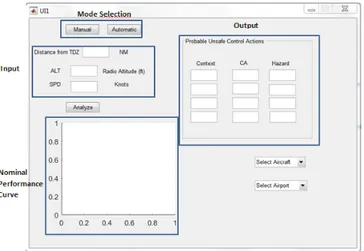
The authors decided to develop a tool that can au-tomatically perform the analysis. MATLAB based GUIDE (Graphical User Interface Development En-vironment) is used to build this tool. The tool takes ADS-B data as the input and predicts unsafe control actions. It also plots an altitude vs speed diagram of the approach in order to compare it to safe ap-proach patterns. Figure 7 shows the layout of the
tool. It has a mode selection switch that decides
whether data will be taken automatically or must be entered manually. There is an input box that allows data to be entered manually. The output box presents results from the analysis. And the nominal perfor-mance curve plots the fitted curve based on the data points that are input.
Figure 7 – Screenshot of the Tool The tool carries out following tasks.
• Taking position, speed and heading values from ADS-B receiver and importing it in a .csv file (done in ”Automatic” mode). This can also be input manually by selecting ”Manual” from the Mode Selection Switch.
• Plot a nominal approach Altitude vs. Speed curve for a particular aircraft type and a particular air-port. It is done in the ”Nominal Performance Curve”.
• Based on the values of Altitude and Speed assume which step of procedure the pilot will perform next. Compare the current action to actions in
future and list down possible unsafe control ac-tions in the output box.
In order to performance the analysis following steps are performed:
• Define the nominal approach curve based on the values obtained from ADS-B data.
• Select a point for which we want to study the sce-nario, or perform our analysis. This is crucial as the aircraft is constantly moving instead of performing the analysis every second it might be interesting to do it over a time zone for which the conditions remain same, and change it over to the next zone as soon as it passes to the next scenario.
• We use data from the aircraft to obtain a safety margin. This is obtained by plotting all the safe landings over a period of time and then based on extreme points making a safe envelope.
• Calculate the distance of our selected point from the safety margin.
• Based on this distance define the context for unsafe control action (e.g., Low/high speed (if the speed difference is too much) and same for altitude). It is done by obtaining the factor (altitude or speed) that is farthest from the safe margin and use that as ”critical” because it will be difficult to achieve.
• Based on the context and current position populate the list of unsafe control action on the tool.
7 RESULTS
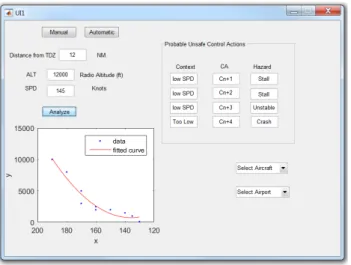
Once all the Unsafe Control Actions were defined, they were entered in the tool for analysis of an aircraft in real time. The tool provides us with results in the
output box in ucaij = < Ci, U Cj, uij > format. For
example in Figure 8, based on current altitude and speed performing the next control action will result in stall due to increase drag. Here the context is low speed and the corresponding hazard is Stall.
MOSIM18 - June 27-29, 2018 - Toulouse - France
Figure 8 – An output on the Tool
It can be seen that the safety margin is obtained as an envelope and is presented in dotted lines in Figure 9. 0 50 100 150 200 250 300 350 Speed (knots) 2000 4000 6000 8000 10000 Altitude (feet) Altitude vs Speed
Figure 9 – Safety Margin
8 CONCLUSION AND FUTURE SCOPE
This tool was necessary to better visualize the study for ourselves and to be able to distribute as a stand-alone application to Engineers and pilots to collect data and have their feedback. As mentioned the tool is in the preliminary stage although it can perform some analysis at this level too. A mid-term progress would be to perform some real time tests on sim-ulator to evaluate the performance of the tool and to improve it. At present a safety margin has been obtained and the tool can base its analysis on this safety margin. However, as part of current work, ma-chine learning is being introduced in order to have
a safety envelope that is more accurate. Machine
Learning/Neural Networks can also be implemented to automatically select a context based on the posi-tion of the aircraft, pilot’s previous acposi-tions, and the environment in real time (wind, etc..). This tool will also be proposed to a discussion with pilot’s and have their feedback. This is also very important in order to validate the tool.
ACKNOWLEDGMENTS
The ongoing research is being funded by Dassault Aviation. The project is under the ISAE-SUPAERO and Dassault Aviation chaire.
REFERENCES References
Bruggemann, T. S. & Campbell, D. (2017). Analysing the reliability of multi UAV operations, 17th Australian International Aerospace Congress: AIAC 2017, Barton, A.C.T., pp. 406–417. Clinton V. Oster Jr., John S. Strong, C. K. Z. (2013).
Analyzing aviation safety: Problems, challenges, opportunities, Research in Transportation Eco-nomics (43): 148–164.
Leveson, N. G. (2011). Engineering a Safer World: Systems Thinking Applied to Safety, The MIT Press.
Leveson, N. & Thomas, J. (2013). Stpa primer,
http://sunnyday.mit.edu/STPA-Primer-v0.pdf . Nancy Leveson, Mirna Daouk, N. D. & Marais, K.
(2003). Applying stamp in accident analysis,
Technical report, 2nd Workshop on the Investi-gation and Reporting of Accidents.
Russo, A., Miller, R., Nuseibeh, B. & Kramer, J. (2000). An Abductive Approach for Handling In-consistencies in SCR Specifications, (ICSE2000) International Workshop on Intelligent Software Engineering, Limerick, Ireland.
Thomas, J. (2013). Extending And Automating A
Systems-Theoretic Hazard Analysis For Require-ments Generation And Analysis, PhD thesis, Massachusetts Institute of Technology.
Thomas, J. (2017). Stamp/stpa beginner introduc-tion, STAMP Workshop 2017 .
Wiegmann, D. & Shappell, S. (2011). A human error analysis of commercial aviation accidents using the human factors analysis and classification sys-tem (hfacs), Technical report, University of Illi-nois at Urbana-Champaign, Institute of Aviation and FAA Civil Aeromedical Institute.