Bellemare : Corresponding author. Département d’économique and CIRPÉE, Université Laval
Kröger : Département d’économique and CIRPÉE, Université Laval
van Soest : RAND and Tilburg University
We thank Vera Toepoel, Marcel Das and his team at CentERdata for support throughout the experiment. Data collection was funded by CentER and the Department of Econometrics & OR at Tilburg University. The first author thanks the Canada Chair of Research in the Economics of Social Policies and Human Resources for Cahier de recherche/Working Paper 07-21
Preferences, Intentions, and Expectations: a Large-Scale
Experiment with a Representative Subject Pool
Charles Bellemare Sabine Kröger Arthur van Soest
Abstract:
We specify and estimate an econometric model which separately identifies distributional preferences and the effects of perceived intentions on responder behavior in the ultimatum game. We allow the effects of perceived intentions to depend, among other things, on the subjective probabilities responders attach to the possible offers. We estimate the model on a large representative sample from the Dutch population. We find that the relative importance of distributional preferences and perceived intentions depends significantly on the socio-economic characteristics of responders. Strong inequity aversion to the other player’s disadvantage is found for lower educated and older respondents. Responders tend to punish unfavorable offers more if they expect that fair proposals will occur with higher probability.
Keywords: Inequity aversion, intentions, subjective expectations
1 Introduction
Two distinct approaches to introduce fairness in economics have emerged over the last decade. On the one hand, outcome based models (e.g., Fehr and Schmidt, 1999; Bolton and Ockenfels, 2000) interpret fairness as the concern for equitable material payoffs. Intentions based models (e.g., Rabin, 1993; Dufwenberg and Kirchsteiger, 2004) on the other hand emphasize the importance of the intentions agents attribute to the actions taken by another player. The empirical relevance of both classes of models has mostly been analyzed using laboratory experiments (see, e.g., Blount, 1995, Cox and Deck, 2005, and Charness and Levine, 2007). Results from these ex-periments have provided convincing support for both approaches, suggesting that it is important to model both distributional concerns and the reactions to perceived intentions.
In this paper, we specify and estimate an econometric model which separately identifies the effects of distributional preferences and perceived intentions on re-sponder behavior in the ultimatum game. We do so by exploiting information on response behavior in two treatments. The first treatment is a normal ultimatum game where proposers intentionally choose the amounts offered to responders. The second treatment is a random alternative to the ultimatum game where responders receive offers randomly drawn from a uniform distribution. In the latter treatment, intentions cannot affect responder behavior since there are no proposers who inten-tionally make offers. The differences in response behavior between the two treat-ments thus identify the impact of intentions.1 Direct structural estimation of an existing intention based model would typically require measuring second order be-liefs of responders (e.g., Dufwenberg and Kirchsteiger, 2004, Falk and Fischbacher, 2006). Because such beliefs involve expectations of responders over the expectations proposers have concerning responder behavior, they are difficult to elicit in the ul-timatum game studied here. By modelling the effect of the perceived intentions on
1The idea of comparing a normal and random treatment first appeared in Blount (1995). It has
since served as one of the main approaches used to measure the role of intentions. Falk, Fehr, and Fischbacher (2007) provide an extended application of the approach.
responses, we overcome the need to measure second order beliefs while still being able to quantify the empirical relevance of perceived intentions relative to distribu-tional preferences without making reference to a specific intention based model.
An important contribution of this paper is that our participants are drawn from a large representative sample from the (Dutch adult) population. In total, we have about 1200 participants of age 16 and older from different socio-economic groups. This is in contrast to most of the existing experiments, which typically use partici-pants drawn from a homogeneous subject pool, often university students majoring in economics or business. The representativeness of homogeneous (student) subject pools raises concerns about the generalizability of the results to broader popula-tions. There is now growing evidence (e.g., Bellemare and Kr ¨oger, 2007, Bellemare, Kr ¨oger and van Soest, 2007) indicating that behavior inferred from student sub-jects is not representative of the behavior in a broad population. This suggests that an analysis of preferences and intentions attribution can greatly benefit from ex-periments in which subjects represent the population at large. Here, we account for the heterogeneous nature of the pool of respondents by allowing distributional preferences and the effects of perceived intentions to depend on both observed and unobserved characteristics of the participants.
Another innovation of our paper is that we analyze how the effects of perceived intentions depend on the responder’s subjective expectations concerning proposer behavior (first order beliefs).2 Expectancy violation theory proposed by social psy-chologists suggests that individuals who make decisions more favorable than ex-pected should be evaluated more positively, while individuals who make decisions less favorable than expected should be evaluated more negatively (see, e.g., Jus-sim, Coleman, and Lerch, 1987). Furthermore, several studies in that literature
2See Manski (2004) for a survey of the literature on the measurement of expectations in economics
and Manski (2002) for a discussion of possible applications in economic experiments. Existing stud-ies on the ultimatum game typically either do not account for such expectations, or focus on the relationship between responder behavior and social norms, the later defined as the opinions of play-ers concerning what constitutes a fair offer (see, e.g., Buchan, Croson, and Johnson, 2004).
have found that unexpected negative and positive outcomes can affect the causes an individual attributes to explain the realized outcomes (see, e.g., Jackson, Sullivan, Hodge, 1993, Bettencourt, Dill, Greathouse, Charlton, and Mulholland, 1997). From the viewpoint of economic experiments, these results suggest that the intentions at-tributed to actions that deviate from expectations (i.e. unexpected decisions) can differ significantly from the intentions attributed to actions which conform with ex-pectations. Accordingly, we investigate whether responders attribute significantly different intentions to low or high offers when these offers are believed to occur less frequently.
We find that distributional preferences and perceived intentions are both im-portant determinants of responder behavior in the ultimatum game. The relative importance of each of these factors is found to vary significantly across sub-groups of the broad population, and on whether offers are favorable or unfavorable to re-sponders. Averaging across the entire population, distributional concerns dominate the effects of perceived intentions. However, intentions are estimated to play a more important role for young and educated subjects, in particular for advantageous of-fers.
We also find that young and educated subjects have significantly more self-oriented preferences, and more positive perceptions of the intentions behind very generous offers. In contrast, other groups of the population have substantially higher levels of inequity aversion to both own and other’s disadvantage, and re-act more negatively to intentionally made very generous offers. Plateau behavior in particular, i.e., rejecting unequal offers both to own and other’s disadvantage, is more important amongst older and less educated subjects who not only have stronger inequity aversion for high offers, but also perceive these offers more nega-tively.
Finally, we find significant evidence that responder expectations are important determinants of the measured impact of intentions attribution. In particular, rejec-tion of low offers significantly increases when such offers are perceived as less likely, suggesting that negative expectancy violations can affect the intentions attributed to
proposers. This effect is significantly stronger for younger subjects.
The remainder of the paper is organized as follows. Section 2 presents the ex-perimental design. Section 3 gives an overview of the data. Section 4 presents our model. Section 5 discusses the results and Section 6 concludes.
2 Experiment
The experiment was conducted in March 2004. Subjects were recruited by CentER-data, the survey research institute affiliated to Tilburg University in the Netherlands. CentERdata carries out panel surveys through an Internet panel, the CentERpanel, consisting of approximately 2000 Dutch households. Every Friday, the CentERpanel participants receive a questionnaire which they are asked to fill in at any time be-tween that Friday and the Tuesday of the following week. In order to make the sample representative of the Dutch population, households without Internet, with-out a computer, or even withwith-out a television set are given the necessary equipment.3 There are several reasons why the CentERpanel is an attractive medium to con-duct experiments. First, it gives access to a representative sample, which is one of the key features of our study. Secondly, CentERdata reimburses the weekly tele-phone costs for answering the questionnaire by crediting CentERpoints (hereafter CP; 100 CP = 1 Euro) to the respondents’ bank accounts four times a year, which allows us to reimburse the participants in a convenient way.
The individuals who were contacted had to read an opening screen informing them that they were selected to participate in an experiment conducted by a team of university researchers.4 Participants were randomly assigned to either a “nor-mal” ultimatum game or a “random” ultimatum game. A detailed description of the particular game and the payoff structure followed. Each person was informed that conditional on their participation, they would be randomly assigned to one of
3For a description of the recruitment, sampling methods, and past usages of the CentERpanel, see
www.centerdata.nl.
the roles and would be randomly matched to another panel member playing the op-posite role. Panel members who agreed to participate were then informed of their role.
In both treatments, two persons, a proposer and a responder, can share an amount of 1000 CP (10 Euros). In the normal ultimatum game, the proposer comes up with a proposal on how to share the amount; the responder either accepts or re-jects this proposal. If the proposal is accepted, payoffs are as in the proposal; if the proposal is rejected, both players get nothing. We discretized the choice set of the proposer to eight possible allocations (X, Y)∈ {(1000, 0), (850, 150), (700, 300),
(550, 450), (450, 550), ... ,(0, 1000)} where the amounts X and Y denote the payoffs (in CP) for the proposer and the responder, respectively.5
In the normal ultimatum game, the proposers themselves chose one of the eight allocations and offered it to the responder. In the random ultimatum game, the proposers had no active role in determining the offers. Instead, the offer was de-termined by a computer randomly choosing one of the eight allocations, with equal probabilities for all of them.6
In our design, the accept/reject decisions of the responders were elicited using the strategy method (Selten, 1967). Responders were asked whether they would accept or reject each of the eight allocations that could be offered. The decision of a responder which corresponded to the actual allocation offered by the proposer matched to this responder determined the payoff of both participants. The strat-egy method overcomes the difficulty of having CentERpanel members interact in real time and provides more information, as responses to all eight possible alloca-tions are elicited, including allocaalloca-tions that are hardly ever chosen by the actual proposers.7
5We ruled out the equal split(500, 500)to force proposers and responders to commit themselves
to offering and accepting (or rejecting) either more or less than the equal split, a feature which intu-itively should help to increase the efficiency of our estimates.
6The uniform distribution has been used in several studies for a random treatment to deliberately
exclude intentions (see, e.g., Offerman, 2002, Cox and Deck, 2005.)
Asking responders to accept or reject every amount separately differs from Blount (1995) and many other studies that only ask for the minimum acceptable amount. The latter assumes “threshold behavior,” every amount exceeding some (respon-dent specific) threshold will be accepted. Our approach allows to explore the in-cidence of plateau behavior, i.e., the observation that a substantial proportion of re-sponders reject offers which are either relatively disadvantageous or advantageous to them. The incidence of plateau behavior has recently been documented in Huck (1999), Henning-Schmidt, Li, and Yang (forthcoming), Bahry and Wilson (2006), and G ¨uth, Schmidt, and Sutter (2003).
After making their decisions, responders in the normal ultimatum game were asked to state their subjective probabilities that each of the eight possible allocations will be offered. To simplify this task, probabilities were obtained by asking for nat-ural frequencies. For a given offer of X CP, the following question was asked: “Out
of 100 persons who can choose an allocation, how many will offer X CP and keep 1000−X
CP?”.8 Responders answered this question for all eight possible offers.
After all participants had made their decisions, proposers and responders were randomly matched and payoffs were computed based on the decisions of each pair. Payoffs corresponded to the allocation chosen by the proposer (in the normal ulti-matum game) or by the computer (in the random ultiulti-matum game), if this allocation was accepted by the responder. If it was rejected, both participants received noth-ing. Two weeks after the experiment, all participants received information on the outcome of the game and their final payoff, which was later credited to their CentER bank account.
For this experiment, we contacted 1443 panel members of whom 139 declined method are not statistically different from decisions collected in a hot environment. Brandts and Charness (2000) do not find significant differences of choices in simple sequential games between hot and cold environments. On the other hand, differences have been found for binary ultimatum games (G ¨uth, Huck, and M ¨uller, 2001) and sequential bargaining games with costly punishment (Brosig, Weiman and Yang, 2003).
8This follows Hoffrage, Lindsey, Hertwig, and Gigerenzer (2000) who find that people are better
to participate. Keeping only panel members who completed the experiment and for whom we have a complete set of background characteristics, we have 377 (268) proposers and 324 (255) responders in the normal (random) ultimatum game.9
3 Descriptive statistics
Table 1 gives the descriptive statistics of the responders in the two treatments. We group age into three categories, participants younger than 35, between 35 and 54 years, and 55 years and older. Similarly, three education categories are used, low (primary and vocational training), middle (general secondary or standard voca-tional training), and high (high vocavoca-tional training and university education). We also grouped gross personal income into three groups of about the same size, those with monthly gross personal income below 1500 euros, between 1500 and 2500 eu-ros per month, and more than 2500 eueu-ros per month. Finally, we include gender and work status dummies.
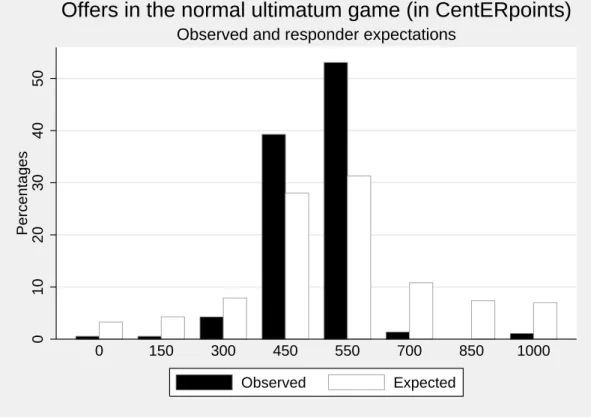
The dark bars in Figure 1 present the offer distribution in the normal ultimatum game, exhibiting some well-known features (see, e.g., Camerer, 2003): proposers send positive amounts, with the mode around the equal split, and very few offers above this level. It seems surprising that the majority of the proposers offer some-what more than half (550 CP) rather than less than half of the total amount. This may be due to low subjective acceptance probabilities for amounts below the equal split (possibly combined with high risk aversion), or to a stronger aversion against inequity at the other player’s disadvantage than against inequity at the proposer’s own disadvantage.
The light bars in Figure 1 present the average offer distribution expected by re-sponders in the normal ultimatum game. On average, rere-sponders placed a slightly higher probability on getting offers below 450 CP compared to what actually
mate-9In order to balance the unequal numbers of players in both roles, some responders were
ran-domly assigned twice to a proposer. As all other participants, these responders received payments resulting from only one (the first) matching.
rialized. While the mode of the expected offer distribution (550 CP) coincides with the mode of the realized offer distribution, responders subjective probabilities of offers of 450 CP and 550 CP appear to be lower than the actual frequencies. Corre-spondingly, average subjective probabilities are higher than actual offer frequencies for offers below 450 CP and offers above 550 CP.
The figure does not show the heterogeneity in the subjective probabilities across responders. Heterogeneity is substantial, particularly for offers of 450 CP and 550 CP. One in every four responders attach a probability of at most 15% to an offer of 450 CP, and one in every four attach a probability of 40% or more to the same offer. Similar numbers are found for offers of 550 CP (one quarter gives this a probability of at most 20%, and one quarter at least 40%). We also computed the modes of each responder’s subjective probability distribution. About 80% of responders place their highest subjective probability on an offer of either 450 CP or 550 CP. Responders thus typically expect proposers to make fair offers, but a substantial group of responders attach much larger probabilities to unfair offers than actually materialize.
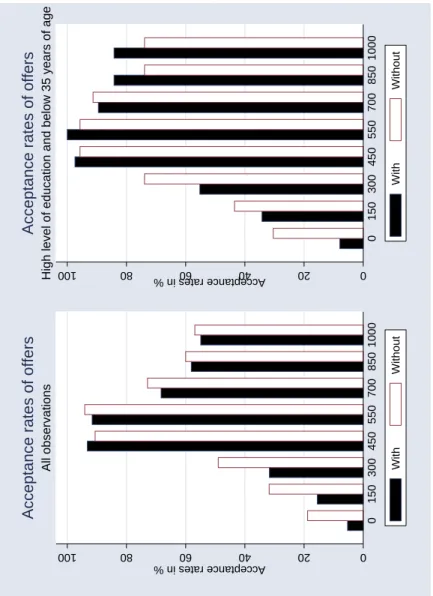
The left hand side of Figure 2 presents the sample acceptance rates in both treat-ments, where dark bars denote the normal ultimatum game and light bars the ran-dom ultimatum game. In both treatments, the acceptance rates rise from numbers below 20% for zero offers to above 90% for proposals around the equal split, before declining to just above 55% when proposers offer the whole amount to the respon-der. The acceptance rates of offers below 450 CP are much higher in the intentions free treatment (random ultimatum game) than in the treatment where intentions are present (normal ultimatum game). For offers of 0 CP, the difference in aggregate acceptance rates between random and normal ultimatum game treatments is 13.5 percentage points; the difference in the likelihood of accepting all eight offers is 13.9 percentage points.
The right hand side of Figure 2 presents acceptance rates for individuals younger than 35 with a high level of education, our proxy for the student subject pool com-monly used in laboratory experiments. For each treatment, the acceptance rate in this sub-sample is higher than in the complete representative sample. The
differ-ences are particularly high for offers above 550 CP, though even for this sub-sample, the acceptance rate falls as the amount offered increases beyond 550 CP.
Table 2 presents the sample distribution of complete responder strategies in both treatments. Each line represents a strategy, where a 1 symbolizes accepting a given offer and 0 denotes rejecting it. For both treatments separately, the table gives the number and percentage of responders who chose each strategy. The strategies are split in two groups. The first and most prominent group are threshold responders who accept any offer above a certain amount. The second group gathers plateau responders who reject not only very low offers but also very generous offers.
The substantial size of the latter group has been discussed in recent studies. Huck (1999), Hennig-Schmidt, Li, and Yang (forthcoming) and Bahry and Wilson (2006) report similar levels of plateau behavior in their ultimatum game experi-ments. Note that plateau behavior cannot be revealed when using the more tra-ditional approach of asking responders for the minimum offer they would accept – this question already assumes threshold behavior. A third group, not reported in the table, accepts and rejects in an inconsistent way. This group is small (3.0%), sup-porting the conjecture that the large majority of respondents understood the nature of the game. The third group will not be included in our empirical analysis.10
The likelihood of playing either a threshold or plateau strategy is similar for both treatments. Substantial differences between treatments are only found within the group of threshold players. The proportion of individuals accepting any offer from 0 to 1000 CP is 5.2% in the normal ultimatum game versus 19.1% in the random ul-timatum game, illustrating that responders in the normal game penalize perceived bad intentions. An opposite difference is found for the strategy of only accepting offers of at least 450 CP – this strategy is used by 27.1% in the normal ultimatum game, but only by 16.3% of responders in the random treatment.
10We also estimated the model including these respondents and found results that were very
4 An Econometric Model of Preferences and Intentions
We now specify the econometric model, starting with the model without intentions, which is the relevant model for responders in the random treatment. Here we use the model of Fehr and Schmidt (1999), with utility of responder i from payoffs yresp to him- or herself and yprop to the other participant (the “inactive proposer”, in this treatment) given by:ui(yresp, yprop) = yresp−αimax{yprop−yresp, 0} −βimax{yresp−yprop, 0} (1)
where αiand βicapture inequity aversion from having less and more than the other participant, respectively. For respondents who only care about their own payoff, αi and βi are equal to 0.
To explain responder behavior in the normal ultimatum game, we extend this model to account for intentions. We assume that the utility to responder i from payoffs yresp to him- or herself and yprop to the proposer is given by
ui(yresp, yprop) = yresp − (αi+ιli)max{yprop−yresp, 0}
− (βi+ιmi )max{yresp−yprop, 0} (2)
Depending on how the responder perceives and tends to penalize or reward the intentions, the parameters ιli and ιmi can increase or decrease the disutility from receiving a disadvantageous or very advantageous offer.
The outcome-based preference parameters(αi, βi)affect utility over offers of re-sponders in both treatments, while the preference parameters ιl
i and ιmi measuring the reaction towards perceived intentions only play a role in the normal ultimatum game treatment. We assume the following parametric model of distributional pref-erences.
αi = x0iα+µαi
βi = x0iβ+µ
β i
where xi denotes a vector of observable characteristics, and (µαi, µ β
i)represents un-observed heterogeneity. We will assume that(µαi, µβi)is independent of error terms
and background variables xiand follows a bivariate normal distribution with means zero, variances (σ2
α, σ2β) and correlation coefficient ρ. We expect that ρ is positive since people with a general aversion to inequity probably have large values for both parameters.
We do not a priori impose any signs on the intentions parameters ιli and ιmi , thus allowing, in principle, for positive as well as negative reactions towards perceived intentions to advantageous and disadvantageous offers. Allowing for observed and unobserved heterogeneity, ιl
iand ιmi are specified as:
ιil = x0iιl+ηilQi(O ≤yresp) +µι l i (3) ιim = x0iιm+ηimQi(O≥yresp) +µι m i (4) Here (µιl i, µι m
i ) represent unobserved components determining the effects of per-ceived intentions, assumed bivariate normal with means zero, variances(σιl2, σιm2 ), and correlation coefficient ρι. The variable Qi(O ≤ yresp) represents the subjective probability that responder i places on receiving offers of yresp or less. This term is introduced to capture the effects of the responders’ subjective expectations on their behavior. Keeping yresp constant, a smaller value of Qi(O≤yresp)indicates that the responder considers an offer as low as yrespor worse more unlikely. We expect that this will lead to a larger tendency to “punish” the proposer if such a low offer would materialize, and will thus increase ιl
i. Hence, we expect a negative value for ηl. Sim-ilarly, Qi(O ≥ yresp) is the responder’s subjective probability that offers are at least as high as the received offer yresp. We expect a negative value of ηm, implying that responders who place a higher probability on getting the offer under consideration or an even larger offer have a lower tendency to punish the proposer for an unrea-sonably high offer (if ιmi > 0), or a higher tendency to reward the proposer for the very generous offer (if ιm
characteristics xiby specifying11:
ηil = x0iηl
ηim = x0iηm
Under the assumptions above, a responder i who gets an offer yresp(j) = 1000−
yprop(j) with (yprop(j) = {0, 150, 300, ..., 1000}) has to trade off the utility of reject-ing uRij and the utility of accepting the offer uijA. For the normal ultimatum game, according to (2), these values are uRij =0 and
uijA =yresp(j) − (αi+ιli)max{1000−2yresp(j), 0}
− (βi+ιmi )max{2yresp(j) −1000, 0}. (5) A similar expression applies for the random treatment, based upon (1). A responder who perfectly maximizes payoff would thus choose to accept the offer if and only if uijA >uijR(=0). To allow for optimization errors, we add logistic errors to the utility of accepting that are independent of everything else in the model, multiplied by a noise-to-signal ratio parameter λN in the normal ultimatum game, and λR in the random ultimatum game. We assume that the responder maximizes over the con-taminated values rather than the exact values, giving the binary logit probabilities:
P(Responder i accepts offer j|uijA, with intentions) = 1
1+e−uijA/λN
(6)
P(Responder i accepts offer j|uijA, without intentions) = 1
1+e−uijA/λR
(7)
5 Econometric results
Model fit
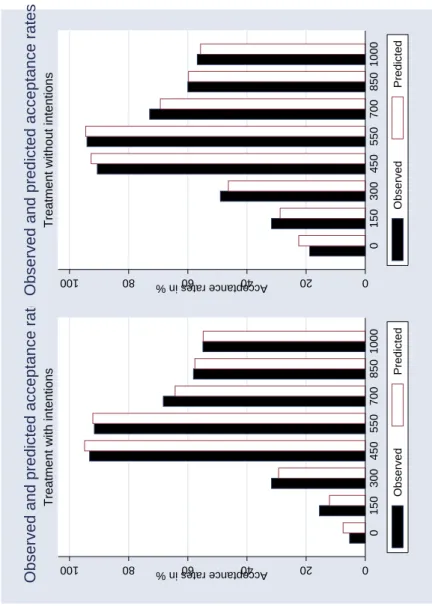
The observed and predicted acceptance frequencies in both treatments are given in Figure 3. Overall, the fit of our model is rather good. For both treatments, the model
11We also estimated a more general model where the subjective probabilities Q
i(·)could depend
on observable and unobservable characteristics. Model estimates of the extended model were very close to those of the model presented here and are available upon request.
captures both the increase in acceptance frequencies between 0 CP and 450 CP and the decrease in acceptance frequencies for offers exceeding 550 CP. The model also manages to capture the differences in responses between both treatments.
Preferences
Table 3 shows in detail how the parameters α, β, ιland ιm vary with observed char-acteristics. We find that men have higher disutility from own disadvantage (α) than women, though the difference is significant only at the 10% level. The same applies to the oldest group compared to the young. Responders with the highest level of education have significantly lower aversion to own disadvantage than the lower educated. The estimates for β show that observed characteristics also play a role for inequity at the other player’s disadvantage: the high education group has sig-nificantly lower and the oldest age group has sigsig-nificantly higher inequity aversion at the other participant’s disadvantage than their respective benchmarks (low ed-ucated and young). These two effects together can explain why in the young and high educated ”student” sample, rejection rates of high offers in the no intentions treatment are higher than in the complete sample (cf. Figure 2).
Equations (3) and (4) imply that each observable characteristic affects the inten-tions parameters ιl
i and ιmi in two different ways. The first is the effect if Qi =0 (the case that the offer is considered very extreme), measured by the parameter vectors
ιl and ιm. The second is through the effect of observable characteristics on the re-sponse to subjective expectations, measured by the parameter vectors ηm and ηl. We find hardly any observed heterogeneity in the effect of observable characteristics on intentions for offers to the responder’s own disadvantage if Qi = 0 (ιli). A formal chi-square test does not reject the null hypothesis that all eight slope parameters in ιlare equal to zero (χ28 =3.867, p-value = 0.869).
On the other hand, the two older age groups both have a significantly larger ten-dency to reject high offers in the treatment where intentions are present and Qi =0 (ιm). This might be an effect of pride, with older respondents unwilling to accept
“gifts” from the (anonymous) proposers. Even though regarded in the psychol-ogy literature as positive emotion, pride may depress take-up of social benefits or might lead to “irrationally” hard negotiation positions (Lea and Webley, 1997). It might also reflect a general suspicion of older respondents towards generosity from an anonymous party – in spite of the stated rules of the game, they may use their experience with companies advertising free deals and think that in the end, noth-ing comes for free. Finally, high income responders tend to perceive the intentions behind high offers more positively than others, resulting in a significantly lower ιm. The effects of subjective expectations on responder behavior appear to be more important for disadvantageous offers than for favorable offers. The intercept in ηl measures the effect of subjective expectations for disadvantageous offers for the benchmark group of young non-working women with low education and income levels. We find that the estimated value of ηl for this group is negative and sig-nificant, indicating that they significantly punish low offers the more unlikely they consider such offers. This effect is found to be significantly stronger for the youngest age group than for the the middle aged and older respondents. We find no evidence that responders reject very favorable offers because these offers are considered un-likely. There is a small gender effect, with women rejecting favorable offers more than men if they are unexpected, but this is only significant at the 10% level.
The estimated scale parameters and covariance matrix parameters are given in the right hand side column of Table 3. The estimated values of λN and λR are both positive and significant. Moreover, a chi-square test (χ21 = 1.715, p-value = 0.190) fails to reject the null hypothesis that λN and λR are equal. The estimates of the covariance parameters show that there is significant unobserved heterogeneity in inequity aversion, particularly in inequity aversion at the other participant’s dis-advantage (σβ2). Moreover, as expected, the unobserved heterogeneity components in αi and βi are positively correlated, with a significant correlation coefficient of
ρ=0.770. Unobserved heterogeneity plays a modest role in determining the effects of perceived intentions for high offers (σι2m), while no evidence of unobserved hetero-geneity is found for offers at one’s own disadvantage (σι2l is small and insignificant;
as a consequence, ρl is poorly identified).
Table 4 presents the average predicted values of (αi, βi, ιl
i, ιmi ) based on the es-timates in Table 3. The top panel reports the averages and standard deviations of the parameter predictions for all participants. The bottom panel reports the aver-age predictions for young and high educated individuals. Comparing these panels gives an indication of the difference between a representative sample and the results based upon recruiting from student populations.12
The parameters αi and βicapture distributional concerns, net of intentions - like the α and β parameters of the Fehr and Schmidt (1999) model. The average predicted population value of α is 1.892 with a relatively small standard deviation of 0.640 indicating that most responders in the population have some aversion to inequity to their own disadvantage. The average predicted population value of β is 0.801 with a high standard deviation of 0.921, indicating that a substantial portion of subjects have a high predicted aversion to other’s disadvantage. These predicted averages are higher than previous estimates (Goeree and Holt, 2000) and calibrations (Fehr and Schmidt, 1999, Huck, M ¨uller, and Normann, 2001).
Positive (negative) values of ιl indicate that the offers below an equal split pro-voke negative (positive) reactions, which can be interpreted as perceiving bad (good) intentions, resulting in higher (lower) rejection rates. The average predicted value of ιl is 0.382, indicating that, on average, responders attribute bad intentions to offers below the equal split. Negative (positive) values of ιm on the other hand indicate that the offers above the equal split signal good (bad) intentions, and lead to lower (higher) rejection rates. The average predicted value of ιm is−0.164, indicating that, on average, responders attribute good intentions to generous offers. The substan-tial dispersion in the predicted values of ιm suggests however that a considerable fraction of subjects attribute negative intentions to overly generous offers.
The average predicted values of α and β of young and educated subjects are lower than the corresponding predictions for the population average, indicating
12The predicted α
iand βiare averaged over responders from both treatments, while the predicted
that young and high educated individuals have lower inequity aversion. Moreover, young and educated subjects attribute substantially higher positive intentions to of-fers above the equal split (ιm = −1.167) than the overall population average. Taken together the results above indicate that inequity aversion is more important than perceived intentions in the population as a whole. However, perceived intentions weigh more heavily for young and educated subjects, in particular for advantageous offers.
Responses and expectations
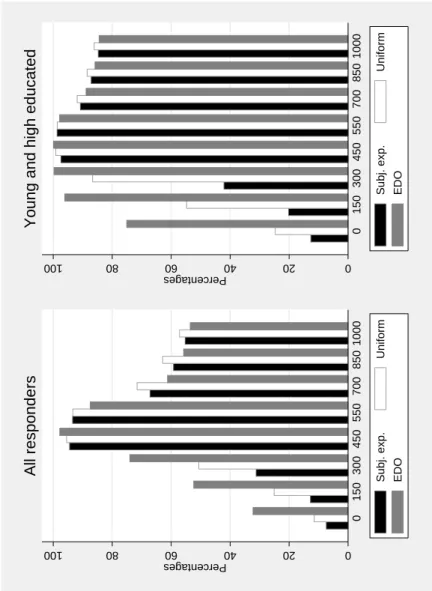
In this subsection, we investigate in more depth the relationship between subjective expectations and responder behavior. We do so by predicting the acceptance prob-abilities in the normal ultimatum game under three different scenarios. The first ”benchmark” scenario allows for heterogeneous expectations, using our model esti-mates and the subjective probabilities for each responder. In the second scenario, we predict the behavior of responders who expect each offer will occur with the same probability (uniform expectations). In the third scenario, we predict the behavior of responders who expect disadvantageous offers (EDO): an offer of 0 CP occurs with 40% probability, and offers of 150 CP, 300 CP, and 450 CP with 20% probability each. In other respects, all scenarios copy the benchmark model. We perform the sim-ulations for the entire sample of responders (left graph), and then only for young responders with university education, our proxy for the typical sample of student subjects used in most laboratory experiments (right graph).
Figure 4 presents the predicted distributions in the three scenarios for both groups. Consistent with our parameter estimates, the effects of expectations on high offers are of the expected signs but relatively small in all scenarios. Differences are much larger for the offers to the responder’s disadvantage. Compared to the benchmark, the uniform expectations scenario places more probability mass on low offers com-pared to what most responders expected in the benchmark scenario. In line with our estimates, the subjective expectations scenario gives lower acceptance rates than the
uniform expectations scenario, illustrating that unexpected disadvantageous offers make responders attribute negative intentions to the proposers, which are then pe-nalized by higher rejection rates.
The interesting case is the third one, where responders were given the (quite un-realistic) expectations that proposers often make very disadvantageous offers. In this perspective, most offers still seem relatively generous compared to what is of-fered on average, and acceptance rates are high - even exceeding the acceptance rates in the no intentions treatment. What are perceived ”bad intentions” under the reported subjective expectations thus become ”(relatively) good intentions” under the alternative EDO scenario. This illustrates the important role of expectations in how intentions drive responders’ acceptance decisions.
For the group of young responders with high education level, the differences between the three scenarios are similar, and in general, acceptance rates are higher than for the total population, particularly under the EDO scenario. Even offers of zero are quite often accepted by this group. The main reason is that this group has lower inequity aversion.
6 Conclusion
This paper exploited experimental data with two different treatments to separately identify distributional preferences and the effects of perceived intentions on respon-der behavior in the ultimatum game. We extended existing studies in two important directions. First, we specified and estimated an econometric model of responder be-havior relating outcome-based preferences and the effects of perceived intentions to both observed and unobserved characteristics of a large representative sample of subjects drawn from the Dutch population. Second, we allowed the effects of the perceived intentions to depend on the elicited subjective probability distributions of relevant responders.
Our analysis has revealed that distributional preferences and perceived inten-tions are both important determinants of responder behavior in the ultimatum game.
A key insight of this paper is that the relative importance of each of these factors is likely to vary across sub-groups of the broad population, and on whether offers are favorable or unfavorable to responders. Averaging across the entire population, in-equity aversion dominates the effects of perceived intentions. However, perceived intentions were found to weigh more heavily for young and educated subjects, in particular for advantageous offers.
We also found that considering only young and educated subjects provided es-timates of more self-oriented preferences, and more positive perception of the in-tentions behind very generous offers. We showed that other groups of the popula-tion not only have substantially higher levels of inequity aversion to both own and other’s disadvantage, but also perceive negatively the intentions of overly generous offers. Plateau behavior in particular, i.e., rejecting unequal offers both to own and other’s disadvantage, was found to be more important amongst older and less ed-ucated subjects who not only have stronger inequity aversion for high offers, but also perceive negatively these offers. These results suggest that using convenience samples comprising subgroups of the population (e.g., students) may provide a dis-torted picture of both distributional preferences and the effects of perceived inten-tions in the population.
Finally, we found significant evidence that responder expectations are important determinants of the measured impact of intentions attribution. While there is con-siderable heterogeneity in subjective expectations, there appears to be a consensus amongst responders that the most likely offers will be fair. We found that these expectations were consistent with observed offers, although responders generally overestimated the probability of getting offers below and above the equal split. More importantly, we found that the rejection of low offers significantly increases when such offers are perceived as less likely, suggesting that negative expectancy violations can affect the intentions attributed to proposers. While this result was found to hold for all sub-groups of the population, the measured effect is signifi-cantly stronger for younger subjects. Hence, responder expectations provide addi-tional incentives for proposers to make fair offers.
V ariables Mean Description Gender 0.527 1 if male, 0 otherwise Low education 0.294 1 if primary education or vocational training, 0 otherwise Middle education 0.352 1 if general secondary education or vocational training, 0 otherwise High education 0.353 1 if university education or high vocational training, 0 otherwise Y oung 0.241 1 if below 35 years of age, 0 otherwise Middle age 0.454 1 if between 35 and 54 years of age, 0 otherwise Old 0.305 1 if above 54 years of age, 0 otherwise Low income 0.362 1 if monthly gr oss personal income is below 1500 Eur os, 0 otherwise Middle income 0.331 1 if monthly gr oss personal income is between 1500 and 2500 Eur os, 0 otherwise High income 0.306 1 if monthly gr oss personal income is above 2500 Eur os, 0 otherwise W ork 0.582 1 if involved in paid work, 0 otherwise Number of observations 577 Table 1: Definitions and sample means of the explanatory variables for all responders in our normal and random ultimatum game tr eatments.
0 150 300 450 550 700 850 1000 Normal Random N % N % Thr eshold behavior 1 1 1 1 1 1 1 1 16 5.14 48 19.05 0 1 1 1 1 1 1 1 27 8.68 20 7.94 0 0 1 1 1 1 1 1 28 9.00 21 8.33 0 0 0 1 1 1 1 1 86 27.65 41 16.27 0 0 0 0 1 1 1 1 11 3.53 9 3.57 0 0 0 0 0 0 0 1 1 0.32 2 0.79 Subtotal Thr eshold 169 54.34 141 56.34 Plateau behavior 0 0 0 1 1 1 0 0 20 6.43 7 2.78 0 0 0 1 0 0 0 0 20 6.43 6 2.38 0 0 0 1 1 0 0 0 60 19.29 48 19.04 0 0 0 1 1 1 1 0 6 1.93 2 0.79 0 0 1 1 1 0 0 0 8 2.57 4 1.58 0 0 0 0 1 0 0 0 7 2.25 4 1.58 0 0 1 1 0 0 0 0 2 0.64 0 0 0 1 1 1 1 1 1 0 4 1.29 7 2.78 0 0 1 1 1 1 0 0 11 3.53 18 7.14 0 0 0 0 1 1 0 0 1 0.32 1 0.39 0 0 0 0 0 1 0 0 1 0.32 1 0.39 0 1 1 1 0 0 0 0 1 0.32 0 0 0 0 1 1 1 1 1 0 1 0.32 0 0 0 0 1 1 1 1 1 0 0 0 2 0.79 0 1 1 1 1 0 0 0 0 0 1 0.39 0 1 1 1 1 1 0 0 0 0 2 0.79 0 0 0 0 1 1 1 0 0 0 2 0.79 Subtotal Plateau 142 45.65 105 46.66 Total 311 100 246 100 Aggr egate acceptance rates Normal 0.053 0.155 0.317 0.932 0.916 0.683 0.581 0.549 Random 0.188 0.318 0.490 0.906 0.941 0.729 0.600 0.569 Table 2: The table columns pr esent the acceptance decision (coded as 1 if accepted) for all possible 8 of fers. N denotes the number of observations. Ther e wer e 324 (255) responders in the normal (random) ultimatum game. The responses of 13 (9) participants who answer ed in an inconsistent way ar e omitted fr om the table.
α ι l β ι m η l η m Remaining parameters Constant 1.072 ∗∗ ∗ 0.894 ∗ − 0.162 − 0.811 − 6.159 ∗∗ ∗ − 0.517 λR 126.305 ∗∗ ∗ ( 0.250 ) ( 0.471 ) ( 0.433 ) ( 0.880 ) ( 2.054 ) ( 2.595 ) ( 6.187 ) Male 0.375 ∗ − 0.022 − 0.451 0.265 − 1.769 3.716 ∗ λN 111.631 ∗∗ ∗ ( 0.201 ) ( 0.364 ) ( 0.320 ) ( 0.621 ) ( 1.610 ) ( 1.913 ) ( 7.319 ) Educ2 − 0.188 0.097 0.093 − 0.662 1.478 − 1.5714 σ 2 α 1.296 ∗∗ ∗ ( 0.211 ) ( 0.373 ) ( 0.344 ) ( 0.645 ) ( 1.250 ) ( 1.777 ) ( 0.136 ) Educ3 − 0.693 ∗∗ ∗ 0.363 − 1.317 ∗∗ ∗ 0.605 0.721 − 1.952 σ 2 β 4.770 ∗∗ ∗ ( 0.230 ) ( 0.384 ) ( 0.399 ) ( 0.711 ) ( 1.400 ) ( 1.957 ) ( 0.527 ) Age2 0.013 − 0.100 0.5214 2.595 ∗∗ ∗ 3.920 ∗∗ − 2.978 ρ 0.770 ∗∗ ∗ ( 0.218 ) ( 0.379 ) ( 0.350 ) ( 0.790 ) ( 1.646 ) ( 2.160 ) ( 0.024 ) Age3 0.427 ∗ − 0.045 1.867 ∗∗ ∗ 2.594 ∗∗ ∗ 3.628 ∗ − 3.419 σ 2 lι 0.010 ( 0.250 ) ( 0.439 ) ( 0.437 ) ( 0.948 ) ( 2.018 ) ( 2.668 ) ( 0.201 ) W ork − 0.279 0.527 0.458 − 0.641 − 1.056 1.018 σ 2 ιm 5.656 ∗∗ ∗ ( 0.210 ) ( 0.371 ) ( 0.410 ) ( 0.713 ) ( 1.241 ) ( 1.822 ) ( 0.703 ) Income2 − 0.099 − 0.417 0.035 0.183 1.032 − 2.677 ρι 0.122 ( 0.237 ) ( 0.448 ) ( 0.442 ) ( 0.792 ) ( 1.713 ) ( 2.285 ) ( 0.130 ) Income3 0.005 − 0.662 0.833 − 2.284 ∗∗ 2.351 − 0.919 ( 0.283 ) ( 0.540 ) ( 0.532 ) ( 0.944 ) ( 2.121 ) ( 2.196 ) Table 3: Econometric model estimates. ’*,**,***’: significant on 10, 5, and 1 per cent level. Standar d err ors in par entheses.
0 10 20 30 40 50 Percentages 0 150 300 450 550 700 850 1000
Observed and responder expectations
Offers in the normal ultimatum game (in CentERpoints)
Observed Expected
Figure 1: Distribution of offers made by proposers and average expected offer dis-tribution of responders in the normal ultimatum game.
α β ιl ιm All observations
Average 1.892 0.801 0.382 −0.164 Std. deviation 0.640 0.921 0.459 1.128
High education level and below 35 years of age
Average 1.018 −0.271 0.227 −1.167 Std. deviation 0.325 0.503 0.397 0.773
Table 4: Predicted average preference parameters. The predicted values of α and β are averaged over responders from both treatments. The predicted values of ιl and
0 20 40 60 80 100 Acceptance rates in % 0 150 300 450 550 700 850 1000 All observations
Acceptance rates of offers
With Without 0 20 40 60 80 100 Acceptance rates in % 0 150 300 450 550 700 850 1000
High level of education and below 35 years of age
Acceptance rates of offers
With
Without
Figure 2: Acceptance rates in the normal and random ultimatum games for all ob-servations and for individuals with high level of education and who are below 35 years of age.
0 20 40 60 80 100 Acceptance rates in % 0 150 300 450 550 700 850 1000
Treatment with intentions
Observed and predicted acceptance rates
Observed Predicted 0 20 40 60 80 100 Acceptance rates in % 0 150 300 450 550 700 850 1000
Treatment without intentions
Observed and predicted acceptance rates
Observed
Predicted
Figure 3: Observed and predicted response distributions in the normal and random ultimatum games.
0 20 40 60 80 100 Percentages 0 150 300 450 550 700 850 1000
All responders Subj. exp.
Uniform EDO 0 20 40 60 80 100 Percentages 0 150 300 450 550 700 850 1000
Young and high educated
Subj. exp.
Uniform
EDO
Figure 4: Predicted acceptance probabilities for all responders (left graph) and only for young and high educated responders (right graph) as a function of the amount offered. The black bars represent the predicted acceptance rates in the random ul-timatum game. The grey bars represent the predicted acceptance rates in the nor-mal ultimatum game with subjective expectations. The white bars represent the predicted acceptance rates computed under the assumption that responders expect disadvantageous offers : an offer of 0 CP occurs with 40% probability, and offers of 150 CP, 300 CP, and 450 CP each occur with 20% probability.
References
BAHRY, D., ANDR. WILSON(2006): “Confusion or Fairness in the Field ? Rejections in the Ultimatum Game under the Strategy Method,” Journal of Economic Behavior and Organization, 60, 37–54.
BELLEMARE, C., AND S. KROGER¨ (2007): “On Representative Social Capital,”
Euro-pean Economic Review, 51, 183–202.
BELLEMARE, C., S. KROGER¨ , ANDA.VANSOEST(2007): “Measuring Inequity
Aver-sion in a Heterogeneous Population using Experimental DeciAver-sions and Subjective Probabilities,” Mimeo, Universit´e Laval.
BETTENCOURT, B. A., K. DILL, S. GREATHOUSE, K. CHARLTON, AND A. MUL
-HOLLAND(1997): “Evaluations of Ingroup and Outgroup Members: The Role of
Category-Based Expectancy Violation,” Journal of Experimental Social Psychology, 33, 244–275.
BLOUNT, S. (1995): “When Social Outcomes Aren’t Fair: The Effect of Causal
Attri-butions on Preferences,” Organizational Behavior and Human Decision Process, 63, 131.
BOLTON, G., AND A. OCKENFELS (2000): “ERC: A Theory of Equity, Reciprocity,
and Cooperation,” American Economic Review, 90, 166–193.
BRANDTS, J., AND G. CHARNESS (2000): “Hot Vs. Cold: Sequential Responses and
Preference Stability in Experimental Games,” Experimental Economics, 2, 227–238.
BROSIG, J., J. WEIMANN, ANDC.-L. YANG(2003): “The Hot versus Cold Effect in a
Simple Bargaining Experiment,” Experimental Economics, 6, 75–90.
BUCHAN, N., R. CROSON, AND E. JOHNSON (2004): “When Do Fair Beliefs
Influ-ence Bargaining Behavior ? Experimental bargaining in Japan and the United States,” Journal of Consumer Research, 31, 181–190.
CAMERER, C. (2003): Behavioral Game Theory: Experiments on Strategic Interaction. Princeton University Press, Princeton.
CHARNESS, G., ANDD. I. LEVINE (2007): “Intention and Stochastic Outcomes: An
Experimental Study,” forthcoming, Economic Journal.
COX, J., AND C. DECK (2005): “On the Nature of Reciprocal Motives,” Economic Inquiry, 43, 623–635.
DUFWENBERG, M., AND G. KIRCHSTEIGER (2004): “A Theory of Sequential
Reci-procity,” Games and Economic Behavior, 47, 260–281.
FALK, A., E. FEHR, AND U. FISCHBACHER (2007): “Testing Theories of Fairness -Intentions Matter,” forthcoming, Games and Economic Behavior.
FALK, A.,AND U. FISCHBACHER(2006): “A Theory of Reciprocity,” Games and Eco-nomic Behavior, 52, 293–315.
FEHR, E., ANDK. SCHMIDT(1999): “A Theory of Fairness, Competition and Coop-eration,” Quarterly Journal of Economics, 114, 817–868.
G ¨UTH, W., S. HUCK, AND W. M ¨ULLER (2001): “The Relevance of Equal Splits in Ultimatum Games,” Games and Economic Behavior, 37, 161–169.
G ¨UTH, W., C. SCHMIDT, AND M. SUTTER (2003): “Fairness in the Mail and Op-portunism in the Internet - a Newspaper Experiment on Ultimatum Bargaining,” German Economic Review, 4, 243–265.
HENNIG-SCHMIDT, H., Z.-Y. LI, ANDC. YANG(2006): “Why People Reject
Advan-tageous Offers: Non-monotone Strategies in Ultimatum Bargaining,” Forthcom-ing, Journal of Economic Behavior and Organization.
HOFFRAGE, U., S. LINDSEY, R. HERTWIG, AND G. GIGERENZER (2000):
“Commu-nicating Statistical Information,” Science, 290(5500), 2261–2262.
HUCK, S. (1999): “Responder Behavior in Ultimatum Offer Games with Incomplete Information,” Journal of Economic Psychology, 20, 183–206.
JACKSON, L., L. SULLIVAN, ANDC. HODGE(1993): “Stereotype Effects on Attribu-tions, PredicAttribu-tions, and Evaluations: No Two Social Judgments are Quite Alike,” Journal of Personality and Social Psychology, 65, 69–84.
JUSSIM, L., L. COLEMAN, AND L. LERCH (1987): “The Nature of Stereotypes : A
Comparison and Integration of Three Theories,” Journal of Personality and Social Psychology, 52, 536–546.
LEA, S. E.,AND P. WEBLEY (1997): “Pride in Economic Psychology,” Journal of Eco-nomic Psychology, 18, 323–340.
MANSKI, C. F. (2002): “Identification of Decision Rules in Experiments on Simple
Games of Proposal and Response,” European Economic Review, 46, 880–891. (2004): “Measuring Expectations,” Econometrica, 72(5), 1329–1376.
MCLEISH, K. N., AND R. OXOBY (2004): “Specific Decision and Strategy Vector Methods in Ultimatum Bargaining: Evidence on the Strength of Other-Regarding Behavior,” Economics Letters, 84, 399–405.
OFFERMAN, T. (2002): “Hurting Hurts More than Helping Helps,” European
Eco-nomic Review, 46, 1423–1437.
RABIN, M. (1993): “Incorporating Fairness into Game Theory and Economics,” American Economic Review, 83, 1281–1302.
SELTEN, R. (1967): Die Strategiemethode Zur Erforschung Des Eingeschr¨ankt Rationalen Verhaltens im Rahmen Eines Oligopolexperimentspp. 136–168. J.C.B. Mohr (Paul Siebeck), Th ¨ubingen.