HAL Id: hal-00464051
https://hal-mines-paristech.archives-ouvertes.fr/hal-00464051
Submitted on 16 Mar 2010
HAL is a multi-disciplinary open access
archive for the deposit and dissemination of
sci-entific research documents, whether they are
pub-lished or not. The documents may come from
teaching and research institutions in France or
abroad, or from public or private research centers.
L’archive ouverte pluridisciplinaire HAL, est
destinée au dépôt et à la diffusion de documents
scientifiques de niveau recherche, publiés ou non,
émanant des établissements d’enseignement et de
recherche français ou étrangers, des laboratoires
publics ou privés.
A method for the determination of the global solar
radiation from meteorological satellites data
Daniel Cano, Jean-Marie Monget, Michel Albuisson, Hervé Guillard, Nathalie
Regas, Lucien Wald
To cite this version:
Daniel Cano, Jean-Marie Monget, Michel Albuisson, Hervé Guillard, Nathalie Regas, et al.. A method
for the determination of the global solar radiation from meteorological satellites data. Solar Energy,
Elsevier, 1986, 37 (1), pp.31-39. �hal-00464051�
Solar Energy Vol. 37, No. t, pp. ft-fl, tltO Printed io the U.S.A.
1. INTRODUCTION
Though the global radiation measurements network
in developed çountries is still in progress, the av-erage distance between stations in Europe is about 100 km and is thus too large for the current appli-cations of solar meteorology. In many other parts of the world the networks are even sparser, espe-cially over the oceans.
On the other hand, meteorological satellites pro-vide extensive and frequent observations of the
earth-atmosphere system, both in the visible and
in-frared wavelengths. The ground resolution depends upon the satellite sensor and the latitude of mea-surements, and varies from I to 5 km; the period
ofobservations ranges from 30 minutes to 12 hours.
Adequate processing of these data provides a wealth of information useful in the production of solar energy indices, particularly for those areas where no traditional means of observation are avail-able. Besides their usefulness in solar energy en-gineering, such global radiation atlases provide new scientific information. For example, they can be used in climatology studies which require accurate data on the ocean heat flux balance, in which the sun radiation plays a major role.
Both the Solar Energy R&D of the Commission of the European Communities (Project F) and the Agence Française pour la Maîtrise de l'Energie (AFME) are involved in the determination of global radiation using satellite data. This paper presents the work carried out by the authors under these auspices.
Methods for estimating the global radiation at ground level using satellite data can be divided in two categories: a statistical approach based on
re-I Now with Thomson-CSF in Cagnes-sur-Mer. t Now with INRIA in Sophia-Antipolis.
0038-092X/86 $3.00 + .00
O 1986 Persamon Journals Ltd.
lations between satellite and ground data and a physical approach using radiative transfer models to formulate a relationship between satellite and ground measurements.
While more likely to be precise when applied to small areas, statistical methods are usually less gen-eral and require comparison with ground data. The work of Tarpley[l] is perhaps the best known of these methods. On the other hand, physical
meth-ods use simple models, because satellites only
mea-sure a few parameters arnong the many that govern radiative transfer. The best known methods are cer-tainly those of Raschke, Preuss[2] and Gautier er al.l3l.
The approach now developed here is of a sta-tistical kind. A training set of ground data is re-quired to determine the parameters of the regres-sion model, which in turn will predict the global radiation. The basic idea of this method is that the amount of the cloud cover over a given area sta-tistically determines the global radiation for that
area. Thus, the processing is divided in two steps.
A cloud cover index is first derived for each loca-tion (i, 7), called a pixel, of the original satellite image and subsequently used in a second step for a statistical estimation of the global radiation.
In preparation to the determination of the cloud cover index, a reference map of the planetary al-bedo for clear sky is constructed and updated daily. The cloud cover index map is then derived from the comparison of the current satellite image and the referençe albedo map. Following this determina-tion, the atmospheric transmission factors are com-puted using pyranometric data and a statistical regression between these factors and the cloud cover index at the same locations is then per-formed. Finally, the global radiation map is com-puted on a refined grid using an interpolation tech-nique between ground stations.
A METHOD FOR THE DETERMINATION OF THE GLOBAL
SOLAR RADIATION FROM METEOROLOGICAL
SATELLITE DATA
D. CaNo,t J. M. MoNcrr, M. Alnursson, H. Gurr-r-erof, N. RBces and L. Walo Centre de Télédétection et d'Analyse des Milieux Naturels, Ecole Nationale Supérieure des Mines
de Paris, Sophia-Antipolis, 06560 Valbonne, France
(Received 17 April 1985; revision received 1 October 1985; accepted 3 January 1986) Abstract-A statistical method is presented for the determinatiou of the global solar radiation at ground level. It makes use of data from the meteorological satellites, which provide extensive coverage as well as adequate ground resolution. In the first step, a reference map of ground albedo is deduced from the time-sequence of satellite images. Then, by comparing the satellite data with the computed albedo map, a cloud coverage index is determined for each ground point of5 km x 5 km. This index is linearly correlated to the atmospheric transmission factor. The regression parameters are estimated using a training set provided by ground pyranometers. Tests for two different time periods show a good agreement between the actual and model-derived hourly global radiation.
' i l ; i . , : l r t . l lf:-'1.:o; --l E a i - | ;,":-,:.\4.,. : ' i : l . ' , , , : i . j i ; 1
32 D. CeNo et a/. i . . r l . ' ):::.... : .'l ;,3,a; a,;). . , ; a : i . ' . : < j
:.:..
-'.
: i l . , . " . : l li,"1r:i1,-;,',. . , . - i . . . ' , . , i l . . . . i : " : - r - - ; : a r ' .1 -.11
I
I 2. SATELLITE DATAThe basic remote sensing data are taken from the geostationary satellite Meteosat observations, both in the visible and the thermal infrared spectral ranges. Each satellite image is preprocessed using geometric correction with landmark correlation, noise filtering, and normalization of digital counts by the direct spectral irradiance which would be measured on an horizontal plane located at each pixel under a clear sky.
Because the digital counts can be directly related to the upward radiance, this normalization is equiv-alent to the computation of a bidirectional reflec-tance factor. Furthermore, since most continental surfaces may be considered as lambertian for the observation angles under concern (except for water and snow) within a small error, the transformation is equivalent to the computation of an image of the albedo of the system clear sky-ground (planetary albedo for clear sky) with variable cloudiness. For convenience the planetary albedo for clear sky will be called reference albedo in the following. In fact, the exact relationship between the upward radiance and digital count is unknown, because the satellite Meteosat has no calibration. However, the term al-bedo will be used for convenience.
3. CONSTRUCTION OF THE REFERENCE ALBEDO MAP
Generally, the cloud albedo is greater than the ground albedo, except over snow and some desert soils. Usually, one makes use of this fact in the construction of the reference albedo map by as-suming that, given a satellite image time-series, the clouds are nonstationary and that the minimum value observed at each pixel will provide a refer-ence albedo map.
In this method, the construction of the albedo map is based on the fact that, if the cloud albedo is greater than the reference albedo, then in a time series of satellite images, the appearance ofa cloud in the field of view of the sensor will result in in-creased measured radiance. Cloud detection can thus be performed by the difference between the cloud induced response and the corresponding sig-nature of the ground under a clear sky.
After the clear sky model of Bourges[4], the global radiation at ground G" at instant / is:
G"(t) : Io;(sin v;tt*"r, (l)
where l_oy is the extraterrestrial solar irradiance for
the day under concern, normal to beam multiplied by 0.7; and p is the elevation of the sun.
The parameter a characterizes the total
atmos-pheric transmittance and ranges between 0.14-0. 17
depending upon the geographical location[4]. In this work, a value of 0.15 has been chosen and therefore the irradiance measured by the sat-ellite sensor in absence of clouds and comine from
the system clear sky-ground of albedo p(r) may be
expressed by the following:
E(t) : p(r)16;(sin u)t.r5. (Z)
The various terms of this formula are considered as random variables, in order to take into account the approximate character of the clear sky model and the instrumental noise. The reference atbedo is evaluated at each pixel in a recursive fashion by minimizing the variance of the difference between the measured radiances and the radiances resulting from the clear sky model, the cloudy cases being eliminated at each step.
Under some assumptions, this way of estimating the ground albedo can be justified mathemati-cally[5]. It is assumed that the reference albedo is a stationary random variable p" ofmean p* and var-iance ol, and that the cloud albedo is a Jtationary random variable p. of mean p. and variance ol. If the apparent albedo is a stationary random variable X equal to p" (reference albedo) with a probability P" and equal to p. (cloud albedo) with a probability P., it can be shown that the iterative minimization of the variance of the difference between the ob-served and clear sky model radiances is equivalent to an iterative computation of the mean X of the variable X, with elimination of the cloudy pixels at each step.
7 = Prp, * P"p.. (3)
This convergence property is met if the difference between the means p" and p. is much larger than the standard deviation o" and larger than o.:
F . - F " ) o "
p. - F" ) o..
(4)
In the case of cloud discriminatlon, those con-ditions are typically fulfilled, and the iterative av-erage X converges to the mean ground albedo value p". Two important exceptions are snow and some desert surfaces.
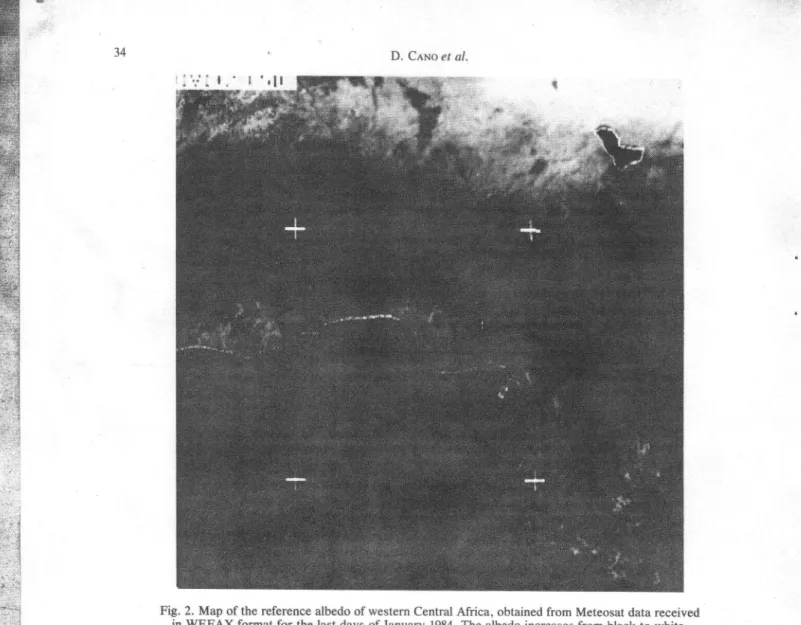
The method is illustrated in Fig. l, which shows the reference albedo map of Europe obtained from ten Me.teosat images of May 1979. Of course, if a cloud layer remained stationary in the time-series, the model hypotheses are not fulhlled, and the ap-parent albedo is the albedo ofthe cloud, as it is the case over Ireland in Fig. l. A second example of satellite derived reference albedo map is given in Fig. 2, which relates to the western central part of Africa for the last days of January 1984.
4. EVALUATION OF TttE ô"O- "o** r*"*
The cloud cover index nî(i, ) at point (i,7) for given time r is defined as a function of the char-acteristic reference albedo p(j,.1), the apparent al-"!
. ..::.
-,..:: i l , j 5 "i,"j
, , I ' ' . , r ; ' j
,...t.,.i
"iri
Determination of solar radiation from satellite data
Fig. I . Map of the reference albedo of Europe obtained from Meteosat data for May 1979. The albedo value increases from black to white. Because the sky was always cloudy over Ireland, the local albedo
is very high, and does not represent the ground albedo.
J J
bedo at the same point as measured by the satellite
p'(i,7), and the average albedo ofthe cloud tops p..
It is computed for each pixel using the following formula:
nÎ(i, j) : (p'(i, "r) - p(i, )l(p. - p(,, "r)). (5) The reference albedo of the Europe area is de-termined in the previous step for each 5 x 5 km2 pixel of the Meteosat image by iterative detection and elimination of cloudy areas. The computation of cloud albedo, p., is performed using the inverse of the previous algorithm retaining only the cloudy areas. The histogram of this "only cloud" image provides an estimation of p. using mode computa-tion.
This cloud cover index ranges from 0 to I and can be interpreted as the percentage of the cloud coverper pixel. It also provides an indicator ofthe transmission of an atmospheric column above the pixel, with low values corresponding to a high transmission factor.
The cloud cover index determination relies on a reliable reference albedo map, which is affected by seasonal variations. In order to take these varia-tions into account, the reference albedo map is up-dated during the processing by weight averaging a new cloud-free pixel with previously determined cloud-free pixels.
However this method does not perform properly when the reference albedo is of the same order of magnitude as the albedo of the clouds. Over
Eu-rope, this is specifically the case over snowy areas. In this case, Cano[S] proposes that an alternate cloud index is dehned using the radiance Â* (i,, measured by the satellite in the thermal infrared spectral band:
n"(i, j) : (R'(t, J) - R"XR. - R")), (6)
where R. is the radiance of the clouds, and R" the radiance of cloud-free snow areas, both determined using image histogram in the thermal infrared. However no further study ofthis alternate approach was performed. In this case the cloud index may become negative in case of temperature inversion
in the lower atmosphere. Also there must be an
ob-jective procedure to decide which of the two ap-proaches should be adopted. None of these prob-lems is presently addressed and the method here
described does not use this alternative.
5. STATISTICAL RELATIONSHIP BETWEEN CLOI]D COVER INDEX AND GROIJND MEASURED TRANSMISSION
FACTOR
The method uses linear regression between the satellite determined cloud cover index and the ground measured transmission coefficient. This simple and efflrcient approach is based on previous work from Bourges[4], and correlations coefficients determined by Pastre[6] between sunshine duration and cloud cover index.
J 4 D. Cer'ro et a/.
Fig. 2. Map of the referenc€ albedo of western Central Africa, obtained from Meteosat data received in WEFAX format for the last days of January 1984. The albedo increases from black to white.
't*::
æ
, . . , . . i - . i t : 1 : ' : t ' è : . - _ r j j ! I j - l . r l l . : ' l : . : à : : : : , i . . , , ; ' ; i l ; ] i l . : . : 1 . ' I -:. r-,tr!---'-. r-,tr!---'-. : i : . ' -: -: r i t - , : , /-.:i. t. -:i - i j i 3 j . : : , 4 1 . . ; r - , . - _ i ' r':- .-: ' . - . ' l : , ' , i . ': '.'':'.:' '' : : a . r - I ' :.-'i - +1, - 14 ï : - ' - . d : . E : - : , . - . : - t r j i ! , : - 4 : r . ' - i E ' i l i " - : ' l ' J : - , . : : : ; : . ! , . ' : ; ] i i : ; : . " - . i . ï " - t : : - . 1 : - ; ; . l : iis defined as the ratio of global radiation at ground on a horizontal surface G(i, j) to the horizontal ir-radiance outside the atmosphere Gs(i, j):
K(i, j) : G(i, r)lco1, i. Q)
This quantity ranges typically from 0.2 to 0.8. If one interprets the cloud cover index n'(i,7) as the percentage of pixel covered by clouds, the global ground irradiance at time / is expressed as a linear combination
G'(i,i): nt(i,i)G6(i,i) + {l - nt(i,i\)G"(i,t), (8)
where Ga and G. are the global ground irradiance for overcast and clear skies, respectively.
For each of these extreme conditions, one can define a transmission factor, respectively K6 and K., which is supposed to be constant for a given hour. This realistic hypothesis leads to the follow-ing linear relation:
K(i,j) = n' (i,i)Ku1 J + 0 - n' (i,i))K"(i,j)
: n'(i,j)(KoQ,i - K.(i,j)) + K"(i,ù (9)
: a(i,j)n'(i,i + b(i,i).
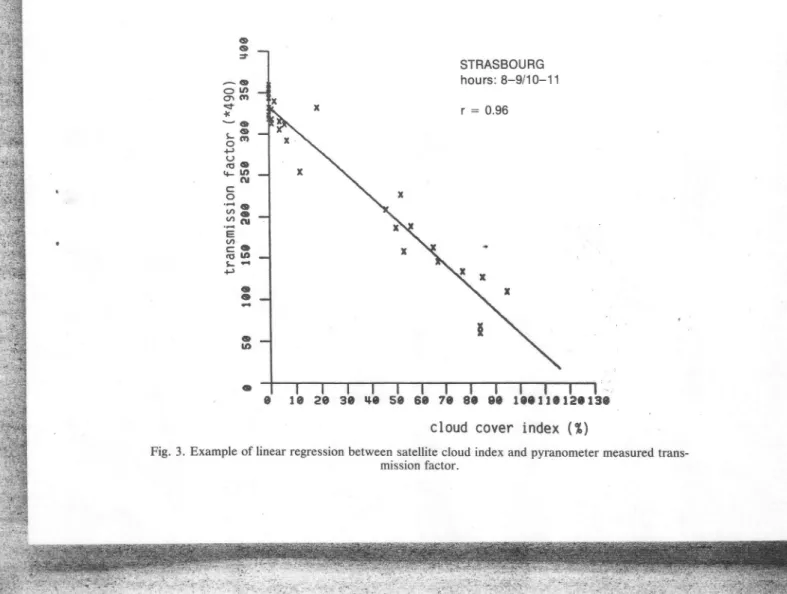
In order to test the linear relationship between the cloud cover index and the total transmission factor, measurements of hourly global irradiation during May 1979, provided for 27 French stations by the French Meteorological Office, were reduced
to transmission factors and compared to the closest
5 x 5 km2 pixel in the image with a location root mean square (r.m.s.) error less than haH a pixel. The correlation coefficient is almost everywhere greater than 0.80, thus indicating that the hypoth-esis of a linear relationship can be relied upon (Fig. 3).
6. DETERMINATION OF HOURLY GLOBAL RADIATION AT GROI,JND
The previous step provides for eaoh pixel and hour time interval t, the coeffrcients a(i,.1) and b(i, "l), defining a linear regression between the trans-mission factor K'(i, j) and the cloud cover index n'(i, J) determined from satellite. Once these coefficients
are known at the ground stations, a method of in-terpolation (krigeage) between the stations is ap-plied in order to defîne the complete field of coef-f,rcients a and b for the studied area and for each hour interval.
'Determination of solar radiation from satellite data
7. ACCI]RACY OF TIIE METIIOD IN PREDICTING THE GLOBAL RADIATION
If it is assumed that the f,reld of coefficients d and b for each pixel is stable in time or slowly
vary-ing on a seasonal basis, it is thus possible to
esti-mate the transmission factor for each new image as follows:
R'(t, i) : a(i, i)n'(i, i + b(i, i. (10)
The estimation of the hourly global radiation is then deduced as follows:
G^ti,
t"l = R'ti,i)Go(t,
r.
( 1 1 )
In order to test this model and to estimate its accuracy in predicting hourly global radiation, val-idations were performed using data from France and Europe. The data sets were split into a training period and an estimation period covering the next 7 days. During the training period, ground mea-surements of hourly global radiation were used to determine the coefficients a and à for the 27 stations over France in May 1979, and for 89 stations over Europe (April 1982). These coefficients were then used to predict the hourly global radiation during the estimation period for a pixel size 5 km x 5 km. Finally, estimated and measured values were com-pared and the errors computed.In the first test, the training period lasted 7 days (5-12 May), and the estimation period ran from 13 to 2l May. The hourly periods were: 8-9h, l0-l lh,
l2-13h. The correlation coefficient between mea-sured and estimated values is in most cases better
than 0.8 (Table I and Fig. 4). The r.m.s. ranges from
14 to 72 Jlcilf Q9 to 200 Wh/m2) with an average value of 42 Jlcm2 (117 Wh/m2).
In the second test, prediction was performed on 24-30 April, using the 1-23 April 1982 for training. The hourly periods were 8-9h, ll-lzh and 14-15h. The estimation errors are presented in the form of an histogram for each hourly period and for the whole set of stations (Fig. 5). The r.m.s were re-spectively 18,24 and 23 Jlcmz (50, 67,64 Wh/m2). The bias (systematic error) is null like for the hrst test.
The results of the second test are much better, likely due to the greater similarity in conditions dur-ing the traindur-ing and estimations periods.
CONCLTJDING REMARKS
A simple method for estimating the global ra-diation has been developed and tested. The method, which relies on the prior determination of a referençe albedo map, is statistical in nature and avoids the difficult problem of satellite data cali-bration. In addition to the albedo determination, the foundation of the scheme is the linear relationship between the hourly transmission factor measured at the ground and the cloud cover index computed from the Meteosat data. The root mean square error of reconstruction of radiation at ground stations scattered over France and Europe has been dem-35
f'{
i:t{.;r:il: ' ; : : l * : : i : - r : l ;';i' :' .' .ii:
o (t=
^ a C) Ut o\ (lr st*
. o à d l PH .
q- u, ôr c o ' = o Y l o -, ôl E tn. - O ( o 1 , ' +J O {t o tncloud cover index (f)
Fig. 3. Example of linear regression between satellite cloud index and pyranometer measured trans-mission factor.
: : J : ]
D. Cel*o et al.
'
tb)
Fig. 4; Examples of relatlon betrveen satelite dedved and ground measured houdy Slû-bal irradiâtion.
, r t t l 36 GI E
()
.:
.Ë
o +t rt, ortr - L {t o o ctt :let c, L=
("
IUg
.l o + C to cl o o aft o Ûtù
o O ûl o rrt I (t a tâ O (a) (t o t{}
10 * (ll (\l E - ( , O È o; .
.; I,' + , î l . t ' . E o : u a > ô l |! !t 6D ( ' r â ot 9 o ! v o=
-v, .tt É o to ODeterminaition of solar radiation from satellite data
llcn?
Jlcn?
Fig. 5. Error reconstruction histograms ofhourly values ofglobal radiation (a : g-9h; b : ll-l2hl c : 14_l5h). 37
N : ,178
o z 17.6 N : 5't9 o : 23.5 N : { 3 6 o : 2 l J38 D. CaNo el a/.
Table I' Statistical results of comparison between satellite derived and ground measured hourly global radiation using the 27 stations of the French Meteorological Office. Prediction was
performed on 13-21 May 1979, period using the previous 7 days for training
STATION CORRELATION COEFFICIENT R . M . S . ( J / c m ' ) 1 8 l 9 20 2 l 2 2 23 24 2 5 26 27 AVERAGE . 9 8 6 . 9 6 8 . 9 7 8 . 9 2 2 . 9 3 8 . 9 1 0 7 l q . 9 5 6 . 8 9 5 . 7 7 7 . 9 1 4 .96r . 7 1 3 .964 . 8 5 1 .966 .943 . 8 5 3 . 4 8 4 . 8 6 3 .962 .805 . 9 1 9 . 8 1 6 .928 .806 . 9 6 1 . 8 7 1 1 4 . 3 2 7 . L 2 4 . 5 3 4 . 7 2 8 . r 4 5 . 6 5 5 . 3 2 6 . 4 5 0 . 1 6 9 . 2 3 6 . 8 2 4 . 8 7 2 . 9 2 6 , 3 4 4 . 8 2 2 . 3 3 6 . 3 s6.4 7 2 . 1 5 5 . I 28.2 6 0 . 5 4t.4 5 7 . 2 3 6 . 0 s 8 . 5 2 8 . 3 42.2 I 2 4 5 6 8 9 l 0 i l L 2 t ? I 4 1 5 1 6 I 7
onstrated to be around 30 J/cm2 (83 Wh/m2) for global hourly values.
These results clearly demonstrate that satellite data can be used successfully for mapping both the global radiation at ground level and the cloud cov-erage over very large areas, with a ground resolu-tion of 5 km x 5 km. The satellite derived data display details of the mesoclimatic variations of the global radiation over the land. Such information is ofparticular value in at least five instances. It is a great help in countries where the solar radiation monitoring network is well developed, because it offers an opportunity to interpolate between ground stations and study mesoscale problems. In other parts of the world, such as Africa, satellite data
of-fers the only opportunity to map the solar radiation over large areas. They also provide vital new in-formation over the oceans, where, for the moment, only a few measurements are available, and no global radiation map could be produced. lndeed, these satellite derived data should make a
substan-tial contribution to the assessment of the earth
ra-diation budget.
In solar building architecture, l5-50Vo of the thermal energy can be derived from solar energy, depending on the seasonâ.l variations. However, this can only be fulfilled after correct dimensioning of storage and regulation devices. These engineer-ing parameters require a precise knowledge of the amount of solar radiation impinging on a wall, a
. Determination of solar radiation from satellite data 39 glass pane or a roof as an instantaneous value as
well as describing its variations over daily and sea-sonal cycles.
Following this research phase, an operational system should be set up for routine production of global radiation maps or derived data (cloud cov-erage, albedo). The first effort reported was by Gautierl7] who mapped the hourly global irradia-tion for the southeastern Canada and northeastern United States of America. She published maps of the daily global irradiation averaged over a month for May and October 1978, and also for thirty days scattered in spring (April-June 1978). In progress is the effort of the Heliosat station team, in Ecole Nationale Supérieure des Mines de Paris in Sophia-Antipolis (France). The data from the Meteosat sat-ellite are directly received and processed following a procedure derived from the method hereby pre-sented. The Heliosat station'is working since Jan-uary 1983, and is due to continue in 1985. This scheme produces a map of the hourly global irra-diation over Europe three times a day, and, since 1984, over the western central Africa. However, some problems remain and must be solved if the method is to be applied on a worldwide basis. Of particular diffrculty are the problems of sand winds and of dry mists in Africa, for which specific studies have just begun.
Acknowledgements-This study was undertaken under funding of the Commission of the European Communities and of the Agence Française pour la Maîtrise de l'Energie. The authors are grateful to the referee who improved the clearness of the present paper.
REFERENCES
L J. D. Tarpley, Estimation incident solarradiation at the surface from geostationary satellite data. Journal of Applied Meteorology IE, ll72 (1979).
2. E. Raschke and H. J. Preuss, The determination of the solar radiation budget at the earth surface from satellite measurements. Meteorology Rdsch 32, 18 (1979). 3. C. Gautier, G. Diak and S. Masse, A simple physical
model to estimate incident solar radiation at the surface from GOES satellite data. Journal of Applied Mete-orology 19, 1005 (1980).
4. G. Bourges, Courbes de fréquence cumulées de I'ir-radiation solaire globale horaire reçue par une surface plane. Report of Centre d'Energétique de I'Ecole Na-tionale Supérieure des Mines de Paris, (July 1979). 5. D. Cano, Etude de I'ennuagement par analyse de
sé-quenc€s d'images de satellite. Application à l'évalua-tion du rayonnement solaire global au sol. Thèse 3ème Cycle. Ecole Nationale Supérieure des Télécommun-ications (1982).
6. C. Pastre, Développement d'une méthode de déter-mination du rayonnement solaire à partir des données de Meteosat. La Météorologie,Yl, A,5 (1981). 7. C. Gautier, Mesoscale insolation variability derived
from satellite data. Journal of Applied Meteorology 21, 5l (1982).