Report 1.1.5
Specific study on freshwater greenhouse
gas budget
Draft,
November 2006 Not definitive
Report Editing:
Michel Meybecka, Gwenaël Abrilb, Séverine Roussennaca Contributing authors:
Behrendt H.c, Billett M.F.d, Billen G.a, Borges, A.V.e, Casper P.c, Garnier J.a, Hinderer, M.f, Huttunen J.g, Johansson T.h, Kastowski, M.fi, Manø S.j
a UMR Sisyphe 7619, Université P. et M. Curie, boite 105, 4 place Jussieu, 75006 Paris (France) b Université Bordeaux1, CNRS, UMR 5805 EPOC. Avenue des Facultés, F 33405 Talence (France) cLeibniz-Institut of Freshwater Ecology and Inland Fisheries, Berlin (Germany)
dCenter for Ecology and hydrology Edinburg (UK)
e University of Liège, Chemical Oceanography Unit, Institut de Physique (B5), B-4000 Liège (Belgium) fInstitut für Angewandte Geowissenschaften, Technische Universität Darmstadt (Germany)
g University of Kuopio (Finland) h University of Lund (Sweden)
i Institut für Geophysik und Geologie, Universität Leipzig, Germany j Norsk institutt for luftforskning Postboks 100 2027 Kjeller (Norway)
CONTENTS
1.
Description and functioning of the European waterscape ... 3
1.1. The River system structure ... 4
1.1.1. Natural conditions at Holocene ... 4
1.1.2. European rivers and their regimes... 6
1.1.3. Distribution of European lakes and reservoirs ... 7
1.1.4. Floodplains ... 9
1.1.5. River-ocean interface: European estuarine systems... 10
1.2. Anthropisation of Europe’s river system ... 17
1.2.1. Altered structure of river systems ... 17
1.2.2. Alteration of river flow regimes by Human activities... 18
1.2.3. Reservoirs... 19
1.2.4. Examples of Human pressures on European river systems: the EUROCAT example 20 1.2.5. Human alteration of estuaries... 21
1.3. The European river catchments and its linkage to regional seas ... 22
1.3.1. Main characteristics of Europe’s Regional Seas catchments: runoff... 23
1.3.2. Europe’s Regional Seas Catchments: population pressure. ... 24
1.3.3. Suspended sediment distribution in Europe’s coastal catchments ... 24
1.3.4. Distribution of estuarine types in Europe... 24
1.3.5. Distribution of European river catchments per estuarine types ... 26
2.
Carbon transport in river systems ... 27
2.2. Organic pollution and carbonaceous pollution ... 28
2.3. Eutrophied rivers and autochtonous fluvial carbon ... 31
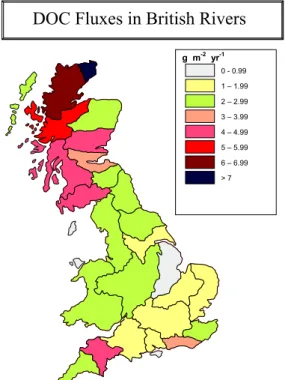
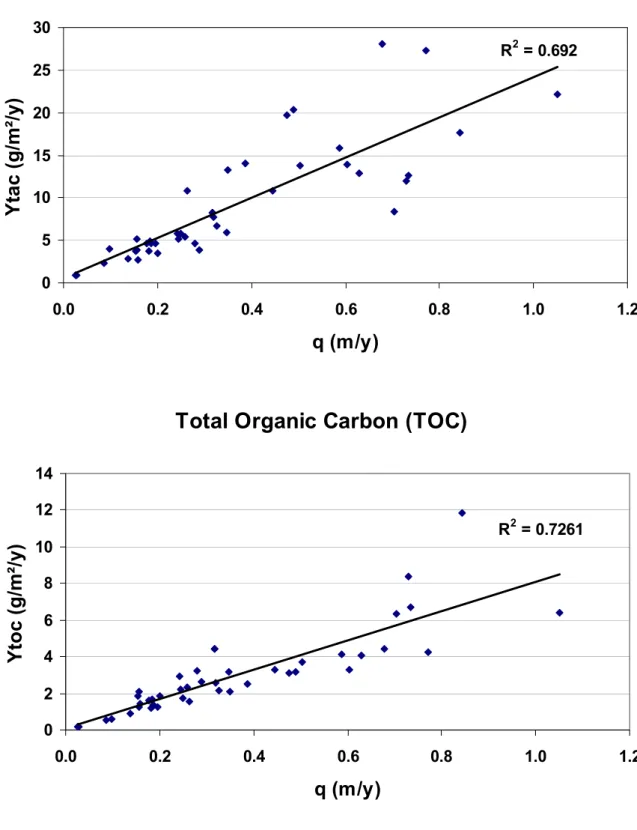
2.4. Organic carbon distribution and trend: the British example ... 33
2.5. Carbon levels in European rivers ... 34
3.
Carbon cycling within river systems and GHG origins and pathways... 36
3.1. Mineralisation of organic carbon in the aquatic system... 36
3.1.1. Importance of water residence time ... 36
3.1.2. The riverine organic carbon transfers... 37
3.1.3. Particulate organic carbon degradation in estuaries... 39
3.2. Gaseous transfer of CO2 and CH4 in aquatic systems ... 41
3.2.1. Gas exchange processes and their control... 41
3.2.2. Measurement techniques of CO2 and CH4 transfers ... 44
3.2.3. Gas transfer velocity in estuaries ... 48
3.3. Green House Gas emissions in natural and man-made water bodies ... 50
3.3.1. CO2 and CH4 emissions from headwaters and peatland streams... 51
3.3.2. Temporal variations of GHG in lakes ... 54
3.3.3. Carbon cycling and CO2 and CH4 emissions in lower rivers and estuaries ... 55
3.3.4. CO2 and CH4 transfers in estuaries ... 58
3.3.5. NOx produced by denitrification in river systems... 61
3.4. Carbon storage within river systems... 63
3.4.1. Carbon storage in lakes and reservoirs... 63
3.4.2. Long-term carbon accumulation ... 64
4.
Carbon and GHG budgets of river systems at the European scale... 66
4.1. River carbon budget... 66
4.1.1. Methodology used for the CarboEurope River Carbon Model ... 66
4.1.2. Estuarine filters and net river fluxes to the oceans... 67
4.1.3. River carbon levels and fluxes per estuarine types for Europe ... 70
4.1.4. Net river carbon budgets to coastline zone after their estuarine filters for Europe 73 4.1.5. Net river carbon fluxes to three European mega regions ... 73
4.2. Europe budget of GHG emissions from continental waters... 77
4.2.1. Methodology and distributions of water type ... 77
4.2.2. GHG emissions rates... 79
4.2.3. GHG emissions from Europe’s water mirrors... 80
5.
Limits of present budgets and recommendations ... 86
5.1. Spatial resolution issues ... 86
5.2. Hypotheses on future evolution of riverine carbon fluxes at the Anthropocene... 87
1. Description and functioning of the European waterscape
Landscape and waterscape may partially to totally retain and/or process the material that is continuously transferred by waters at the surface of continents. These processes include the particulate matter settling, the biological uptake, the bacterial transformation of organic matter and sulphur and nitrogen species leading to gaseous products (e.g. CO2, CH4, H2S,
NOx, N2). These combined processes are often regarded by biogeochemists as “retention
processes” while Earth Systems modellers would rather consider these processes in terms of “filtering capacity” of surficial transfers. Since some important compounds are actually not retained but released to the atmosphere, it seems more appropriate to use “filtering capacity”. In addition to these filters, the drainage network also constitutes a biogeochemical reactor, while the matter is continuously transferred from head waters to river mouth.
Several types of filters should be considered, however, as it will be seen, they are rarely coexisting at their maximum capacity in a given river catchment/estuarine system.
Five major types of natural filters, soils, wetlands, lakes, floodplains and estuarine systems and two types of man-made filters reservoirs and irrigated land are commonly considered (Figure1.1.A&B).
The wetlands considered in this figure are mostly those occurring in headwaters (smaller stream orders): the other natural wetlands are not individually considered, they are associated with lakes, floodplains and estuaries.
In this chapter, we are first considering the European river systems and their functioning in natural conditions, then under anthropic pressures (the so-called Anthropocene era), finally we present the European river catchments and their linkage to Regional Seas.
Figure 1.1.A. Schematic cascading filters within the river catchment/estuarine systems in natural conditions. * headwaters wetlands (other wetland types are included in
lake, floodplain and estuary). Each filter type may store particulates, transform C, N into gaseous forms and is exposed to multiple biogeochemical cycles.
Biogeochemical cycling within catchments filters. Biogeochemical cycling within river network.
SOIL WETLAND
*
LAKE FLOODPLAIN ESTUARY
OPEN COAST
GAS INPUT TO THE ATMOSPHERE
Figure 1.1.B. Schematic cascading filters within the river catchment/estuarine systems in present- day conditions, including new filters (Res =reservoirs, Irrig. Land =
irrigated land) and reduction of natural filters (wetlands, floodplain). * headwater wetlands (other wetland types are included in lake, floodplain and estuary). Biogeochemical cycling within catchments filters. Biogeochemical cycling within river network.
1.1. The River system structure
1.1.1. Natural conditions at Holocene
The levels and fluxes of organic carbon in river basins and the related GHG emissions from aquatic systems depend on several sets of factors: (i) the water pathways at the very fine scale (10-3 - 10-1 km), (ii) the meso-scale and megascale spatial distribution and types (100 – 103 km) of water bodies and (iii) their degree of alteration by Human activities. The figure 1.1.1. is an attempt to summarize these major factors for the natural river basins (termed here “Holocene" drivers) and for impacted basins (“Anthropocene”). This distribution is now commonly made by Earth System Scientists following Crutzen (2000, 2002) to distinguish the Holocene period, when only natural drivers were forcing the biogeochemical cycles from the present-day period when many biogeochemical cycles are forced by anthropogenic drivers as CO2 emissions and related Climate Change, Land Use Changes, direct resources uses by
Humans (water, food, etc..) (Steffen et al., 2004; Crossland et al., 2005). This new era concept termed Anthropocene is particularly applicable to river system functioning at the Global scale (Meybeck, 2002, 2003; Meybeck and Vörösmarty, 2005) and, even more, for European waters. It has been proposed that Anthropocene era begins conventionally in 1950 (Meybeck, 2002; Steffen et al., 2004) in river systems.
The levels and export rates (also termed yields: YDOC and YPOC in g.m-2.y-1, equivalent
to t.km-2.y-1) of dissolved and particulate organic carbon in head water streams depend on the fine-scale drainage of soils (#1A and 1B, figure 1.1.1. left part) (Cronan, 1990) and on the
occurrence of peat deposits linked to the last glaciations (#2) that are great emitters of Green House Gases (see CarboEurope Report #8/2004/Specific Study 5). The occurrence of natural lakes whether large, deep and with long residence time (#3A) or shallow, dissected with short
residence time (#3B) is an important sink and filter of carbon species, especially for particulate
species. SOIL WETLAND * LAKE FLOODPLAI N E S T UA RY
RES IRRIG LAND
OPEN COAST
GAS INPUT TO THE ATMOSPHERE
The middle course of river basins is commonly characterized by (i) extended floodplains in which the carbon species are stored, exchanged and GHG are emitted (#4) (Perdue and Gjessing, 1990 ; Richey, 2004) and (ii) by slow-flowing reaches in which dissolved organic carbon can be processed (Meyer, 1990) and GHG emitted, particularly CO2
(#5).
The lower course of rivers is the estuarine zone where freshwater and seawater mix. Estuaries can have multiple types which will be discussed in another section; most of them are also characterized by extended wetlands (#6) such as tidal flats, delta floodplains, coastal lagoons etc. in which carbon species recycling and GHG emissions are again very efficient.
Figure 1.1.1. Schematic transfers and cycles of carbon and nitrogen species in pristine river systems (Holocene) and in impacted systems (Anthropocene). Dominant processes at the Holocene: 1A and 1B Leaching and erosion of soil DOC and POC; 2. Retention of POC and TOC processing in deep alpine lakes (3A) and shallow lowland lakes (3B); 4. Storage/processing/release of C and N species and GHG in river floodplain; 5. Processing of TOC within river channel; 6. Storage/processing/release of C and N species and GHG in estuaries. Dominant and/or additional processes at the Anthropocene: A. Impact of Climate Change and Global Warming on TOC supply from soils; B. Deforestation; C. Afforestation, an other land use changes in uplands; D. Peat exploitation and draining; E. Cultivation and changes of N, P and C supply to streams from agricultural land; FA. Lake eutrophication; FB. Reservoir eutrophication; FC. River eutrophication; G. Storage/processing and GHG emissions in reservoirs; H. Organic wastes inputs from urban sources; I. Floodplain draining, engineering and cultivation; J. Delta draining, engineering and cultivation, waste inputs.
1.1.2. European rivers and their regimes
The lateral carbon transfers within river systems is pulsed by the seasonal variations of high flows and low flows, also called the river regimes. The natural hydrological regimes of European rivers are based on very long term averages over 50 years sometimes, hence the influence of reservoirs or diversions mostly built in the 1950’s is minimised (Unesco, 1969). Moreover we have avoided here the stations for which there was an explicit mention of reservoir influence. The Albanian rivers are the only ones with short (5 y) data sets. The long-term monthly discharges for a selection of medium/large rivers are presented in figure 1.1.2.
Figure 1.1.2. Mean monthly for several major river catchments in Europe (specific discharge in l.s-1.km-²)
The yearly average specific discharges (qi in l.s-1.km-2) in Europe vary from 2 to 40 l.s
-1.km-2, a range which also covers the greatest part of the global distribution of runoff: only the
arid and semi-arid regions (q < l.s-1.km-2) are not found in Europe.
When normalising the monthly discharges to the yearly mean the river regimes can be easily compared (figure 1.1.2.). They illustrates the variations of regimes for each regional sea (Atlantic Ocean and North Sea, including South Norway; Black Sea; Mediterranean; North Europe excluding S. Norway, Baltic and Arctic drainages).
The Atlantic rivers (Tagus, Shannon, Loire, Guadalquivir, Seine, Shannon, Rhine, and Elbe) are all characterised by pluvial-oceanic regimes with maximum flow during winter. The Gloma (Norway) and Kemi (Finland), fed by late snowmelt in May-June, is much different and characteristic of Northern Europe rivers. The Elbe and the Rhine have greater basins and are mixing rivers of different regimes including lake influences and glacial melt for the Rhine. Their complex regimes are characterised by much higher values of monthly normalised runoff
in the summer months. For the Rhine the long-term seasonal variations are very smooth due to the influence of Swiss lakes and to the occurrence of multiple regimes within this basin.
The North Europe’s rivers are characteristics of the nival (snow melt) to glacial (ice melt) regimes. Hence the peak discharges may occur from April (Vistula, Daugava) to August (Jökulsa in Iceland). In these regimes the minimum flows are observed at the end of the frozen period (February and March), i.e. in total opposition with the pluvial-oceanic regime.
The regimes in the Mediterranean basin are actually more variable than one would have thought. The typical pluvial-mediterranean regime with its winter high-flows and its very low summer low-flows, with complete dry-up for the smallest catchments, is not observed everywhere in the basin. The Tiber (Italy), the Ceyhan and the Buyuk Menderes in Turkey (East Aegean, the famous Meandros of Ancient Greeks) are well representative of this regime.
The Danube Po and the Rhone rivers have complex regimes mixing snowmelt, ice melt, lake influence, early autumn rainfall, winter rainfall, and even the oceanic rain influence for the Rhone. As a result these regimes are not much contrasted and are much similar to those observed on the North side of the Alps for the Rhine and Elbe. The Adige and some NE Adriatic rivers have also snow-melt regimes; the Ebro regime was also mixing mountain influences and Mediterranean influences, it is now completely regulated by a reservoir cascade.
The lake influence may be very important in some European catchments where the seasonal variations are very much smoothed by long water residence times. This influence is noted for the Rhine and the Swedish rivers; it is essential in some Finnish basins and in the Kola Peninsula. The Neva River, i.e. the Lake Ladoga outlet, is characterised by the least variable water discharge of all European rivers, probably due to the combination of natural lake effect and weir control upstream of St. Petersburg.
1.1.3. Distribution of European lakes and reservoirs
About 500,000 natural lakes larger than 1 ha were identified in Europe. The water bodies vary in size, both on a surface area -and a volume basis. The majority of the European lakes have a rather small surface area ranging from 1 ha to 1 km². Despite a very uneven distributed database it can be concluded that less than 5 % of all European lakes (in number) have a surface area larger than 1 km².
The lake distribution of Europe’s is very uneven: more than 90 % of lake number and total lake area is found on the northern regions of Europe that have been formerly covered by glaciers and where hard rocks are found, i.e. from Ireland to Karelia. Most of them are found in Norway, Sweden and Finland. Another major European lake district is found at the edge of the Alps massif from France to Slovenia: it corresponds to glacial scour, as for the previous district, but these alpine lakes are much deeper than their northern counterparts, often exceeding 200 m (Leman, Constance, Maggiore, Garda, and Como). They are few major lakes of different origins as Lake Ohrid (tectonic) and Skadar (karstic dissolution) both in the Balkans or Lake Balaton in Hungary. The total natural lake area of Europe (W. Russia included) depends on the size limit of the lake, it is of the order of 105 km2, i.e. about 1 % of the whole European territory but in regions of Finland and Sweden, the lake area proportion (limnic index) may reach 20 %. Largest lakes are Ladoga, Onega, Vänern and Peipus, they are not the deepest ones. In table 1.1.3., main characteristics of a few, well known and data-rich lakes representing different types were summarized.
Table 1.1.3. Very large European lakes and reservoirs (Henriksen and Hansen, 1995).
European lakes dynamics are very variable from North to South and from plains to alpine massifs, following the temperature patterns. Most types of thermal stratification and water mixing that have been described in the limnology literature can be found in this continent with the exception of the tropical lakes that are always very warm and stratified most of the time. Lakes can be mixed when they have equal density throughout the water column (4.0 °C for freshwaters). The most common mixing types are:
• Cold dimictic lakes: they mix twice a year in autumn and in spring after the
melting of lake ice. They are found in Nothern and Central Europe and in mountains regions of Central and Southern Europe.
• Monomictic lakes: they do not freeze and mix once a year in winter.
• Polymictic lakes: in these shallow water bodies, the mixing may occur several
times per year depending on the received wind energy. They are found in South and Central Europe.
In addition to this mixing rules, large shallow reservoirs can be mixed by wind energy and valley reservoirs can also be destratified by incoming river floods.
The trophic state of European lakes and reservoirs, i.e. the balance between the primary production that dominates place in the surface waters (euphotic zone) and the bacterial degradation of organic matter that occurs in majority in deep waters (aphotic zone), is highly variable. In natural conditions, nutrients levels (N-NH4+, N-NO3- and P-PO4-3) are
Natural lake Country Area Mean
depth Max depth m m 1. Ladoga (Ladozhskoye) RU 17 670 51 258 2. Onega (Onezhskoye) RU 9 670 30 120 3. Vänern SE 5 670 27 106 4. Peipus RU, EE 3 570 23 47 5. Vättern SE 1 912 39 128 6. Vygozero RU 1 285 7 19 - 24 7. Saimaa FI 1 147 12 82 8. Mälaren SE 1 140 13 61 9. Il’men’ RU 1 124 2.6 10 10. Beloye RU 1 120 4.2 20 11. Inari FI 1 102 14 96 12. Päijänne FI 1 054 17 98 13. Topozero RU 1 025 15 56 14. Oulujärvi FI 893 7.6 35 15. Pielinen FI 867 9.9 60 16. Segozero RU 781 – 910 23 97 17. Imandra RU 845 16 67 18. Pyaozero RU 660 – 754 15 49 19. Balaton HU 596 3 11 20. Lac Léman CH, FR 584 153 310
21. Bodensee (Constance) DE, CH, AT 540 90 252
22. Hjälmaren SE 478 6.1 22
23. Umbozero RU 422 30 115
very low and the primary production is limited (oligotrophy). The water column is close to O2
saturation including in deep stratified waters (hypolimnion). When nutrients levels are increasing due to Human pressures (agriculture, urbanisation), the primary production is less limited and resulting algal detritus are eventually degraded in deep waters resulting in an under saturation of O2. In waters with excess nutrients, particularly excess phosphorus, the
primary production is not anymore limited (eutrophy). Algal detritus that sink in deep waters are actively degraded and the deepest part of the hypolimnion become hypoxic (O2 < 2 mg/L)
and even anoxic until the seasonal or annual mixing of waters (lake overturn) is restoring the oxygen saturation throughout the whole water column. Depending on primary production and algal biomass, an hypertrophic state may develop in extreme conditions (e.g. limited hypolimnion, very high nutrient input, regeneration of nutrients from bottom sediments) and total pigments levels may reach 200 mg/m3 or more, equivalent to about 6 mg/L concentration of very labile algal POC.
Some of the large European lakes have already shifted from their natural oligotrophic state to meso or eutrophic state as L. Vättern, Ladoga (see examples in Annexes A, table A.1.). Reservoirs are also very sensitive to eutrophication when they are built up on river basins with important agriculture and/or urbanization. The Wloclawek reservoir in Poland built in 1968 is a well-known example of hypertrophic state as well for some of the very large Volga reservoirs.
1.1.4. Floodplains
In middle and lower river courses of most European rivers, there is an important floodplain that plays a major role in river flow control, particulate matter settling and biogeochemical processes, particularly for the organic carbon and GHG production (see further, section 2.1).
The functioning of floodplains depends on the water level, i.e. on floodplain morphology and on the water discharge (figure 1.1.4.). The floodplain can be considered as a layer of river sediments from few meters to dozen of meters thick, of various grain size, porosity and organic matter contents, overlaying the river valley bedrock. At the low water stage, the base flow level (BF, figure 1.1.4.) corresponds to a very limited water mirror, most of the water is found in the hyporheic zone, i.e. in alluvial aquifers, where some bacterial degradation of organic matter may occur. At high waters (HW), typically every second year, a certain area of the floodplain is flooded and over bank sediments are deposited with their organic detritus. At very high flows (VHW) occurring every 10 or 20 years, the whole floodplain is inundated and receives river sediments. The coarser sediments have being deposited close to the river main channel.
The interface between the river and the land, the so-called riparian zone has therefore variable limits depending on flood stage. This pattern is particularly observed in natural river channels. In Europe, the construction of dykes, levees and the river channelization for navigation greatly reduces the floodplain extension.
Figure1.1.4. Schematic presentation of floodplain functioning (modified from Mulholland et al., 1990). BF: base flow level; HW: normal highwater stage; VHW: exceptional flood
stage
1.1.5. River-ocean interface: European estuarine systems
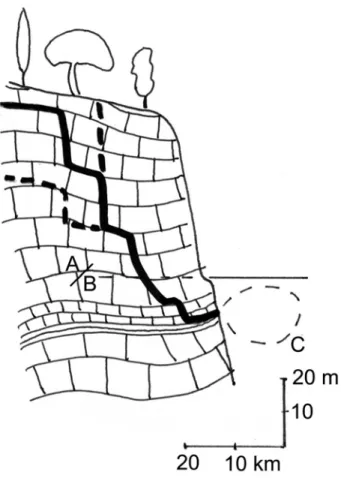
The river/ocean interface is also referred to as the estuarine zone in its broader sense. It corresponds to the mixing zone of freshwaters with sea water. It has actually multiple types depending on coastal morphology, tidal energy, sediment and water supply, such as deltas, coastal lagoons, macrotidal estuaries, karstic groundwater inputs, fjords s.s. in mountains area and fjärds in lowland river mouths on hard rocks. These types are generally very dynamic depending on tidal energy, coastal currents and river discharge. They are associated, excepted in fjords and for karstic inputs with extended wetlands that can be flooded at each tide for macrotidal estuaries, during high river water stage (deltas, coastal lagoons) or during storm-surges events (deltas, coastal lagoons). The size of estuaries (depth, width, length, volume) is also very variable from one type to another and within the same estuarine type. Six main types of estuaries are here differenciated for Europe’s rivers: delta, coastal lagoon, macrotidal, estuary, rias, fjords, fjärds and karstic coast.
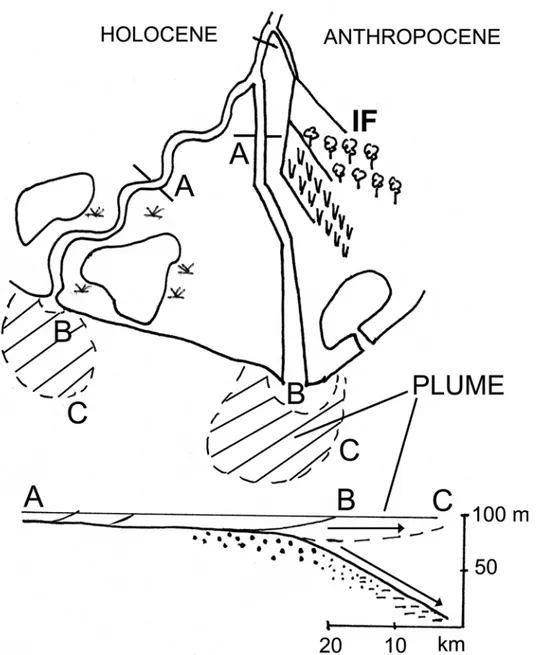
The delta interface
Typical deltas (figure 1.1.5.a.) can be partially stratified during low and medium river flows and are fully mixed during floods. The upper estuary limit at low/medium flow is located mostly inland and the brackish plume of mixed waters is limited outside the delta. During high river flows, the plume may extend for dozens of km in the ocean and the upper estuary limit is.
The fine river detrital particles settle in the distal delta which represent the actual outer limit of the system where riverine POC can still be mineralized. The water residence time of deltas (between A and B limits) is of the order of few days. In Europe, deltas are commonly found in the Mediterranean and Black Seas (Ebro, Rhone, Po, Tiber, Axios, Danube). Undercurrents may transfer river particles to deeper areas.
Figure 1.1.5.a. The river/ocean interface in deltas. Left: non-regulated river course; right:
regulated rivers and irrigated fields (IF). A-B normal extension of brackish waters (1‰ to 90% sea water), A-C range during high water flows.
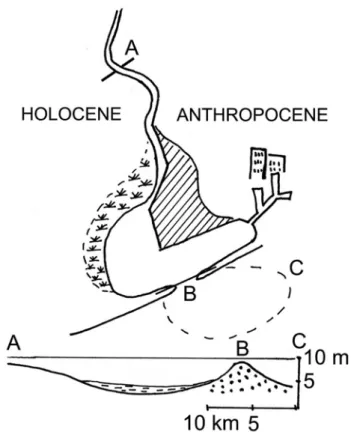
Coastal lagoons interface
Coastal lagoons are generated by sandbars closure (figure 1.1.5.b.). They are very frequent in sandy coasts as the Southern Baltic Sea (Odra, Vistula), Landes and Languedoc in France (Herault, Orb, Têt), North Adriatic (Venice lagoon) and in the western Black Sea.
The brackish areas (between 1 ‰ and 90 % sea water) is extended in coastal lagoons which are shallow water bodies with average residence time from weeks to months, depending on the river discharge. Smaller lagoons that are characteristic of many small river catchments in the Mediterranean Sea may be completely closed by sand bars during the dry period. In natural conditions, lagoons are associated with extended wetlands.
Figure 1.1.5.b. The river/ocean interface in coastal lagoons. Left: unmanaged coast; right:
engineered coast (wetland filling, urbanisation, harbour, artificial coast). A-B normal extension of brackish waters (1‰ to 90% sea water), A-C range during high water flows.
The macrotidal estuary interface
Lowland macrotidal estuaries are a major feature of the North Sea river/ocean interface (Humber, Thames, Scheldt, Rhine, Weser, Elbe) and of the Atlantic Ocean (Seine, Loire, Garonne). In Brittany, Cornwall, and Nothern Spanish Coast, the rias, i.e. drowned valleys, are related estuarine systems.
Macrotidal estuaries are characterized by strong tidal currents that slow down the movement of river water. In such systems, the water residence time ranges from weeks, or less during major floods, to months during low flows despite shallow to medium depths (z < 10 m) in natural conditions. As a result, the total suspended matter (TSS) in the upper part of these estuaries (“inner estuary”) is much higher than in both river and ocean end: in the Estuarine Turbidity Maximum (ETM, figure 1.1.5.c.), TSS exceeds 100 mg/L and may exceed 100 g/L in fluid mud layers, both characteristics of very low salinities (1 to 10 ‰). The ETM is always associated with a marked hypoxia (sag-curve of the O2 longitudinal
profile) resulting from the processing of the most labile organic matter and from the nitrification of ammonia in polluted estuaries (e.g. Seine estuary).
As for the preceding system macrotidal estuaries are regulated in many ways: damming in the upper estuary, upstream of the saline water intrusion (A, figure 1.1.5.c.) in order to limit the propagation of the dynamic tide (TL), dredging of the navigation channel and disposal of dredged material on land or in reclaimed wet-lands, channelization, construction of embankments and harbours, release of organic wastes from cities etc.
Figure 1.1.5.c. The river/ocean interface in macrotidal estuaries. The limit of tidal
influence (TL) is upstream of the limit of salt intrusion (A: 0.1‰ of sea water for 99.9% of river waters). A-B normal extension of brackish waters (1‰ to 90% sea water), A-C range during high water flows. Left: non-regulated estuary, right: regulated estuary.
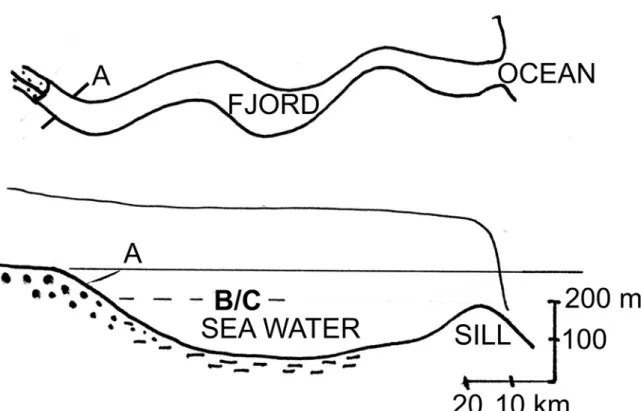
Fjords and fjärds
Fjords originate from glacial scouring and are characterized by their sinuous morphology, their extension (length >> 100 km for some of them), their depth (z > 100 m), and by their steep U-shaped section (figure 1.1.5.d.). For many of them under water sills trap anoxic sea water overlaid by a shallow layer of brackish clear and well oxygenated water. The river water residence in fjords is counted in years, i.e. one to three orders of magnitude difference with most other estuarine types. Fjords can be considered as perfect traps for river particulate
inputs. In Europe, fjords are found in mountainous regions of Norway, Scotland and N. Iceland and N. Ireland.
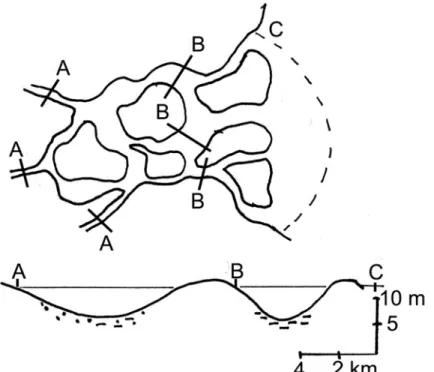
Fjärds have been separated from fjords by some estuarine scientists: they result from the glacial scour on lowland hard rock and are the normal coastal feature of most Sweden, Finland, and Karelia. They lack the steep walls of fjords and are generally shallow systems in association with numerous islands and inlets (Syvitski and Shaw, 1995) (figure 1.1.5.e.). Their freshwater residence time is of the order of week to months depending on river discharge. The freshwater/sea water mixing zone (A/B) is variable and plumes of brackish water can be observed at very high flows, depending on fjärd size.
Figure 1.1.5.d. The river/ocean interface in fjords. A-B normal extension of brackish
Figure 1.1.5.e. The river/ocean interface in fjärds and archipelagos. A-B normal
extension of brackish waters (1‰ to 90% sea water), A-C range during high water flows.
Direct groundwater inputs in karstic regions
When extended limestone regions are bordering the seashore, the continental runoff may reach the sea through direct karstic circulations (figure 1.1.5.f.), not through river systems. These karstic springs may be located at depths reaching 100 m, i.e. the former sea level during the last glaciations. Direct karstic inputs are common in the Mediterranean coast. In Croatia, the Krka is a mixed karstic/ria estuary: the freshwater input is very much decanted and clear and overlays a sea water layer, the water mixing or interface is less than one meter.
The assessment of the distribution of European estuarine type has been based on 5 criteria: (i) lithology of coast at the 0.5 x 0.5 degree resolution; (ii) extension of Quaternary glaciation; (iii) coastline morphology at the 1/1 000 000 scale; (iv) tidal range distribution. This distribution is reported in figure 1.1.5.g.: each 0.5 x 0.5° coastal cell is linked to an upstream river catchment and is part of an European coastal segment according to the global segmentation presented by Meybeck et al. (2006). As such the drainage area runoff and all related attributes of any coastal cell, with its estuarine type, is connected to a river catchment.
Figure 1.1.5.f. The river/ocean interface in karstic system. A-B normal extension of
brackish waters (1‰ to 90% sea water), A-C range during high water flows.
Most types of estuaries are found in Europe. As a result, the dynamics, sediment pattern, oxygenation and ecology of European estuaries are very contrasted, and their related capacity to transfer river carbon and to emit Green House Gases are also very variable. As concern, the carbon cycle and the GHG emissions from estuaries types should be defined for the following characteristics: (i) settling of river particles, (ii) water residence time, (iii) light penetration and related primary production, (iv) direct inputs of organic wastes, (v) level of oxygenation. In a given type of estuary, several subdivisions with contrasted properties can be found (intra-estuarine variations) as for the macrotidal estuaries. The general features of the main types of European estuaries are here compared on the basis of seven criteria: size of water body, particularly the length of the brackish zone, water depth, ratio of inner estuary area/outer estuary area, water residence time, suspended solids concentration, oxygenation and sensitivity to river flow (table 1.1.5).
The brackish zone is here defined by the 0.1 % and 90 % of sea water. It is different from the water mixing interface width which can be very sharp (< 1 m) for some stratified estuaries. For such systems, we are taking into account the longitudinal extend of the stratified layer. Karst inputs correspond to very limited mixing zone excepted during high water periods or after major rain storms when plumes of brackish waters are extended.
All criteria show marked differences from one type to another, from size to oxygenation level. In addition to this intertype variability, some estuaries also present an important intratype temporal variability generally linked to river flow (seasonal regime, peak flows after rainstorms) (table 2.4.2.a) and, for the macrotidal estuaries, to tidal dynamics.
Fjords are probably the most stable systems mostly driven by seasonal temperature variations. Macrotidal estuaries are extremely dynamic combining river flow sensitivity and tidal sensitivity. Lagoons are very sensitive to wind action (water mixing, resuspension).
Table 1.1.5. General features of principal European estuarine types (inner an outer
estuaries). N.A. not applicable. (1) medium length and depth of the common brackish zone (A to B see figures 1 to 6, Appendix C). (2) estuarine turbidity maximum: TSS > 100 to 10 000 mg/L according to depth. (3)outer estuary is here the brackish zone located on the ocean side of the coastline. (4) in fjörds with sills.
1.2. Anthropisation of Europe’s river system 1.2.1. Altered structure of river systems
In impacted systems that characterize the Anthropocene era (figure 1.1.1., right part), the carbon source, sinks and transfers are greatly modified. Global Change (A) includes Global warming and modifications of soil carbon cycling, and changes of water balance particularly the river runoff that is the number one driver of lateral export of carbon species (see CarboEurope Rpt). Deforestation (#B), afforestation (#C), intensive agriculture (#E) and other land use changes are also affecting the transfers of carbon. Peat land draining and exploitation (#D) may also modify the DOC export locally.
Increased nutrients levels in river systems result in eutrophication of lakes (#FA),
reservoirs (#FB) and of slow-flowing rivers (#FC). Reservoirs construction, from the smallest
(area < 1 km2) to the biggest (area > 1000 km2, depth > 50 m, volume > 109 m3), modifies the particulate carbon storage within river basins, the organic carbon microbial processing and increases the GHG emission.
The middle river course is also exposed to the release of organic wastes from cities, whether treated or not (#H). This lead to CO2 emissions in receiving waters. Another very
important feature is the draining and cultivation of former floodplains (#I) often completely isolated from the river course by dikes or levees, or channelled for navigation.
The estuarine part of river systems can also be much affected by channelization and dredging, cultivation, draining and filling of natural wetlands (#J). Estuaries are often privileged sites for the construction of megacities, and are also naturally chosen for harbour construction. In both cases organic wastes can still be released directly in estuarine brackish waters thus enhancing natural hypoxia that occur naturally in macrotidal estuaries.
Finally, the excess of labile organic matter originating from organic waste waters and from eutrophied rivers may be processed in the estuarine zone with subsequent release of
Type length(1) (km) depth (1) (m) Ratio inner/outer estuaries Water residence time (y) Suspended solids concentration
Stratification Oxygenation Sensivity to river flow delta 1 - 100 ≤ 10 low to very
low 10
-3 – 10
-2 medium limited high O2 high
coastal
lagoon 1 – 100 < 10 very high 10 -2 – 10
-1 low/medium limited variable O2 medium macrotidal/ria 10 – 100 ≤ 10 high 10 -2 – 10 -1 ETM (2) none low O 2 at ETM(2) medium fjord 10 > 100 > 100 very high 10
1 – 102 very low high anoxic
layer(4) very low
fjärd 1 – 10 ≥ 10 high 10-1 low medium medium O
2 low
karst inputs 10-2 N.A. N.A. 10-3 – 10
GHG, in addition to the slow process of degradation of resistant organic material originating from soil erosion.
In Europe, estuaries have been privileged for Human settlements since the Roman times and their natural state is often completely masked by Human pressures typical of the Anthropocene era: wetlands draining and filling for agriculture and urban settlements, construction of levees and channel dredging for navigation, construction of harbours and megacities, artificialisation of brackish wetlands for aquaculture, irrigation with diverted waters from the middle and lower river course. As a result, the water residence time of these estuaries can be accelerated by Human activities and the tidal or salt water intrusion is often progressing landwards due to river dredging and channelization. The opposite evolution may also be found in impounded river basins where the water discharge is greatly reduced by diversion and/or irrigation, as for most Mediterranean basins with the exception of the Rhône and Pô rivers.
1.2.2. Alteration of river flow regimes by Human activities
Two Human pressures alter the natural flow regimes in very significant ways. The first one is the retention of river waters in reservoirs –for any purpose as hydropower, flood control or water storage for irrigation- is distorting the natural hydrograph. This distortion is maximum when the retention is close to 6 months: at that stage the minimum natural water discharge may actually correspond to the high discharge stage. This type of distortion –from 3 to 6 months shift in seasonal regime- is often found for large hydropower reservoirs as in the Alps which store water from June to August and release it in December-January at the peak electricity demand. However such distortion does not affect much the annual transfers of dissolved carbon fluxes. Reservoirs greatly after POC and PIC transfers which are stored depending on residence times and reservoirs operation rules (bottom withdrawals are minimizing the particulates retention).
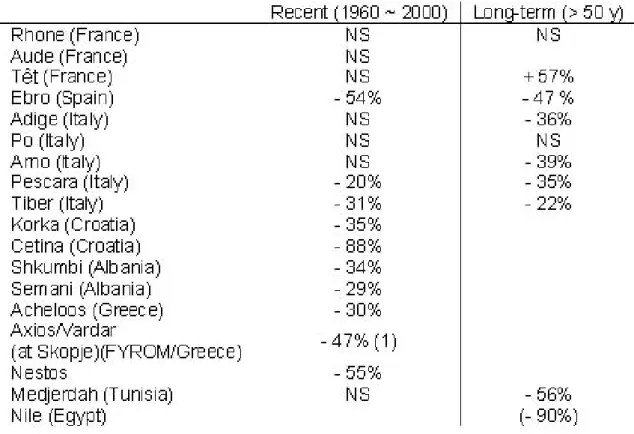
The second important pressure is the consumptive use of water through evaporation and evapotranspiration of vegetal and the water diversion from one basin to another one. These are linked to industrial uses (e.g. cooling of nuclear power plants) and, most of all, to irrigation. As a result, most Mediterranean rivers that are monitored since 1950 or before have current water discharges much lower than in the 1950’s, generally between 40 and 90 % (table 1.2.2.). In such river basins, the reservoirs are numerous and they are named by geographers as “reservoirs cascades” as for all rivers of the Iberian peninsula (e.g. Ebro Tagus), of Sicily and Southern Italy, many Greek rivers and Southern French rivers (Dordogne, Lot, Durance). In reservoir cascades, the lateral transfer of carbon becomes very limited: the particulate species (POC and PIC) are settling in reservoirs. During irrigation, most river TOC is transformed into Green House Gases, mostly CO2, while half of DIC is
converted into CO2; if calcite precipitation occurs in irrigated soils, half of it is precipitated as
Table 1.2.2. Rate of river flow reduction since 1960 for European rivers (Ludwig et al., 2004)
1.2.3. Reservoirs
Manmade reservoirs have been built in Europe since one hundred year. They range from small reservoirs (< 0.1 km2) for local storage of water used in agriculture to biggest
multipurpose reservoirs exceeding 1000 km2 build for irrigation (e.g. lower Volga), hydropower (most large reservoirs), flow regulation and, less frequently, recreation (see table 1.2.3.). In Nordic countries, most reservoirs are related to hydropower while in the Mediterranean river basins, irrigation is their main objective. The exact number of reservoirs is difficult to know as most small ones –the most numerous- are not registered at the national level. In countries like Spain, all major rivers are impounded with multiple reservoirs as the Ebro and Tagus. The same trend is observed in parts of Italy (e.g. Sicily), Greece (Axios, Acheloos, Aliakmon), Southern France (Dordogne, Lot, Durance). The total area of European reservoirs exceeds 50 000 km2, i.e. it is already of the order of magnitude of natural lakes. Yet, most very large reservoirs are located in W. Russia: if these are substracted the total area of West and Central European reservoirs is probably closer to 104 km2, i.e. an order of magnitude lower than natural lakes.
Reservoir depth is also very variable, from few meters to more than 150 m for the deepest alpine reservoirs (e.g. Grande Dixence, Switzerland; Almendra, Spain). But the average reservoir depth is lower than the average lake depth for a similar size class.
The residence time of water in lakes and reservoirs is a key feature for DOC photodegradation and bacterial degradation and for POC settling and storage. In lakes, it commonly ranges from few months for the smaller ones to more than 10 years for the deepest ones. Most medium-sized European lakes (area < 100 km2) have a residence time of less than one year. Largest lakes of glacial origin are characterized by residence times exceeding 10 y (Ladoga, Onega, Vanern, Vattern, Leman, Garda, Zug, Lugano) (appendix B). Volcanic crater lakes, although of smaller size may have a very long residence time (Bracciano 137 y;
Balsena, 120 y). However, such lakes do not intercept large drainage area (1 to 10 km2 typically), there influence on carbon transfers is therefore very limited compared to some alpine lakes that can intercept river basins 5 to 20 times their own area (i.e. 1000 to 10 000 km2).
Many valley-reservoirs have similar or higher interception capacities (10 to 100 times their area). Their residence time is therefore somewhat shorter than lakes residence time –for similar size classes- i.e. from few days to few months. Only the very large reservoirs (e.g. Volga basin) or some of the Alpine reservoirs have residence time up to one year, or even more.
Table 1.2.3. Large european reservoirs (Henriksen and Hansen, 1995)
1.2.4. Examples of Human pressures on European river systems: the EUROCAT example
As for other criteria (hydrological regime, vegetation, lithology, relief…) that regulate carbon transfers in river systems, the Human pressures on European rivers are quite variable although this continent is probably the most impacted one together with parts of Asia (Table 1.2.4).
The population density is one of the key criteria pressures. For medium-sized and large basins (area > 10 000 km2), it ranges between less than 1 people/km2 for some tributaries of Botnian Bay, Barentz Sea and White Sea (e.g. Lule, Kemi, Mezen) to more than 300 p/km2 for the whole Rhine catchment, close to the world’s maximum value for such large
basin (circa 220 000 km2). For smaller watersheds as the upper Scheldt or the Maas-Meuse,
Reservoirs Country Area Mean
depth Max depth m m 1. Kuybyshevskoye RU 6 450 12.6 40 2. Rybinskoye RU 4 450 5.6 30 3. Volgogradskoye RU 3 320 10.1 41 4. Tsimlyanskoye RU 2 702 8.8 - 5. Nizhnekamskoye RU 2 650 4.9 - 6. Cheboksarskoye RU 2 270 6.1 - 7. Kremenchugskoye UA 2 250 6.0 - 8. Kakhovskoye UA 2 150 8.5 - 9. Ijsselmeer NL 2 000 - - 10. Kamskoye RU 1 915 6.4 29 11. Saratovskoye RU 1 830 7.3 32 12. Gor’kovskoye RU 1 591 5.5 21 13. Votkinskoye RU 1 120 8.4 28 14. Kiyevskoye UA 922 4.0 - 15. Ataturk TR 815 - - 16. Keban TR 675 - - 17. Kanevskoye UA 582 4.3 - 18. Lokka FI 417 - - 19. Ivankovskoye RU 327 3.4 - 20. Dnieper UA 320 - 60 21. Hirfanli TR 263 - - 22. Djerdap SB, RO 253 - 92 23. Uglich RU 249 5.0 - 24. Porttipahta FI 214 - - 25. Narva EE, RU 200 1.9 9
the density exceeds 500 p/km2 and reaches 1000 p/km2 in suburban streams. For such river catchments, the organic waste inputs from urban sewage, even normally treated (treatment efficiency for BOD and COD between 80 and 90 %), represent a major contribution to the organic carbon load. Other pressures include land-use as deforestation and cultivation, some industries, particularly agro-industries as sugar factories canning, and the artificialization of river network and damming. In lowland regions, the sea level rise may already be a major coastal issue. The impacts of such pressures on the carbon budget have been mentioned before: they can either increase the organic carbon sources (industrial and urban sewage; eutrophication, active draining of wetlands), decrease these sources (filling of wetlands, cropping), modify the carbon processing during lateral transfer through channelization and reservoir construction, store particulate carbon in reservoirs. The analysis of pressures requires a detailed account at a fine resolution (10’ x 10’ or less) including land cover, population density, industrial sources, damming etc. This analysis is not yet realized for European rivers but is rapidly progressing as for the Elbe-Oder catchments (see section 2.2), and for selected European catchments through various EU projects.
The EUROCAT programme (www.eurocat.ulster.ac.uk/, Pirrone et al., 2005) provides an analysis for such river to coast pressures and impacts for several EU rivers with multiple impacts, the Vistula, Elbe, Rhine, Humber (U.K.), Seine, Po, Idrijca (Slovenia), Axios (Greece) and Provadijska (Bulgaria) : each catchment is different from the others (appendix D, tables D.1 to D.5), the type, magnitude and position of pressures and their impacts on river structure and functioning is very variable. The related impacts on carbon transfers and GHG emissions should therefore also be examined for each individual basin.
Inputs from the catchment Coastal issues affecting GHG and carbon
cycle
Other issues
Nutrients(1) Pollut.
herit.(2) Metals POPs Eutro. Hypoxia Int. sce Coastal erosion SLR IL HAB Pollut. herit.
Vistula ++ ++ + ++ + Elbe ++ + + + Rhine ++ + + + +? Humber ++ ++ ++ + + ++ + ++ +++ ++ ++ Seine +++ +++ +++ +++ ++ Pô ++++ + + ++++ +++ + + ++ Idrijca ++++ ++ ++++ Axios +? +? +? ++ + ? +++ Provadijska ++++ +++ +++ +++? ++
Table 1.2.4.a. Scaled coastal zone issues linked to river inputs in EUROCAT entities.
(1) nutrient sources in these catchments can originate from agriculture, urbanization or from industries, (2) from past mining activities, + to ++++ relative scale of issue for the considered coastal zone
Eutro. : eutrophication, HAB : harmfull algal bloom, Int. sce : internal sources of nutrients and metals from past contaminated sediments, Pollut.herit. : pollution heritage from past mining activities, SLR : sea level rise, IL : intertidal zone loss.
1.2.5. Human alteration of estuaries
Human activities may greatly modify the River/Ocean interface. The table 1.2.5. lists some of these modifications and related examples as described by the E.U. programme EUROCAT (www.eurocat.ulster.ac.uk and Pirrone et al., 2005). Examples of Human pressures on a dozen of European river systems, including their estuaries, are presented in
appendix D. Each estuarine type has its specific alterations, which are schematically presented on figures 1.1.5.a to f. Human impacts may affect estuaries in multiple ways GHG emissions from estuaries are very sensitive to wetland draining and cultivation, wetland filling. These changes also limit the storage of river POC during inundations. On the other hand, the channelization and dredging are accelerating the transfer of river particulate matter through these systems to the outer estuary. Urbanization in estuaries is often resulting in additional inputs of organic wastes even when sewage waters are treated. The impact of aquaculture on estuarine systems, particularly on rias would be a reduction of TOC concentrations through filter-feeding organisms and export of shellfish on land.
One major impact of Human activities is the reduction of river flows to the estuarine systems particularly through reservoir construction upstream of estuaries, water diversion and irrigation of riverine and estuarine flood plains. In the Mediterranean basins, this reduction of water discharge, and all related carbon inputs is commonly between 40 % (e.g. Ebro) and 90 % (e.g. Nile). Types Wetland draining/cultivation Channelization dredging Urbanizatio n and waste inputs Reduction of water inputs(1) Wetland filling Aquaculture delta + to +++ (Ebro, Axios, Po)
++ to +++ (Po, Vistula) + + to +++ (Axios, Ebro, Acheloos, Aliakmon) + to +++ (Vistula, Axios) + (Po) coastal lagoon + + to ++ (Odra, Venice L.) + to ++ (Venice L., Pregolia) + + to +++ macrotidal/ria + (Humber) + to ++ (Seine, Rhine, Provadijska) + to +++ (Rhine, Scheldt, elbe, Thames, Seine, Loire) + + (Seine, Rhine, Humber) + to +++ (Spanish and Britanny rias)
fjord none none limited none none
fjärd limited limited + to +++ (Stocklom Archip., Helsinki Archip.) limited + to ++
karst inputs N.A. N.A. +
(Krka)
+ to +++ ? (Krka)
N.A.
Table 1.2.5. Sensitivity of estuarine types to Human pressures affecting carbon budgets and Green House Gases emissions at the River/Ocean interface with European examples from the EUROCAT project.
N.A. not applicable. (1) through upstream water consumption and/or diversion
1.3. The European river catchments and its linkage to regional seas
The lateral fluxes of river carbon from the European continent to the coastline are constrained by the structure of regional seas basins as the Baltic, the Mediterranean and the Black Sea. Regional seas are defined as semi-enclosed to enclosed portions of the world’s ocean, limited by the topography of the continental coast (e.g. capes, straights) and/or by the under ocean topography (sills, ridges, continental platforms). Regional seas may have
characteristics much different than the portion of ocean to which they are related, as for salinity and average depth. The greatest part of the particulate carbon and most of the dissolved matter including DOC originating from the continents that is carried to regional seas does not reach the open ocean. The main characteristics of Europe’s regonial seas are featured on table 1.3.
North Atlantic /
North Sea Baltic Arctic N. Black Sea N. Mediterranean Europe Total (1) M km2 1.92 1.62 1.63 2.09 0.94 8.2 Basin Area % 23.4 19.7 19.9 25.5 11.5 100 km3/y 723 388 559 328 358 2356 Water Volume % 30.7 16.5 23.7 13.9 15.2 100 Mp 251 78 10.8 163 113 616 Population % 40.7 12.7 1.7 26.4 18.3 100 Mt/y 168 20.3 79 107 284 658 Suspended Sediment % 25.5 3.1 12.0 16.2 43.1 100 Mt/y 2.74 0.64 0.475 0.90 0.95 5.7 Total N % 48.0 11.2 8.3 15.8 16.7 100 Population density p/km2 131 48 6.6 78 120 75.1 Runoff mm/y 376 240 343 157 381 287 N yield t km-2 y-1 1.43 0.40 0.29 0.43 1.0 0.70 Total N mg/L 3.8 1.65 0.85 2.74 2.65 2.42 Table 1.3. Relative weights of European Regional Seas basins (Meybeck and Dürr in preparation). Bold : proportions much higher than the area weight ; Italics : proportions
much lower than the area weight.
(1) Caspian drainage excluded
1.3.1. Main characteristics of Europe’s Regional Seas catchments: runoff.
The highest relief area in Europe is characterized by high runoff. Another control factor of runoff is the proximity to the Atlantic coast and to the N and E Adriatic coast. The water budget for each coastal segment and regional seas is based on Fekete et al. (1999, 2001). This data set includes all European basins and adjacent continents linked to European regional seas.
The limits of Europe’s regional seas and their catchments characteristics have been recently considered (Meybeck et al., 2006). Details are found in appendix E. The drainage area is nearly equally distributed between four catchments, the European part of the Mediterranean Sea catchment is somewhat smaller. The water volume is preferentially discharged by the North Atlantic / North Sea basin, then by the Arctic. It is unexpected to find that the Mediterranean water flux proportion (15.2 % of Europe’s total) is higher than the area proportion (11.5 %), while the Black Sea contribution is relatively lower (13.9 % of water flux for 25.5 % of area). This means that wet mountainous regions of the Mediterranean of Europe fed from the Pyrenees, Alps and Dinarides have a much greater influence on the water budget, hence on all fluxes, than the dryer regions in S. Spain, Italian Peninsula and islands and Greece.
1.3.2. Europe’s Regional Seas Catchments: population pressure.
Pressures on river basins are also much differentiated. The population is essentially found in the North Atlantic / North Sea drainage (40.7 %, 131 p/km2) while the Arctic drainage represents only 1.7 % of the population (d=6.6 p/km2). The total nitrogen flux
originates from the North Atlantic / North Sea for 48 %, nearly as much as the combined fluxes for the rest of Europe (76.6 % of Europe’s drainage basin). Most of this modelled excess total N is linked to the use of industrial fertilizers in North Atlantic / North Sea rivers. These European regional seas combine some of the highest figures at the global scale for human population density (131 p/km2) and the total N yield (1.43 t km-2 y-1), respectively 20 and 5 times more than the Arctic drainage figures (see table 1.3).
1.3.3. Suspended sediment distribution in Europe’s coastal catchments
The database on global scale sediment yield for pre-dammed catchments has been elaborated by Ludwig and Probst (1998). In the Ludwig/Probst model, the lowest yields are expected for the Baltic Sea (Ys = 12.5 t.km-2.y-1) and the highest for the North Mediterranean Sea (Ys = 300 t.km-2.y-1) :
N. Medit. Sea. > Atlantic > N. Black = Arctic > North Sea > Baltic (Ys = 300 t.km-2.y-1) (131) (48) (48) (36) (12.5)
The sediment fluxes are very much contrasted: 43 % of Europe’s fluxes originate from 11.5 % of its area, i.e. the Mediterranean catchment (pre-damming estimates) and only 3.1 % originate from 19.7 % of Europe, i.e. the Baltic catchment.
The river damming, very important in the N. Mediterranean basin greatly modifies the sediment transfer across the river catchment, i.e. the net sediment inputs to regional seas may be actually much lower. The theoretical weighted average Total Suspended Sediments concentrations have also been computed from the ratio between total sediment fluxes and water fluxes for each coastal basin. These average TSS range from a minimum of 35 mg/L for the Botnian Bay and the Gulf of Finland, to values exceeding 1000 mg/L around the Mediterranean or in the South Black Sea (i.e. Turkish rivers). Such 30 times range is possible although the TSS levels in the N and E Baltic may be even lower due to the very high lake retention which may have been underestimated by Ludwig and Probst (1998). The very high TSS for South Black Sea Rivers (prior damming) is possible although values from 500 to 1000 mg/L seem more likely, as for the Mediterranean Basin Rivers.
1.3.4. Distribution of estuarine types in Europe
Ten major types of land/ocean interface, i.e. of estuaries in its broader definition, are considered here: (1) deltas ss with high sediment inputs, (2) karstic coastlines (that may include some small deltas), (3) deltas with low sediment inputs and lagoon formation, (4) lagoons and deltas, (5) ria coast, (6) fjord coast, (7) fjärd coast, (8) macrotidal estuaries, (9) glacierised sedimentary coast and (10) arheic (i.e. absence of river input to the coast, even occasional only found in S. Mediterranean coast). As the categories #3 and 4 are actually very close, and sensitive to human action that may regulate the connectivity between lagoons and open sea; they have been grouped in this first analysis. It has been sometimes quite difficult to classify some catchments. The Po Delta has been considered in the Deltas and lagoons types
due to the numerous lagoons that are found in this system which is also receiving sediments from other Alpine rivers (Adige, Brenta) and Apennine rivers. Yet the artificialisation of this system, particularly its canalisation for navigation, the construction of levees etc. is accelerating the riverine fluxes to the coastal zone and decreasing the filtering capacity of the system, a characteristic of deltas.
The analysis presented here is a first attempt made especially within the CarboEurope project to link the whole European drainage to the ocean -from Iceland to the Pechora basin in N. Russia and from Portugal to Azov Sea- to the estuarine typology (Meybeck and Dürr, in preparation). With such approach, the characteristics of European river catchments can be aggregated by estuarine types and/or the European coastal segments can be decomposed into the different estuarine types (see figure 1.3.4). The total European area considered is thus 8.2 Mkm2; mapping is also realized for the whole Mediterranean and Black Sea catchments.
Figure 1.3.4. Coastal basins linked to 10 major types of land/ocean interface in Europe’s regional seas (Meybeck and Dürr, in preparation).
We are conscious of the simplifications of this analysis: for instance some rias may be associated with macrotides, however their first order characteristic is genetic. The macrotidal systems should be renamed ‘non-ria macrotidal systems’ etc..
The estuarine types are not randomly distributed in European coast. This is not a surprise for Fjords and Fjärds, nor for macrotidal estuaries which can only be found in part of the Atlantic Ocean and in the North Sea. ‘Deltas ss’ and ‘deltas and lagoons’ are more spread throughout Europe at least in 3 or 4 regional seas. The arheic type is only found in the South
Mediterranean Seas (Ionian, SE Mediterranean). It is difficult to give any river examples to the karstic basins: by definition these inputs are subterranean; the Krka estuary in Croatia has been extensively studied in the early 90’s as an example of a mixed karst/ria type.
For each of the coastal segments the accounting of each estuarine type has thus been realised, then the corresponding upstream river network has been delineated and characterised as for the previous analysis (runoff, population, sediment input etc.). The average characteristics or total fluxes of all European river catchments linked to a specific estuarine type are then determined, together with the distribution of these river catchments for each coastal segments.
1.3.5. Distribution of European river catchments per estuarine types
Drainage area
The most important type of river / coast linkage in Europe, in terms of drainage area, is the ‘deltas and lagoons’ type (37 % of Europe’s drainage area) (Appendix G). This estuarine type is mostly found in the NW Black Sea (Danube, Dniestr, Dnepr) and the Azov (Don), in the South Baltic (Oder, Vistula) and in North Adriatic (Po delta and Venice lagoon). The sediment grain size of such deltas is usually finer than the delta type ss.
The second type is the formerly glacierised sedimentary regions found in Barents Sea and the Southern Gulf of Finland (18.4 %). The importance of glaciations in land / coastal zone linkage is illustrated as such: 40,3 % of Europe river basins is presently linked to a coast that has been formerly glacierised and shaped by this process (5.9 % for fjords, 16.4 % for fjärds, and 18.4 % for sedimentary coastline). The glacierised sedimentary rocky coasts are found in the Botnian Bay, the Southern Gulf of Finland, and in the Barents Sea catchment.
The macrotidal estuaries are connected to about 11.2 % of Europe area (Gironde, Loire, Seine, Thames, Humber, Rhine / Maas, Weser, Ems, Elbe). This relatively low ranking is a surprise since this type of estuaries has attracted the attention of scientists over decades, particularly for geochemistry and sedimentology, due to the occurrence of the turbidity maximum in these systems, their long water residence time, and the vicinity of major research institutes.
Pure deltas with high coarse sediment supply are spectacular but they do not correspond to extended drainage (3.0 %). According to this analysis they are generally associated with mountains ranges close to the coastline: Caucasus (NE Black Sea), Alps and Pyrenees (Rhone and Ebro in Balearic basin). This type also occurs in small catchments around the Mediterranean and the Southern and NE Black Sea.
Pure karsts are very difficult to delineate at the 30’ resolution and are generally associated with small deltas (3.4 % of Europe basin area). They are essentially found in the Mediterranean coastal segments.
Rias are found in Cornwall, Brittany, Galicia and part of Portugal (The Tagus estuary has been put into this category) (5.1 % of Europe’s basin area).
None of Europe coastline is arheic: these types are only found in the South Ionian Sea (from Tunisia to Libya) and in the East Mediterranean Basin, outside of the Nile Delta.
Continental runoff
The water balance, on which the computation of continental runoff is based, includes both surficial runoff (river inputs) and groundwater inputs (karts and alluvial aquifers mostly) (see table C.2. in Annex C).
Most of the water discharged from Europe reaches the coastal through the deltas and lagoons types (25.7 %), then through the formerly glacierized sedimentary coast (18.8 %). The macrotidal estuaries receive only 11.4 % of Europe’s waters, less than fjords (14.7 %) and fjärds coasts (14.5 %).
However it must be remembered that Europe’s limits are placed at the Ural mountain range and include therefore the Barents Sea drainage : the weight of Nordic sea catchment is therefore greater than in many European Union statistics that barely consider Northern Russia as discharging into Europe’s Seas.
The average river runoff for each type of estuary is also presented in table C.2. It ranges from about 200 mm/y for deltas with lagoons to more than 700 mm/y for fjords. It was a relative surprise to find that karstic coasts have actually a higher runoff than Europe’s average (445 mm/y vs. 287 mm/y): in this survey they occur mostly in the East Adriatic (Albania coast) and Bay of Biscay, both very wet, thus compensating the dryer karstic coast of Greece and Mediterranean islands.
European population
Due to their relatively high drainage area deltas and lagoons types are under the pressure of 269 M people, i.e. 43.6 % of Europe’s population connected to the world’s ocean (Caspian basin excluded). The macrotidal estuaries type is second with 180 M people, i.e. 29.2 % of the population.
Nordic types with former glacierised coastline correspond all together to only 10.8 % of the population. Only 11.1 M people are connected to fjords sensu stricto.
When combining the filtering capacities of these river estuarine systems it is found that the highest filtering capacities i.e. macrotidal estuaries (pristine conditions) and fjärds are intercepting 208 M people (34 % of Europe), while the lowest filtering capacities i.e. deltas ss + karstic coasts correspond to 59 M people (9.5 % of the population). The rest of Europe’s population is intercepted by river/estuarine types with intermediate filtering capacities.
The highest population density is found on catchments connected to macrotidal estuaries (d=196 p/km2), the lowest ones are observed for the Nordic types (23.1 p/km2 for fjords, 21.2 p/km2 for fjärds and 18.3 p/km2 for formerly glacierised sedimentary coasts).
2.
Carbon transport in river systems
2.1. River carbon species
River carbon origins and ages are detailed on table 2.1 in two broad categories: (i): old particulate carbon resulting from the mechanical erosion of carbonate rocks, this carbon is mostly as PIC but there is a growing evidence of old recycled sedimentary POC and old dissolved inorganic carbon (DIC) resulting from the dissolution of carbonate rocks by acids during weathering reactions, (ii) recent carbon: organic carbon originating from erosion and leaching of soils (DOC and POC) and atmospheric CO2 implied in most weathering reactions :
Reaction 1: non-carbonated minerals + CO2 + H2O →HCO3- + cations + weathered minerals + dissolved silica
Reaction 2: (Ca, Mg)CO3 + CO2 + H2O → 2 HCO3- + Ca2+ and Mg2+
In reaction 1, all riverine DIC originates from atmospheric CO2 and/or from soil organic acids, in reaction 2 only half of it originates from CO2.
Other natural origins of riverine carbon are autochtonous POC resulting from recent debris of algae and macrophytes, particularly in eutrophied rivers. Another autochtonous source of PIC is calcite precipitation when pH exceeds 8,2 which is the commonly case for eutrophied rivers in carbonated basins. Anthropogenic sources of organic carbon are mostly found in organic wastes from agro-industries and cities. The riverine carbon ages counted since the original atmospheric CO2 fixation range from hundred millions years (carbonated rocks) to few days (autochthonous POC and PIC).
Sensitivity to global change
Sources Age (y) 10Flux # 12 g C.y-1 A B C D E F
PIC Geologic 104-108 170 Geologic 104-108 140 DIC Atmospheric 0-102 245 Soils 100-103 200 DOC Pollution 10-2-10-1 (15 ?) CO2 Atmospheric 0 (20 to 80) Soil 100-103 (100) Algal 10-2 (< 10) Pollution 10-2-100 (15) POC Geologic 104-108 (80)
Table 2.1. Origins and ages – since original atmospheric CO2 fixation – of carbon species in rivers. A : land erosion, B : chemical weathering, C : global warming and UV
changes, D : eutrophication, E : organic pollution, F : basin management damming).
The riverine carbon concentration is classically reported in mg C/L. Particulate forms of river carbon can be expressed in mg C/L, yet they are also reported in % C of total suspended solids (TSS), termed here PIC % and POC %. The sum of river carbon species originating from recent CO2 is termed total atmospheric carbon (Meybeck, 1993a):
TAC = DOC + non-fossil POC + 100% silicate weathering DIC + 50% carbonate weathering DIC
2.2. Organic pollution and carbonaceous pollution
The input of organic matter from domestic and industrial waste water to rivers is generally known as «organic pollution» but the term carbonaceous pollution can be used preferred to avoid confusion with organic toxic substances. Such impact has been monitored and modelled through biological oxygen demand BOD5 and chemical oxygen demand COD
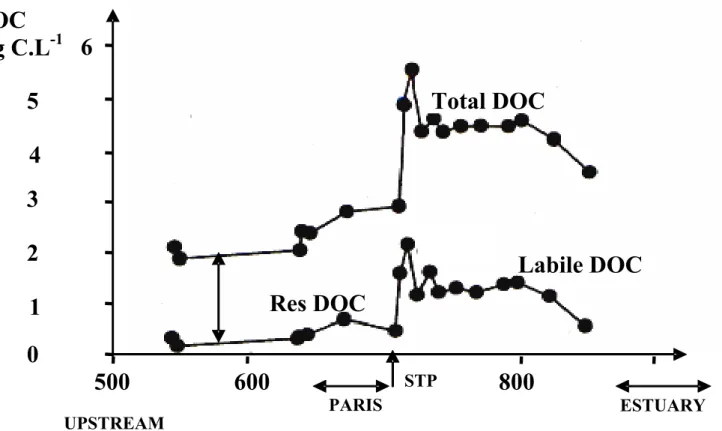
since the 1940‘s, now these indicators are gradually replaced by direct TOC measurements. The impact of a megacity as Paris impact (10 million people altogether) on the Seine River is a good example of carbonaceous pollution. The DOC increases markedly downstream of the release of treated domestic sewage from the gigantic Seine-Aval plant (8 million equivalent people) despite a satisfactory efficiency of this plant (80%) for the TOC
removal (Servais et al., 1998). Then most of the remaining excess DOC is degraded into CO2
within one week before reaching the estuary (figure 2.2.a).
In the more industrialized countries as Western Europe and North America, industrial TOC sources were common until the seventies in some industrials sectors as pulp and paper, agro-industries and others. These industrial wastes have generally been decreased in these regions by at least an order of magnitude, principally between 1960 and 1980.
Figure 2.2.a. Longitudinal profiles of total dissolved organic carbon, easily degradable (lab. DOC) and resistant (res. DOC) in the Seine River across Paris megacity. Most
treated sewage (8 M equivalent people) is injected at KP 700 (STP) (from Servais et al., 1998)
DOC and POC trends in impacted rivers depend on population density, domestic
sewage collection and sewage treatment (both urban and industrial). In most European rivers, there is a marked improvement of oxygenation, i.e. a gradual decrease of TOC, since the 1970’s due to increasing collection and treatment rates as observed for the Thames and Rhine and, later, for the Seine and the Danube.
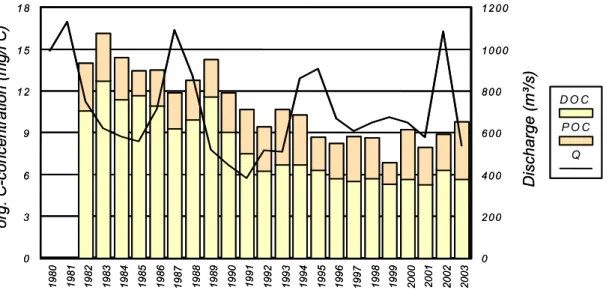
The Elbe River is one of the best example documented (Behrendt, et al., in preparation) (figure 2.2.b). From 1982 to 2003, DOC has been decreased by half (10.7 mg/L in 1985-89 to 5.7 mg/L in 1999-03). This DOC decrease is probably due to (i) the closure of some industries discharging organic wastes, (ii) the improvement of municipal waste water treatment. In the Rhine and Weser Rivers, the DOC decrease was less marked (about 30 % for the same period), probably due to the second type of response (Behrendt et al., in preparation). Parallelly, POC has slightly increased from 2.4 to 2.9 mg/L. This increase can partially be accounted for by the chlorophyll increase from 55 to 77 mg.m-3 (+ 39 %). This
Res DOC
Total DOC
Labile DOC
0
1
2
3
4
5
6
600
800
500
UPSTREAM PARIS ESTUARY
STP