HAL Id: dumas-01104955
https://dumas.ccsd.cnrs.fr/dumas-01104955
Submitted on 19 Jan 2015
HAL is a multi-disciplinary open access
archive for the deposit and dissemination of sci-entific research documents, whether they are pub-lished or not. The documents may come from teaching and research institutions in France or abroad, or from public or private research centers.
L’archive ouverte pluridisciplinaire HAL, est destinée au dépôt et à la diffusion de documents scientifiques de niveau recherche, publiés ou non, émanant des établissements d’enseignement et de recherche français ou étrangers, des laboratoires publics ou privés.
Income inequalities and risk-perception of crime
Ignacio Flores
To cite this version:
Ignacio Flores. Income inequalities and risk-perception of crime. Economics and Finance. 2014. �dumas-01104955�
Income inequalities and risk-perception of
crime
Université Paris 1 – UFR 02 Sciences economiques
Master 2 Recherche Économie Appliquée
2014
Directeur de soutenance: Bruno Amable
Présenté et soutenu par: Ignacio Flores
ABSTRACT
The contribution of this paper on risk-perception literature is, first, to focus on the effect of local inequalities in perception. I find that higher inequalities imply an increased subjective risk-perception of physical injuries, burglary and theft. This effect can be explained by the fact that inequalities imply a higher climate of violence; both rich and poor people boost this effect. I use a quadratic term to show that inequalities’ effect is not necessarily linear, and has to be cleared of the effect of residential segregation. The second contribution is to add features like density, nightlife intensity, police presence, commune’s wealth and victimization rate for each type of crime. Each one of these items can have different effects on perception of risk depending on the type of crime. Last but not least, previous victimization is found to have complex effects on risk-perception, showing that people that have been victimized outside tend to feel safer at home. These results are found using cross-sectional data for Chile in 2011 with more than 22.000 individuals.
Acknowledgements: I would like to thank Professor Bruno Amable for his guidance, support and
patience through this project, Professor Angelo Secchi for his useful advice and support. I am also very grateful to my friends and family for their encouragement.
“Université Paris 1 – Panthéon Sorbonne gives no approval or disapproval to the opinions expressed in this paper; they should be considered as proper to the author.”
Index
INTRODUCTION 4 1. LITERATURE REVIEW 7 1.1FEAR OF CRIME 7 1.2RISK-PERCEPTION 8 1.3VICTIMIZATION 10 2. DATA 112.1PERSONAL AND HOUSEHOLD DATA 11
2.2COMMUNE DATA 12
3 IDENTIFICATION STRATEGY 13
3.1DEPENDENT VARIABLES AND ECONOMETRIC MODELS 13
3.2INEQUALITIES 14
3.3SIMULTANEITY PROBLEMS AND TRICKY VARIABLES 16
4. RESULTS 17
4.1OBJECTIVE RISK-PERCEPTION:OLS REGRESSION ON “NOTEGEN” 17
4.2SUBJECTIVE RISK-PERCEPTION: PROBIT MODELS ON SPECIFIC CRIMES 20
5. FURTHER ISSUES AND CRITICS 22
5.1WHO FEELS THREATENED? 22
5.2CRITICS 25
CONCLUSION 26
BIBLIOGRAPHY 28
APPENDIX 30
APPENDIX 1:SUPPLEMENTARY CONTROL VARIABLES FROM ENUSC2011 30
Introduction.
In Chile, 26.3% of respondents reported having been the victim of a crime during 20111. This means a decrease on the victimization rate of 12 percentage points in 7 years. This phenomenon is observed in every type of crime, in any region of the country. One might think that people would perceive this trend, increasing their feeling of security. The question is, when you ask the same subjects: “What do you think about criminality? It grew, it was stable or it decreased?” From 2005 to 2012 the share of interviewees that thinks it grew ranges between 59,6 and 86,6% throughout the period2. Having this in mind, it can be said that the people’s perception of criminality and its real trend are widely disconnected, at least in Chile.
Criminality is very far of being a new issue for any country; Max Weber defined the state like a “Monopoly of legitimate physical violence”3. In Weber’s definition we see that one of the main bases of any state is to protect its citizens against illegitimate violence. In fact, there is a wide consensus in both public opinion and scientific community about how protection of physical integrity and private property lead to prosperous societies. From that angle, the understanding of the mechanisms that define fear, risk perception and insecurity become essential to comprehend the attitude of citizens towards crime and policies trying to prevent it. Indeed, the most important motivation of this study is to understand the machinery of this feelings and attitudes, which determine the strength of state’s legitimacy in matter of physical violence.
In most of developed and developing countries, authorities manage to conduct victimization surveys that broadly consult about whether individuals have been the victims of certain crimes. This kind of survey is necessary because other official data, like police records, are not exhaustive due to the fact that police reports depend on people’s willingness to make an official complaint. For instance, if your car gets stolen almost 100% of the time you will make an official complaint because the insurance commands it. In
1 According to: ENUSC 2011 (during the 12 months preceding the survey).
2 Most of the time the index ranges around 75%, the only moment when it was as low as 56,9% is in 2010, the
first year of command Sebastián Piñera, the first right-wing president since the return of democracy in 1990.
another case, if someone steals your phone maybe you will not go to the police station because you think they won’t do anything about it or even that the value of your old phone is not such a big deal. That way, some crimes would be largely underestimated using police records. That is why victimization surveys are more reliable on keeping count of crimes, although they also give information about people’s feeling of security, their perception of risk and what do they do for preventing such situations.
Most of scientific research and public policies about criminality are based on victimization surveys. The main theoretical support of these studies is the so-called “crime opportunity theory”, the model is derived from economics’ rational choice4. According to this theory, in a crime there are three actors: the offender, the target, and the guardians. The offender makes a rational choice to seize an ephemeral opportunity to commit a felony depending on the characteristics of the target, but also of the guardians, that could be policemen or even other civilians that could protect the potential victim. Some researchers prefer to explain the decision of the offender, identifying characteristics that make someone more likely to become a victim; others specialize in knowing what kind of behavior can minimize chances to be victimized. Those kinds of studies have a lot of literature from themselves; they will be useful to help me explain another part of the problem. I will speak about the risk perception from the potential victim’s point of view.
The goal of this paper is to study the facts that determine the perception of an environment as secure or not. What external factors make an individual think rationally that he is more likely to be a victim? Special attention will be given to the role of local inequalities, an element that has been neglected in the main literature of risk-perception. Does income inequality increase risk-perception of crime? If it does, who feels threatened? What kind of crimes do people feel threatened about? Is the risk-perception calculation a perfectly rational calculation?
The contribution of this paper is, first, to find that income inequality is negatively correlated to the individual perception of the communes’ level of security, when subjects are asked to give an objective point of view. This effect can be explained by thinking that higher inequalities are followed by an increasing climate of violence; the impact is
perceived in both high and low social strata. I also use a quadratic term on the Gini coefficient to show that the effect is not completely linear and have to be cleared of the influence of residential segregation5. Additionally, I focus on the effect of local income inequalities in risk-perception for 5 different types of crimes. I find that higher inequalities imply more perception of risk, especially if the individual is asked about whether he thinks he will be a victim of physical injuries, burglary and theft.
Secondly, I differentiate objective and subjective risk-perception, showing with empirical results that the type of question that you ask has to be taken into account to avoid misunderstandings. Some variables like age or gender can have opposite effects depending on whether the question includes the individual or not. Moreover, I add some unusual community6 variables like density, nightlife intensity, police presence, victimization rate for each type of crime, and commune’s wealth. Some of these items can have different effects on perception of risk depending on the type of crime that you ask for.
The third contribution is to find that crime-specific previous victimization does not only affect the risk perception of that crime, but also of other type of crimes. For instance, a person that has been the victim of robbery thinks he (or she) is more likely to be victimized again, but more important, they also tend to feel relatively safer at home. Hence, previous victimization in some crimes can lower the risk perception for other crimes.
I will thus explain the individual’s objective risk-perception7 using an OLS regression combining the ENUSC 2011 dataset and other main community variables with information for more than 22.000 individuals. Then, from a subjective point of view, I will explain individuals’ predictions on whether they think they will be victims of 5 different types of crime using Probit regressions, with information about more than 8.000 individuals. Finally, descriptive data will be displayed to try to understand which social strata are boosting the effect of income inequalities on risk-perception.
I focus in the Chilean case for two reasons. First of all, Chile is reported to be the most unequal country in the OECD since its entry on 2010. Second, the country is described as
5 This phenomenon is similar to getthoisation, people with very low revenues concentrate in some parts of
cities, being almost all equally poor, the Gini coefficient is at its lowest in those places, with high level of criminality, hence high levels of risk-perception.
6 Community refers to the smallest Chilean administrative division called “commune” or “comuna” in
Spanish.
the safest in Latin America8 but found to have high levels of fear-of-crime. In fact, Olavarría (2006) describes the Chilean landscape having “high incidence of opportunistic
crimes of minor value, but high emotional impact”.
Since most of these crimes have a goal of material appropriation, it seems coherent to think in terms of income inequalities. Even though, the “Assault”9 type of crime will be a major clue to understand the uprising of pure violence.
1. Literature review.
1.1 Fear-of-crime.
The fear-of-crime literature found its first difficulties with defining what actually is fear. In some research papers, the word “fear” is used ambiguously and can be misleading, driving sometimes to contradictory results.
Surveys have different ways to ask questions, for instance, if I ask: How afraid are you about being a victim of burglary? The answer you will give is going to be personal and emotional. This kind of question is called affective fear-of-crime, Sparks (1992) gives a subtle comment on fearfulness that helps to understand this first type of fear:
“To be fearful is to approach and interpret the world in particular ways. To this extent,
it is rarely fully accurate to speak of fear as having been “caused” even by a specific precipitating event; nor is it always appropriate to interpret fearfulness solely in terms of the objects to which it ostensibly attaches.”10
It’s also important to point out that the affective part of the fear finds its roots in the personal background and the child memories of a person. From that point of view, it is hard to predict its causalities without having really exhaustive information about the subjects that you are studying.
8 Ward (2001). 9
Physical injuries.
Dammert and Malone (2003) explain, how people’s affective fear of crime can be explained using a sort of insecurity index that summarizes other social political and economic insecurities, like fear to be unemployed or having a good health protection. That’s how they find that one way to prevent high rates of fear in the population is to enhance the social security system. They announce that community participation, gender, age and education are not significant, contrary to most of the theoretical discussion in the literature.
Perhaps the most important finding in their paper is that the relation between “trust in the press” and affective fear is positive. The principal problem with Dammert and Malone (2003) is their short database11.
Some sociologists try to explain fear by the environment the person is living in. Walklate (2001) for example, focus on fear-of-crime in high-crime areas, assuming a relationship between the fear and the community of residence. Her article is mostly theoretical and reviews extensively the literature that tries to explain that relationship. She explains the high level of fear in high-risk areas using trust mechanisms. Pain (2000) takes a geographic approach, and finds different sources of fear depending on the physical environment, distinguishing between rural and urban areas. This papers, give a deep analysis of people’s daily surroundings that covers themes that economic approaches usually neglect.
1.2 Risk-perception.
The second kind of fear the literature speaks about is the so-called cognitive fear-of-crime, this is the kind of fear we will focus on in this paper.
The word “cognitive” stands for the rational part of the fear. Theoretically, cognitive fear of crime is supposed to be the result of some kind of calculation the subject does in his mind to determine – analyzing his own image and entourage – whether he is likely to be a victim of specific crimes in the future. The interviewer can ask questions like: How secure do you feel walking alone at night in your neighborhood? Or, do you think you will be a victim of a crime in the following 12 months?
The answer will actually be a risk perception from de interviewee’s point of view. It will depend on the appreciation the person has about external elements but also about his own attractiveness to offenders, like if he carries valuable items, if he doesn’t know how to fight or other personal characteristics. For a deepening in the difference between fear-of-crime and risk perception, see Wilcox and Land (1996); the authors compare results on crime-specific cognitive and affective fear of crime. On the rational side, risk-perception is found negatively related with neighborhood integration (unlike expected).
Individuals with previous victimization experience are found to be more likely to perceive high levels of risk; those who perceive high levels of risk are also more likely to fear the crime, according to Mesch (2000).
Russo, Roccato and Vieno (2011) find that indirect victimization, being a woman, having low education, being older and perceiving social disorder have a positive impact on risk-perception. At a community level, they find that victimization rates and unemployment rates had also a positive relation with the predicted variable. This study treats the Italian case. One of their additional conclusions is to find that immigration rate is not significant, implying that ethnical discrimination is not determining in their case.
Quillian and Pager (2010), contrarily, find that in the United Stated, racial diversity enhances risk perception especially for white respondents. Besides, they state that risk-perception predictions are commonly inaccurate to estimate the real victimization rates.
Most of the literature in this area focuses on these themes (social integration, ethnical diversity, relationship between fear of crime and risk perception), but none of it considers a relationship between income inequalities and cognitive fear of crime. Moreover, risk-perception is normally treated as a homogenous variable without distinguishing between objective and subjective risk-perception. When I talk about objective risk-perception I mean that the respondent has been asked to evaluate the level of security of a place, without putting himself in the picture. Contrarily, subjective risk-perception is when the question includes the individual, for instance, if you ask whether the person thinks he is likely to be a victim; or if he feels safe walking alone. This lack of clarity can lead to contrary results especially talking about the effects of age or sex.
1.3 Victimization.
Olavarría (2006) gives a very complete description of Chilean criminality from the victims’ point of view. According to him, putting all crimes together, victims are mostly men, 20 to 30 years old, upper-middle class. So, the victim’s profile is a man who is likely to have risky behaviors (like drinking or going out late), he has money, but not enough to pay for his security. 30 to 50 years old men are also relatively likely to be victims, the reason is supposed to be that they are probably – for the criminal – people who work and have accumulated some wealth. Wealth and victimization seem to be correlated for the first 4 social strata, but the upper class is actually the least affected by criminality. It’s obvious that a criminal prefers to steal rich persons in order to maximize his profit, but once victims reached a certain level of revenue, they can pay for alarms, private security, cameras, garages, and many expensive security devices that are actually pretty dissuasive12. Indeed, those who seem to be less likely to be victims are older (or very young), women and rich ones.
We can find sharper results if we divide victimization by type of crime. Frühling and Sandoval (1996) find that crimes committed against people – like assault or robbery – are positively related to poverty and have less incidence in older persons and women. Results from Olavarría (2006) imply that crimes that mostly happen in the interviewee’s neighborhood – vehicle theft and burglary – depend significantly of the number of inhabitants in the household, those living alone or in couple would be easier prays for this kind of crimes. According to the same study, these people feel the vulnerability and purchase more security devices to protect themselves, also those living more than 5 years in one place are more willing to buy this kind of devices. The other kind of crimes include those that occur outside the neighborhood – like robbery, with or without violence – these crimes are mostly affecting men, that work and have to commute, suggesting this happens around the public transportation system or in the streets.
This analysis will help to discuss whether individual’s perception of risk is rational comparing to reality or not.
2. Data.
2.1 Personal and household data.
This study combines information from different Chilean datasets at different levels, all in cross-section for the year 2011. The most important dataset I use for this analysis is from ENUSC 201113, a survey about insecurity and victimization that is implemented jointly by the Chilean National Institute of Statistics (INE) and the Chilean Ministry of interior. ENUSC survey gives information about nearly 26.000 households, containing more than 89.000 subjects, their personal characteristics and very detailed questions about crime victimization and feeling of insecurity. All these people come from the 101 most urban communes in the country.
The dependent variables in my econometric models come from this survey. In the first model, in order to construct a linear regression, I will use one question: “On a scale from 1 to 7, what do you think is the level of security in the following places”14. I focus about answers concerning 3 different places: The respondent’s neighborhood, his commune15, and street in general16. The three scores are combined on a weighted average; the question about the commune weights two times the others. I’m using this technique in order to create a continuous variable, which reflects the perceived level of security in general, focusing mostly in the commune.
In the second part of the empirical analysis I will use the question: “Of what crimes do you think you will be a victim in the next twelve months?”17 The interviewee answers yes or no for 10 types of crime, among them: burglary18, surprise robbery19, violent robbery20,
13 National Urban Survey of Citizen’s Security, In Spanish “Encuesta Nacional Urbana de Seguridad
Ciudadana”.
14 Only integer numbers are allowed.
15 Chilean smallest administrative division, when talking about community, concretely I talk about
communes.
16
Questions P8_7_1, P8_6_1 and P8_1_1. Having 25.933 answers each. After dropping observations with missing values from other databases 22.839 individual observations are used.
17
10.003 answered this question, after dropping observations with missing values from other databases I use 8.932 observations.
18 Stealing objects from the household without using violence on people.
19 Stealing objects directly to a person, without using violence, commonly, taking something and running
theft21 and assault22. Five dummy variables are made from the questions; each one of them will be explained in a different Probit model. Actually, the dependent variable is 1 if the individual thinks he will be a victim, 0 otherwise.
All personal or household data come from this database, having socio-economic classification23, safety measures of the household, behavioral prevention measures and previous victimization.
2.2 Commune data.
The main variable at this level is the Gini coefficient for each one of the 101 communes; it is a proxy for socio-economic inequalities and cultural distance among social strata. It ranges between 0 (perfect equality) and 1 (perfect inequality). This coefficient is calculated using information from CASEN 200924 survey on dependent workers that are covered by unemployment insurance.
At a commune’s level25, I created a dataset using many official and public available datasets. The police force or “carabineros” handed me, through the transparency program implemented some years ago, the annual public accounts26, for the year 2011. It gives detailed information about police personnel, police vehicles, and alcohol-selling stores. These variables were transformed to fit in ”per person” logic, thus, divided by the estimated population27.
Public information about municipal revenues (“Community Wealth” variable) comes from SINIM28; this variable is used as a proxy of wealth of the community because the principal source of revenues for the “Municipality” – the unit that administrates communes
20
Stealing objects from a person using physical or verbal violence or threatening physical integrity with or without a weapon. These kinds of crime can happen outside or inside the property.
21 In Spanish “hurto”, refers to stealing something whitout the owner noticing and without using any force. 22 Physical injuries.
23
In the Chilean system a 5 level socio-economic classification is used (ABC1, C2, C3, D, E) in decreasing order, each household is classified by his level of education and also wealth, measured by the fact of having certain goods, like a car, refrigerator, TV, internet connection, among others.
24
Caracterización Socioeconómica Nacional, a survey from the Ministry of Planification and cooperation.
25
Refers to the smallest Chilean administrative division called “commune” or “comuna” in Spanish.
26 In Spanish, “Cuentas públicas”.
27 Provided by INE, using information from the census on 2002.
28 National System of Municipal Information, or Sistema nacional de información municipal, in Spanish
– comes from real-estate and circulation taxes, those are directly proportional on the value of properties and vehicles. This variable is also calculated per inhabitant.
3. Identification strategy.
3.1 Dependent variables and econometric models.
The type of question that I use as dependent variables is clearly classified in the cognitive fears section. In other words, we know that kind of question implies a rational calculation of the perceived level of danger. Actually, in this model, risk-perception from the individual’s point of view is only affected by vulnerability and crime attractiveness. Vulnerability is everything that makes the crime easier to commit. For instance, if we are speaking about burglary, an easy target doesn’t have safety devices; if we speak about crimes against people, vulnerability would mean gender or age. Crime attractiveness, on the other hand, speaks about what makes the crime more appealing to the offender. For example, in crimes that include stealing, the value of carried items and their portability increase crime attractiveness. While, in assault crimes, the target is not to steal but to physically damage the victim. So, the crime attractiveness, in that case, is driven by anger or hate against a particular person or group.
In the first model, respondents are asked to give an objective appreciation of the security level of the community they are living in, their neighborhood and the street in general. Hence, rationally, personal and household characteristics shouldn’t be determinant in this model while community’s features should. The first model explains “objective risk-perception”. Technically, the dependent variable is the perceived level of general security29 (on a scale from 1 to 7) that will be explained by individual and community data. I’m adding individual data to this model to see how objective is the perception, leading to conclusions on the form of rationality we should use in these models.
In the second model, interviewees are asked whether they think they will be victims in the future. In a concrete way, the dependent variable takes the value “1” when the
individual thinks he will be a victim, and “0” if not. So, we can be sure that they are making a calculation using, on one hand, personal and household characteristics (attractiveness for robbers and vulnerability) and on the other hand, communities’ information (also affecting vulnerability). This type of model explains “subjective risk-perception”. Thus, we will see which features explain risk-perception depending on what type of crime persons are asked for.
3.2 Inequalities.
In the OLS model, the Gini coefficient is treated as a quadratic term. The economic reason for this choice is that I noticed, looking at descriptive data, high rates of risk perception (low rates of security) can be found in both very equal and very unequal communities. Given the fact that very equal communities in Chile often are equal because they concentrate people with low incomes (thus, with highest victimization rates30), it seems legitimate to allow for non-linear effects. This way, I try to clear the effect of some communities that appear to be very equal but in fact, they are the product of wide geographical segregation31, often having high rates of crime. I expect the relation to be concave, this would mean that at the beginning, security would increase with inequalities; and then, after the break point inequalities would start to have a negative effect on security (positive effect on risk perception).
For the Probit regression models, a positive relation between inequalities and risk- perception, would mean, that individuals living next to socio-economically distant subjects perceive more risk than those who live in homogenous communities. Now, if the effect is significant, a considerable question rises: who is boosting it? As it is a matter of income inequality, the question is treated in terms of social strata. Common Sense is to think that the effect is specific to richer people; this would mean that they rationally think that poorer ones are, in fact, dangerous. That would be discrimination disguised as fear. Otherwise, if the effect were found overall, it would mean that higher inequalities create a violent climate
30
Olavarría (2006).
31 See Sabatini (2000) for a deep analysis of institutions that promote residential segregation in Chile since the
and both rich and poor individuals would perceive this. In the fifth part of this paper, some descriptive statistics will be displayed to try to answer that question.
It is important to notice that we are controlling inequalities with a proxy of the communities’ wealth. There is a positive correlation between the Gini coefficient and wealth because inequalities depend mostly on the top part of the distribution32. By the way, we suppose that personal wealth has complex effects on risk-perception, on one hand, wealth decreases vulnerability enabling subjects to purchase safety devices and isolate themselves, on the other hand, wealth usually is more attractive to criminals by purchasing of valuable items. Olavarría (2006) has shown that, in reality, revenue increases probabilities to be victimized for middle and middle-upper class, but lowers that probability reaching upper class; in fact, ABC1 category is relatively the least victimized.
One possible criticism to the model is to say that the level of education could be an important omitted variable, affecting both inequalities and risk-perception. Russo Roccato and Vieno (2011) found low education to increase risk-perception; hence, following their conclusions not controlling for education would mean an underestimation of the effect of inequalities. However, Chilean socio-economic classification includes the level of education thus, it is not purely an omitted variable.
The Gini coefficient that I use to proxy inequalities is underestimated. Indeed, people who hold the highest revenues in the country rarely are dependent workers with unemployment insurance. So, the richest Chilean men and women don’t appear in the data. Knowing that Chile is by far more unequal than the United States, with the latest research on top-incomes33 showing that inequalities in the U.S have been underestimated during decades, it is easy to imagine the same goes for Chile. I will use a quadratic term of Gini coefficient in the first regression; if the quadratic term turns to be significant and concave it would mean that the underestimation of the Gini coefficient leads also to an underestimation of the estimated effect of inequalities on perceived risk.
32 According to INE (2010), in 2009, the richest 20% of the population holds 47,3% of national revenue while
the poorest 20% holds only 6,8% of it. This shows how income distribution is skewed, not taking any risk in assuming inequalities are driven by high revenues.
3.3 Simultaneity problems and tricky variables.
The pack of control variables I use in both econometric models include safety devices used by households, such as alarms, electric and non-electric devices, cameras, private security systems or fences. Theoretically, these devices should decrease risk-perception through diminishing of vulnerability to crime, especially in crimes that happen in the property like burglary. The problem is that those variables can suffer of simultaneity; this means that someone that perceives high risk of victimization is more likely to purchase that kind of protection. Affective fear of crime has the same effect; this means that someone who is more terrified about the idea of being a victim would also be more likely to purchase them.
The same problem appears when controlling for safety measures individuals can take. For instance, not going out late, avoiding some public places, not carrying cash or jewelry, not leaving the property unattended, those are measures that can decrease risk-perception through the diminishing of crime attractiveness. The problem is that people who take that kind of measure can also be likely feel vulnerable.
A similar effect can be found with police presence, the amount of officers and police vehicles per person can, in one way, be comforting but a high level of presence could also scare residents. Imagine if you see some police officers in the streets, maybe you can fell safe, but if you see lots of them maybe you will start thinking there is something wrong with your neighborhood.
Simultaneity can also be found in the choice of the property-type, the effect being considerably lower than in previous variables because there are big financial constraints in the choice of the property type.
There are other variables at community level that can be interpreted differently depending on the type of crime. Density of population can be perceived as increasing the propensity to create opportunities to crime especially if the offender doesn’t want to be recognized, hence, it should increase risk-perception. But, theoretically it can also provoke the contrary effect, increasing the presence of guardians. This variable affects directly the vigilance of the scene of crime.
I use alcohol-selling stores per inhabitant like a proxy for the nightlife of each community. In this case, the expected effect is to increase risk-perception due to the fact that usually drunk people are more likely to make bad decisions and be more vulnerable; hence, they also attract potential offenders. That way, everyone in the community would become more vulnerable due to the presence of offenders.
Another interesting variable is the victimization rate of the community. We assume that people talk to each other and know approximately how much crimes of each type occur in their community. That is how, victims’ communication with family, friends and even press contributes to expanding the risk-perception of crime. For instance, if you’ve heard of people like you have actually been victim of certain crimes, rationally, you think you are more likely to be a victim.
4. Results.
4.1 Objective risk-perception: OLS regression on “Notegen”.
Gini coefficient shows to be significant in the first regression model like expected. Thereby, we can say that inequalities, measuring objective risk-perception, have an effect on the general perceived level of security. In fact, “Gini” and “Gini square” are fully significant and stable in regressions (1), (2) and (3). “Gini square” is negative, thus the effect shows to be concave like predicted. Indeed, the vortex is approximately at Gini equal 0,4434. In other words, Gini values under 0,44 have a positive relation with the level of security; while values over 0,44 have a negative relation with security levels. As a matter of fact, at the value Gini = 0,51, its estimation of marginal effect is near -2,3735, this means that a variation of 0,1 would lower the general level of security by 0,24 points (on a scale from 1 to 7).
Using the quadratic term clearly increases significance of inequalities comparing to the basic model.
34 -15,11/2*(-17,08) 35 15,11 + 2*(-17,08)*0,51
Table 1: OLS regression on “Notegen”36
*General security level (1) (2) (3) Gini square -17.087*** -17.312*** -17.379*** (1.870) (1.836) (1.855) Gini coefficient 15.114*** 15.325*** 15.351*** (1.695) (1.663) (1.680) Density -0.037*** -0.039*** -0.039*** (0.005) (0.005) (0.005) Community wealth 0.081*** 0.067*** 0.059*** (0.019) (0.019) (0.020) Victimization rate: burglary -0.039*** -0.032*** -0.031***
(0.003) (0.003) (0.003) Victimization rate: violent robbery -0.068*** -0.061*** -0.061***
(0.004) (0.004) (0.004) Population / Police vehicles (log) -0.046* -0.051* -0.058**
(0.027) (0.026) (0.026) Alcohol patents / inhabitant 0.004 -0.001 -0.017
(0.019) (0.019) (0.019) Sex (female) - -0.090*** -0.088*** (0.015) (0.015) Age (log) - 0.271*** 0.265*** (0.016) (0.017) Employed - -0.162*** -0.155*** (0.015) (0.015) Previous victimization: burglary - -0.359*** -0.358***
(0.033) (0.033) Previous victimization: violent robbery - -0.309*** -0.309*** Other victimization rates YES
(0.035) YES
(0.035) YES Other previous victimization dummies
Social strata dummies
- - YES YES YES YES
Property type dummies - - YES
Length of residence dummies - - YES
Safety devices dummies - - YES
_cons 1.769*** 0.859 0.838
(0.444) (0.444) (0.449)
R2 0.09 0.13 0.14
N 22,717 22,717 22,717
*p<0,10 ** p<0.05; *** p<0.01 Numbers in parenthesis are Standard Errors
Notice that the variable for community wealth has positive and significant effect on objective risk-perception. Thus, the hypothesis of the Gini coefficient being carried away by its correlation to wealth is proved fake because they have contrary effects while they should – following that reasoning – have the same sign.
Besides inequalities, the first model expects other community characteristics to be determinants of perceived risk. For instance, results show that density of population implies a decrease of security. The predominant effect of density is the one that increases theoretical opportunities of crime by increasing vulnerability; in this case, the expected vigilance effect is not strong enough. Similarly, police presence shows to have a negative effect in this case.
Burglary and almost every crime rate has a significantly negative effect on “notegen”, confirming the idea on which people have an approximate idea of the rate of crimes of their community. Police presence is also important in defining the level of security, but only on vehicles.
As stated earlier, in this model interviewees are asked to evaluate the level of security of the community. Therefore, according to the rational model, individuals should not take into account personal and household characteristics and only consider external characteristics. This hypothesis is proved wrong with next results.
The age variable seems to affect positively the level of security. Some theoretical literature expects that age increases vulnerability, and hence, risk perception; in this case we see the contrary effect. We see that when asked for a general point of view – not including themselves in the picture – the elderly perceive their environment to be relatively safer.
All kind of previous victimization – of the individual or members of the household – is found to be significantly negative on the level of security. This result leads to think the calculation can be very subjective – not surprisingly.
The fact of being employed makes you perceive a lower level of security than others, maybe because generally, when you work, you are contractually compelled to commute, therefore, be in direct contact with the real environment.
This kind of result shows that this kind of appreciation can be very subjective, even when asking for objective points of view.
Cook-Weisberg test, rejects the hypothesis of homoscedasticity in this model, but, the same regression using robust standard errors do not change significantly the estimated
coefficients or the standard errors themselves. Thus, we don’t have to worry about problems of heteroscedasticity interfering with the interpretation of these results.
4.2 Subjective risk-perception: Probit models on specific crimes.
When looking at results of Probit regression models (Table 2), risk-perception of assault, burglary and theft show to be affected positively and significantly by inequalities, when asking respondents whether they think they will personally be victims. That is to say, in presence of high inequalities, people tend to feel threatened in a personal way. This means, that subjective risk-perception is also affected by inequalities.
Despite the significance of estimated coefficients of inequalities in these models, the actual predicted probability of an individual believing he will be a victim, depending on the Gini coefficient, is quite little. For instance, using the subjective risk-perception of assault, the marginal effect of the Gini coefficient on the predicted probability is 0,2737. This is to say that an increasing of 0,1 in the Gini coefficient increases by 2,7% the probability of a person to answer “Yes”. By the same way, for burglary the effect of an increase of 0,1 is predicted to be an increasing of that probability by 3,1%, while, talking about simple theft the increase would be 2%.
As seen on Table 2, density and wealth of community have the same effect than in the OLS regression. That is not the case for some personal characteristics like sex or age; women appear to feel less threatened by violent crimes (assault and violent robbery), while they think they are more likely to be victims of all other crimes. The fact of being older is negatively correlated with all crime-specific risk-perceptions but burglary.
Some relations can be found between crimes, for instance, the fact of having been a victim of burglary can make an individual think he is less likely to be a victim of surprise robbery. This relationship can be kind of weird, but from a psychological point of view, it is easy to think that those whose home has already been penetrated feel safer outside. The inverse effect is also significant according to these results: those who have been the victim of violent robbery think they are less likely to be victims of burglary, maybe because they
feel safer at home. These results are also showing that the rational calculation can become very emotional and complex.
Table 2: Probit models on specific crimes38.
(Assault) (Burglary) (Surprise. Robb) (Violent Robb) (Theft) Inequalities (Gini coefficient) 0.913*** 0.812*** 0.122 0.136 0.521* (0.320) (0.299) (0.293) (0.296) (0.294) Density (log) -0.078*** -0.086*** -0.038*** -0.020** -0.088***
(0.010) (0.010) (0.010) (0.010) (0.009) Community wealth (log) -0.138*** -0.041 -0.142*** -0.001 -0.113***
(0.039) (0.038) (0.037) (0.037) (0.037) Burglary rate 0.007 0.022*** 0.005 -0.026*** -0.009
(0.007) (0.007) (0.007) (0.007) (0.007) Violent robbery rate 0.047*** -0.004 0.023*** 0.051*** 0.045***
(0.007) (0.007) (0.007) (0.007) (0.007) Assault rate -0.077*** -0.082*** -0.090*** 0.019 -0.085***
(0.014) (0.013) (0.012) (0.012) (0.012) Comercial patents / population (log) 0.004 0.003 0.047*** -0.030** 0.041***
(0.016) (0.015) (0.015) (0.015) (0.015) Alcohol patents / population (log) 0.067* 0.139*** -0.042 -0.044 -0.079**
(0.039) (0.037) (0.036) (0.037) (0.036) Sex (female) -0.123*** 0.095*** 0.264*** -0.154*** 0.057*
(0.032) (0.030) (0.030) (0.030) (0.030) Age (log) -0.095*** 0.361*** -0.162*** -0.081** -0.113***
(0.036) (0.034) (0.034) (0.034) (0.033) Previous victimization (bruglary) -0.012 0.711*** -0.201*** -0.095* 0.098*
(0.056) (0.055) (0.052) (0.053) (0.052) Previous victimization (Violent robbery) 0.002 -0.135** -0.065 0.201*** -0.014
(0.057) (0.056) (0.054) (0.057) (0.053) Previous victimization (Assault) 0.297*** -0.137 -0.194** 0.273*** -0.097
(0.081) (0.083) (0.078) (0.085) (0.079) Property type dummies YES YES YES YES YES Length of residence dummies YES YES YES YES YES Safety devices dummies YES YES YES YES YES Behavioral prevention dummies
Other crime rates
Individual and community dummies
YES YES YES YES YES YES YES YES YES YES YES YES YES YES YES YES YES YES YES YES
_cons YES YES YES YES YES
N
Area under the ROC curve Pseudo R 8,932 0,65 0,05 8,932 0,71 0,10 8,932 0,63 0,04 8,932 0,63 0,04 8,932 0,63 0,03 *p<0,10 ** p<0.05; *** p<0.01 (Numbers in parenthesis are Standard Errors)
Even if the effect of the Gini coefficient is not significant in every Probit model, its coefficient is always negative. The fact that the sign of the effect doesn’t change is, in some manner, a sign of robustness. Besides, robustness checks have been made for every Probit model of Table 2, neither standard errors nor estimated coefficients displayed in the table changed significantly.
The area under the ROC curve gives information about the precision of each model, it can be interpreted as follows: knowing all dependent variables, if we pick a random observation, the burglary model would predict the correct answer of the respondent 71% of the times. The fact that all models are above 50% of right predictions means that the variables in the model are helping predict tendencies better than just flipping a coin and guess the answer.
It is not surprising that the Burglary model is the one that has the highest precision, indeed, burglary is the only crime that happens 100% of the times in the community you live in. This gives a hint; if we had the same community information about the places individuals usually work or study in, our predictions would be much stronger.
5. Further issues and critics.
5.1 Who feels threatened?
The main finding in this paper is to prove that unequal environments increase both objective and subjective risk-perception. Indeed, Probit regression on risk-perception of assault shows that individuals living in unequal communities tend to think others will injure them as a matter of pure violence.
In order to find the correct interpretation of this phenomenon, thinking that the richer could fear those who are economically distant from them39, I created an interaction variable using the Gini coefficient and the highest social strata (ABC1, C2 and C3). The interaction term was not significant in that case.
39 This idea comes from commonsense; it seems more likely that richer people feels threatened by poorer ones
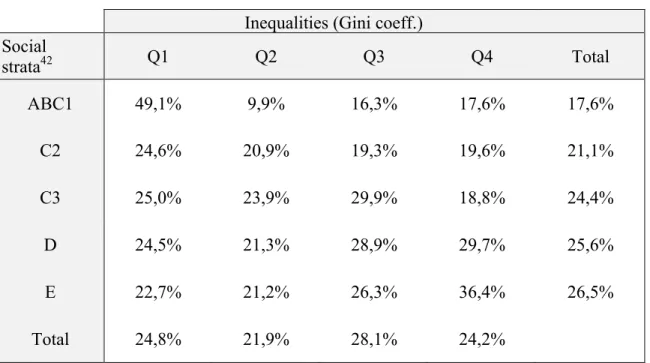
Therefore, I built Table 1, so as to going deeper in the interpretation. It shows the percentage of interviewees that answered “Yes” to the question “Do you think you will be a victim of assault in the next 12 months?” dividing the distribution of the Inequality variable in 4 equal shares40 and the 5 socio-economic strata used in Chilean nomenclature.
Table 3: Perceived risk of assault by social strata and inequalities41.
Inequalities (Gini coeff.) Social strata42 Q1 Q2 Q3 Q4 Total ABC1 49,1% 9,9% 16,3% 17,6% 17,6% C2 24,6% 20,9% 19,3% 19,6% 21,1% C3 25,0% 23,9% 29,9% 18,8% 24,4% D 24,5% 21,3% 28,9% 29,7% 25,6% E 22,7% 21,2% 26,3% 36,4% 26,5% Total 24,8% 21,9% 28,1% 24,2%
Percentages show the share of respondents that answered “Yes” Source: Elaborated by the author using data from ENUSC 2011
Looking at Tables 3 and 4 we see that, starting from Q2, the rate of respondents feeling threatened increases jointly with inequalities in the poorest social strata (E and D) and in the highest (ABC1). Together, they represent 55,7% of national population. These results support the hypothesis of inequalities affecting both rich and poor people’s risk-perception, due to an increasing climate of violence. Besides, the parabolic shape of the relation between inequalities and Gini coefficient can also be confirmed looking at the table.
40
Q1 are communities having the lowest 25% of Gini coefficient scores (more equal), while Q4 shows the 25% of communities having the highest scores in Gini coefficient (more unequal).
41 10.003 persons are involved in this table. 42
In the Chilean system a 5 level socio-economic classification is used (ABC1, C2, C3, D, E) in decreasing order, each household is classified by his level of education and also wealth, measured by the fact of having certain goods, like a car, refrigerator, TV, internet connection, among others.
Table 4: Percent of population in each socio-economical stratum. Percent of national population ABC1 2,6% C2 7,4% C3 36,9% D 46,7% E 6,4% TOT 100,0% Source: INE (2010)
Middle and middle-upper classes also represent a big share of national population (44,3%) but the effect of inequalities on their risk-perception is not clear enough to be interpreted. C2 stratum shows a relatively stable rate of perceived risk all along, while C3’s rate of people answering “Yes” goes up and down being unpredicted by this data. The fact that in middle class, risk-perception and inequalities seem to be uncorrelated may be caused by the fact that, depending on the wealth of the community, they can be the richest among poor or the poorer among riches. This interpretation is coherent with the fact that Chile is known for its geographical segregation, and usually, all social strata do not coexist in the same communities.
Are individuals perfectly rational? Crime-opportunity theory states that individuals make rational calculations to commit crimes and also do potential victims to define their own perceived risk. As a matter of fact, subjects perceive inequalities as a threat to their physical integrity and to their property. Confronting this to Olavarría’(2006) I can say that -
if those who feel unsafe in presence of inequalities are upper classes43 - the calculation is not rational at all because the more you climb in the socio-economic classes, the less likely you are to be a victim of assault. Indeed, the author says that violent crimes like assault are more present in poor socio-economic strata.
Moreover, the fact that previous victimization of surprise and violent robbery increase the perceived level of security at home proves that the calculation individuals do can have a big part of emotional. Thus, perfect rationality is discarded.
5.1 Critics.
All collected data is in cross-section, mainly because data at community level is not available annually, this means that we are comparing communes to each other. As a result, in these models specific effects for each commune are not allowed, hence, results could be more realistic using Panel data.
Also, the Gini coefficient used in these models comes from 2009 because CASEN data for 2011 were unavailable. Having data from the same year could improve precision on results.
Predictive power of Probit regressions is limited, as stated before, most of them have a success near of 64%. In fact, the model for “Assault” predicts accurately only 2,3% of positive results and 99,2% of negative results. This is to say; the model is predicting almost exclusively negative outcomes and has a hard time to predict positive ones. This is not the case for all of Probit models, for instance, the one for “Burglary” predicts accurately 47% of positive outcomes and 66% of negative ones. Still, these models don’t have to be taken as probability predictors but only as pointing out some tendencies.
However, in this case it is impossible to have exhaustive data of the places individuals regularly visit; and those data are implicitly taken into account when people make caluclations on risk-perception.
43 This statement comes only from common sense: It is very hard to think about a situation where poor people
feel physically threatened by richer ones, it is known that the lower you are in economic classification and the more you are confronted to violent environments. Some talk about being “streetwise”.
Besides, the use of the quadratic term in OLS is clearly adding significance to the model. Yet, I chose not to use a quadratic term in Probit regressions because, by construction, they allow non-linearities. Anyway, I did the same regressions including Gini squared and the outcomes were quite different. In surprise robbery, inequality variables turned significant, but the power of prediction of the model remained the same. In assault, it was the contrary, inequalities lost significance and the model gained a little more of predicting power. In short, the effect was not the same overall and appeared to be very difficult for both economic and econometric interpretation. For that matter, I added those results in Appendix 2, for those who want to take a closer look.
Conclusion.
Income inequalities have proven to increase individual objective risk-perception, especially in communities with Gini coefficients higher than 0,44, in the Chilean case in 2011. Hence, people living in unequal communities tend to perceive more danger in their environment, this, controlling for crime-specific victimization rates, previous victimization, among other individual and community data. Also, the quadratic term in the first econometric model44 shows that the relationship is not necessarily linear and may need to be cleared of geographical segregation45.
This effect is also found in subjective risk-perception, particularly in crimes such as burglary, assault and theft, according to Probit regressions in the second econometric model. Actually, individuals living in unequal environments tend to feel threatened in a personal fashion. Displaying some descriptive statistics I found that this implication is present among all socio-economic strata, thus, it can be interpreted as a rising climate of violence rather than a class-specific phenomenon.
Furthermore, results show that community data like, police presence, density, victimization rates, and nightlife-intensity are worth to be taken into account to explain risk-perception. Moreover, individual’s calculation of the security-level of his community
44 OLS regression explaining objective perceived level of security.
is not only influenced by objective community data, but also by individual characteristics and experiences like sex, age, the fact of being employed or having been a previous victim. On a crime-specific logic, the influence of such features can work in a more complex way. For instance, a person who has been the victim of surprise robbery is more likely to think his home is not threatened by burglary. This effect goes both ways. So, the interpretation of this phenomenon would be to think the individual who has been the victim of a crime in the streets tend to feel safer at home and vice-versa. This leads to think that risk-perception is not exclusively a rational calculation of vulnerability and attractiveness; it can also have an emotional factor.
Anyway, the same variables can have opposite effects when comparing objective and subjective risk-perception. For example, women perceive more danger objectively but they also tend to be more confident on not being victims of violent crimes. Similarly, older people perceive less risk objectively, but feel more threatened about burglary specific crime.
Results in this paper show that income inequalities have implications in the daily life of both rich and poor subjects. It seems to be that, historically; the solution to the problem of rising insecurity in Chile has been to segregate more and more different social strata. This study gives a hint to think diminishing income inequalities can lower risk-perception and crime-insecurity.
Bibliography.
Barnes, G. (1995) “Defining and Optimizing Displacement” Crime and Place, John E. Eck
and David Weisburd, eds. Monsey, New York: Criminal Justice Press p. 95-113.
Barros, L. (2003) “Planificación de la Actividad Delictual en Casos de Robo con
Violencia o Intimidación” Centro de Estudios de Seguridad Ciudadana,
Universidad de Chile.
Cohen L., Felson M. (1979) “Social change and crime rate trends: A routine activity
approach” American sociological review, August, vol.44, p588-608.
Cornish D., Clarke R. (1986) “The reasoning criminal: rational choice perspectives on
offending” Springer Verlag. New York.
Dammert, L. and Malone, M.F.T (2003) “Fear of crime or fear of life? Public
insecurities in Chile” Bulletin of Latin American Research, January, Vol.22, Issue 1,
p.79-101.
Frühling, H. Sandoval, L. (1996) “Distribución Espacial de la Actividad
Delictual en el Gran Santiago: Algunos Factores Explicativos”, Estudios Sociales
90, Trimestre 4, 137-159.
Mesch, G. (2000) “Perceptions of risk, lifestyle activities , and fear of crime” Deviant
Behavior, 21, p.47-62.
Olavarría M. (2006) “El crimen en Chile: una mirada desde las víctimas” Santiago de
Chile: Centro de Estudios en Seguridad Ciudadana (CESC), Universidad de Chile: RIL editores.
Pain, R. (2000) “Place, social relations and the fear of crime: a review” Progress in
Piketty T., Saez E. (2003) “Income inequality in the United States, 1913-1998” The
quarterly journal of economics, 188 (1): p.1-44
Quillian, L. Pager D. (2010) ” Estimating risk: Stereotype amplification and the perceived risk of criminal victimization.” Social Psychology Quarterly, 73(1), 79–104.
Russo S., Roccato, M., & Vieno, A. (2011). “ Predicting perceived risk of crime: A multilevel study.” American Journal of Community Psychology,48(3–4), 384–394.
Sabatini, F (2000) “Reforma de los mercados de suelo en Santiago, Chile: efectos sobre
los precios de la tierra y la segregación residencial” EURE (Santiago), May, v.26, n.77.
Sparks, R. (1992) “Television and the drama of crime: Moral tales and the place of crime
in public life” Buckingham : Open university press.
Walklate, S. (2001) “Fearful Communities?” Urban Studies 38, 5-6: 929-39.
Ward, H. (2001) “Police reform in latin america: current efforts in Argentina, Brazil and
Chile” (Unpublished) Presented at Woodrow Wilson International Center for Scholars.
Weber M. (1919) “'Politik als Beruf,' Gesammelte Politische Schriften “(Muenchen,
l921), pp. 396-450. Originally a speech at Munich University, 1918, published in 1919 by Duncker & Humblodt, Munich .
Wilcox P., Land K. (1996) “Perceived risk versus fear of crime: empirical evidence of
conceptually distinct reactions n survey data.” Social Forces, June, Vol. 74, Issue 4,
Appendix 1: Supplementary control variables from ENUSC 2011.
Variable Explanation
Sharing phone numbers Communitary Vigilance system
Safety controlling access to co-property
Collective security devices that neighbors share to prevent crime
Devices Private vigilance
Alarm
Guardian
Security camera Individual Electric Fences
Safety devices Non-Electric fences Security devices that individuals purchase in order to prevent crime Dog Alarm Public places Prevention Jewelry
Behaviors Carrying cash Things or places people avoid for preventing crimes Going out at night
Leaving house unattended Coming home late
Less than 1 year Length 1- 4 years
of 5 - 9 years How long inhabitants have lived in their homes residence 10 - 14 years 15 - 19 years 20 or more Assault Victmization Burglary
Surprise robbery I control for victimization rates at Community level (Except for corruption)
Violent robbery But also individual victimization
Theft
Corruption
ABC1
Social strata C2
C3 Definition of social strata according to Chilean nomenclature, using wealth and education D (these are not quintiles)
Appendix 2: Probit regressions using a quadratic term for inequalities.
(Assault) (Burglary) (Surprise robbery) (Violent robbery) (Theft) Inequalities (Gini coefficient) 7.121 4.968 15.107 1.027 17.389
(3.613)** (3.316) (3.241)*** (3.293) (3.286)*** Gini squared -6.827 -4.511 -16.651 -0.939 -18.555
(3.991)* (3.668) (3.584)*** (3.643) (3.631)*** Density (log) -0.073 -0.078 -0.040 -0.022 -0.079
(0.009)*** (0.009)*** (0.009)*** (0.009)** (0.009)*** Community wealth (log) -0.153 -0.070 -0.130 0.009 -0.141
(0.037)*** (0.036)* (0.035)*** (0.035) (0.035)*** Burglary rate 0.005 0.018 0.007 -0.025 -0.013
(0.007) (0.007)*** (0.007) (0.007)*** (0.007)** Violent robbery rate 0.047 -0.004 0.024 0.052 0.046
(0.007)*** (0.007) (0.007)*** (0.007)*** (0.007)*** Assault rate -0.084 -0.092 -0.092 0.030 -0.095
(0.013)*** (0.012)*** (0.012)*** (0.012)** (0.012)*** (0.050)*** (0.048) (0.047)* (0.048)** (0.047) Comercial patents / population (log) 0.009 0.010 0.054 -0.031 0.052
(0.016) (0.015) (0.015)*** (0.015)** (0.015)*** Alcohol patents / population (log) 0.061 0.133 -0.054 -0.033 -0.086
(0.039) (0.037)*** (0.036) (0.036) (0.036)** Sex (female) -0.125 0.103 0.261 -0.154 0.057
(0.032)*** (0.030)*** (0.030)*** (0.030)*** (0.030)* Age (log) -0.002 0.009 -0.004 -0.002 -0.003
(0.001)** (0.001)*** (0.001)*** (0.001)** (0.001)*** Previous vitmization (Burglary) -0.014 0.711 -0.203 -0.098 0.094
(0.056) (0.054)*** (0.052)*** (0.053)* (0.052)* Previous victimization (Violent robbery) 0.001 -0.139 -0.065 0.201 -0.017
(0.057) (0.056)** (0.054) (0.057)*** (0.053) Previous victmization (Assault) 0.299 -0.141 -0.188 0.274 -0.096
(0.081)*** (0.083)* (0.078)** (0.085)*** (0.079) (0.066) (0.061) (0.060) (0.061) (0.061) Property type dummies YES YES YES YES YES Length of residence dummies YES YES YES YES YES Safety devices dummies YES YES YES YES YES Behavioral preventio dummies YES YES YES YES YES Other crime rates
Individual and Community dummies
YES YES YES YES YES YES YES YES YES YES
_cons YES YES YES YES YES
N
Area under ROC curve
8,932 0,65 8,932 0,71 8,932 0,64 8,932 0,63 8,932 0,63 * p<0.1; ** p<0.05; *** p<0.01


![De sanctorum nominum gratia et potentia […] in schedulis digesta: Bestandserhaltung, Überlieferung und Interpretation der Reliquienauthentiken aus dem frühmittelalterlichen Maasgebiet](data:image/gif;base64,R0lGODlhAQABAIAAAP///wAAACH5BAEAAAAALAAAAAABAAEAAAICRAEAOw==)