Science Arts & Métiers (SAM)
is an open access repository that collects the work of Arts et Métiers Institute of Technology researchers and makes it freely available over the web where possible.
This is an author-deposited version published in: https://sam.ensam.eu Handle ID: .http://hdl.handle.net/10985/17556
To cite this version :
Véronique FAVIER, H. V. ATKINSON - Analysis of semi-solid response under rapid compression tests using multi-scale modelling and experiments - Transactions of Nonferrous Metals Society of China - Vol. 20, n°9, p.1691-1695 - 2010
Any correspondence concerning this service should be sent to the repository Administrator : [email protected]
Analysis of semi-solid response under rapid compression tests using
multi-scale modelling and experiments
V. FAVIER1, H. ATKINSON2
1. Arts et Métiers ParisTech, CNRS PIMM, 151 Boulevard de l’Hôpital, 75013 Paris, France; 2. Department of Engineering, University of Leicester, University Road, Leicester, LE1 7RH, UK
Abstract: Simulating semi-solid metal forming requires modelling semi-solid behaviour. However, such modelling is difficult
because semi-solid behavior is thixotropic and depends on the liquid−solid spatial distribution within the material. In order to better understand and model relationships between microstructure and behavior, a model based on micromechanical approaches and homogenisation techniques is presented. This model is an extension of a previous model established in a pure viscoplastic framework to account for elasticity. Indeed, experimental load−displacement signals reveal the presence of an elastic-type response in the earlier stages of deformation when semi-solids are loaded under rapid compression. This elastic feature of the behaviour is attributed to the response of the porous solid skeleton saturated by incompressible liquid. A good quantitative agreement is found between the elastic-viscoplastic predicted response and the experimental data. More precisely, the strong initial rising part of the load−displacement curve, the peak load and the subsequent fall in load are well captured. The effect of solid fraction on mechanical response is in qualitative agreement with experiments.
Key words: semi-solid metal; aluminium; solid fraction; elastic-viscoplasticity; homogenization
1 Introduction
Semi-solid metals exhibit time and strain rate dependent behaviour labelled as thixotropy: they behave like solids in the undisturbed state and like liquids during shearing provided the shear rate is high enough[1]. Semi-solid metal forming called thixoforming exploits this thixotropic and shear thinning behaviour since the semi-solid slug may be handle-able like a solid but also flow easily in the die. The use of finite element simulations to obtain the filling of the dies and to optimize the thixoforming process is clearly of great interest. To carry this out properly, the semi-solid flow and the heat transfer into the die have to be correctly described. In practice, various constitutive equations are used since discrepancies appear between experimental rheological data. In addition to the shear-thinning behaviour[2], the constitutive equation has to describe peculiar phenomena such as the presence or absence of a plastic threshold, normal and abnormal behaviour, namely hardening and softening stress−strain rate relationship[3−6]. In a previous work, FAVIER et al[7] proposed a constitutive equation accounting for the
mechanical role of four phases within the material: the solid globules, the solid bonds, the entrapped liquid and the free liquid. The evolution of the microstructure with the shear rate is captured via an internal variable that modifies the liquid−solid spatial distribution. This model, originally established in a viscoplastic framework, captures the transient response for shear rate jump tests for solid fraction lower than 0.5[7]. In this work, it is extended to account for elastic-viscoplastic behaviour. The transient behaviour was analyzed using rapid compression tests. Experimental load−displacement signals revealed the presence of an elastic-type response in the early stages of deformation[8−11]. The elastic feature of the behaviour is attributed to the response of the porous solid skeleton saturated by incompressible liquid. The rapid compression tests were simulated considering solid fraction higher than 0.5 and that the initial semi-solid material displays a continuous solid skeleton. The results were compared and discussed with the experimental data obtained in ATKINSON’s team[8]. Typically, the experimental load–displacement curve strongly increases up to a maximum and thereafter decreases and increases again. The strong initial rising part and the subsequent fall in load are well captured by
the modelling. It is shown that the fall in load originates from a 3D continuous solid skeleton, which breaks down under load as suggested in literature. The effect of solid fraction on the mechanical response is studied.
2 Background of semi-solid response under
rapid compression test
Fig.1 shows the load−displacement curves of semi-solid aluminium alloys under rapid compression trials at constant ram speed (500 mm/s) for various temperatures[8]. The curve corresponding to 574 °C and approximately to 0.7 solid fraction was focused on. Deformation in the initial rising part of the load−displacement curves but also in the subsequent parts is macroscopically homogeneous (deduced from microstructure observations in Fig.1). The strength of the semi-solid is mainly due to the solid skeleton strength. The entrapped liquid may contribute to carrying the load: the pressure in the entrapped liquid develops from the resistance to the motion of liquid in response to volumetric changes of the porous solid skeleton[11]. The behavior of the solid skeleton saturated with entrapped liquid is elastic-viscoplastic. Indeed, the load− displacement curves start from (0,0); the initial slope is high and has low sensitivity to the strain rate. However, the peak load increases with increasing strain rates[8]. The origin of the quite high strain sensitivity of the peak load is not clear. During this first stage, some grain boundary decohesion occurs. The subsequent fall in load is attributed to the breakdown of the 3D solid skeleton[7]. The lost of stiffness of the solid skeleton is thought to be very rapid and is followed by a slower disagglomeration process of the solid agglomerates. Behaviour in the final rising part is not completely understood. It may be linked to the increase of the strain rate due to the decrease of the current slug height. It may be also attributed to solidification phenomena leading to an increase in solid
Fig.1 Load signals and microstructures at different
temperatures for Alusuisse A356 Al alloy (Ram speed: 500 mm/s)[8]
fraction. These solidification phenomena would be due to thermal exchanges with the specimen environment.
3 Modelling
Based on micromechanics analysis and homogenization procedure, the present model is an extension of a previous model, developed to describe the transient response of semi-solids[7] and to capture the initial rising part of the load−displacement curves for rapid compression tests. Contrary to the previous model which assumes pure viscoplastic behavior, the new model assumes that semi-solids exhibit elastic- viscoplastic response when being loaded under rapid
compression. In the current work, the solid fraction, φs, is
higher than 0.4 and typically around 0.7. The representative volume element (RVE) of the studied semi-solid contains solid skeleton and isolated solid agglomerates, free liquid and entrapped liquid. The solid skeleton is considered as a porous solid phase saturated by an incompressible Newtonian fluid. The semi-solid is represented by a Voigt model having two branches (Fig.2). The first branch represents the solid skeleton saturated with entrapped liquid (K). The second branch contains the free liquid and the isolated solid agglomerates. It is labeled as concentrated suspension (C). The fraction of the saturated skeleton is ψ. The fraction of the concentrated suspension is 1−ψ.
Fig.2 Schematic representation of semi-solids for micro-
mechanical modeling
The choice of the Voigt model is justified by the fact that the deformation is macroscopically homogeneous. Thus, the strain rate tensors of K and C are given by
ε ε
ε&K =&C = & (1) where ε& is the overall strain rate. The overall stress is given by
C K (1 )σ σ
σ=ψ + −ψ (2)
where σK and σC are the average stress tensors of the
saturated skeleton and the concentrated suspension, respectively. When semi-solid deforms, parts of the solid skeleton break down to the complete failure of the 3D
solid network. As a result, semi-solid appears as a suspension composed of isolated solid agglomerates.
From modeling point of view, these changes are represented by the change of ψ with the overall strain and strain rates as follows:
eq eq s Kψ(1 ϕ )ε ε
ψ = D− − & (3)
where DK is constant and characterizes the
disagglomeration rate of the solid skeleton. The initial value of ψ is assumed to be given by
⎩ ⎨ ⎧ − = < ≤ = < s c init s c init c s / 1 , 1 0 , ϕ ϕ ψ ϕ ϕ ψ ϕ ϕ (4)
where φc is the percolation threshold prescribed at
0.4[12−13].
The saturated skeleton is assumed to have an elastic-viscoplastic behaviour: ) ( : K vpK K K c ε& ε& & = − σ (5)
where cK is the elastic moduli tensor and ε&Kvpis the viscoplastic strain rate of the saturated skeleton.
The viscoplastic behaviour is given by a power-law type equation: vp K 1 0 vp K eq, K vp K K K K 3 2 2 ε ε ε& & & & − ⎟ ⎟ ⎠ ⎞ ⎜ ⎜ ⎝ ⎛ = = m K γ μ s (6)
where sK is the deviatoric part of the stress tensor, ε&eq,vpK
is the von Mises equivalent viscoplastic strain rate, KK is
the consistency and mK is the strain rate sensitivity
parameter associated with the saturated skeleton. γ&0 is a reference slip rate equal to 1 s−1.
The concentrated suspension is assumed to behave as a non-Newtonian fluid:
C C C 2 ε
s = μ & (7)
where μC is the viscosity of the concentrated suspension.
This viscosity is given by the previous micro-macro model[7]. This model distinguishes the role of four mechanical phases: the isolated solid globules/ agglomerates, the solid bonds between the solid globules, the free liquid and the entrapped liquid. Note that, for the concentrated suspension, the entrapped liquid is trapped inside the solid spheroids and agglomerates (not inside the continuous 3D solid skeleton). The viscoplastic deformation is assumed to be accommodated by the solid bonds and the free liquid. In contrast, the solid isolated agglomerates deform very little though they contribute to increase the suspension viscosity. In a statistical representation, this complex microstructure is viewed as a spherical inclusion (I) gathering all the solid agglomerates entrapping some liquid surrounded by a coating composed of the solid bonds and the free liquid (Fig.2). As the overall deformation is mainly
accommodated by the coating, the coating is labeled as the active zone (A). The viscosity of the concentrated suspension is calculated by the self-consistent approximation developed for coated inclusion where the volume fraction of the active zone and the inclusion are
φA and φI=1−φA, respectively. In this model, the inclusion
and the coating are also two-phase systems. The coating (active zone) consists of the solid bonds and the
non-entrapped liquid with volume fractions ϕ and AS
1−ϕ , respectively. The inclusion is composed of both AS
solid and liquid with volume fractions ϕ and 1−IS ϕ , SI
respectively, to represent entrapped liquid within the solid agglomerates.
Assuming that the volumes of liquid and solid do not change, the following equations have to be checked:
V V V VKS CS S= + ϕ (8) V V V VKL CL S L =1−ϕ = + ϕ (9)
where V is the volume of the RVE. VKSand VCS are the
volumes of solid belonging to the skeleton and to the
concentrated suspension, respectively. VKL and VCL are
the volumes of liquid belonging to the skeleton and to the concentrated suspension, respectively. We can easily demonstrate that all theses quantities can be expressed as a function of V /KS V , ψ, ϕ . S We assume that S S K =ψ⋅ϕ V V (10)
Eq.(10) captures that when ψ or ϕ increases, S
the amount of solid belonging to the skeleton increases. As mentioned above, the breakdown of the solid 3D skeleton is followed by a disagglomeration process of the solid agglomerates, leading to a suspension having more and more isolated solid spheroids. To capture this microstructural change, we assume that the amount of solid bonds decreases as follows[7, 14]:
C bonds S A S S A (1 ) γ γ ϕ ϕ ϕ =− − & (11)
where γC is the critical shear required to break a solid
bond. γ&bonds is the average shear rate in the solid bonds. It is given by eq S A bonds 3(ε ) γ& = & (12)
where (ε&AS)eq is the average equivalent strain rate of the solid of the active zone. It is naturally deduced from the self-consistent model. Further details are found in Ref.[7].
Concerning the local behavior of the phases, the constitutive equations of the liquid phase and the solid
1694 phases are L L L L L 2 ; K S = μ &ε μ = (13) 1 0 b g, eq b g, b g, b g, b g, b g, .b g, ; 2 − ⎟ ⎟ ⎠ ⎞ ⎜ ⎜ ⎝ ⎛ = = m K S γ ε μ ε μ & & & (14)
The exponents ‘L’ and ‘g,b’ refer to the liquid and solid (globules and bonds) phases, respectively.
To determine the effective properties of the concentrated suspension, we firstly evaluated the overall behaviour of the inclusion and of the active zone from the behaviour of the solid and liquid phases. Secondly, we calculated the effective concentrated suspension. To do so, we used modeling based on micromechanics and homogenization techniques and the so-called self-consistent approximation. Further details are found in Ref.[7].
4 Results and discussion
Model parameters were identified to match the experimental curve obtained by LIU et al[8] for a solid fraction around 0.7 (574 °C) and a ram speed equal to 500 mm/s. The radius and the height of the initial slug were 18 mm and 44 mm, respectively. The parameters associated with the material representation are listed in Table 1. The rheological parameters are listed in Table 2. Note that the liquid viscosity was not identified but taken from experimental measurements[15]. Both set of parameters remain constant for all the subsequent simulations, unless otherwise stated.
Table 1 Set of parameters associated with representation of
material used for simulations of compression tests
S A,initial
ϕ DK/s−1 γC φA φc
0.401 200 1 0.04 0.4
Table 2 Set of constitutive parameters used for simulations of
compression tests
Skeleton Solid Liquid
σK/ MPa KK/ (Pa·s) mK Kg/ (Pa·s) Kb/ (Pa·s) m g=mb KL/ (Pa·s) 100 2.0×10⁷ 0.2 1.7×10⁶ 1.7×10⁶ 0.2 1.8×10⁻³
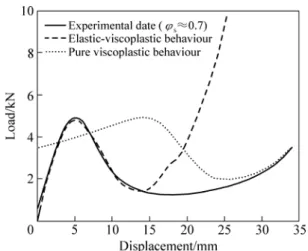
Fig.3 compares the experimental load−displacement curve with the calculated curves assuming an elastic-viscoplastic or pure viscoplastic behaviour for semi-solids. The predicted load−displacement for pure viscoplastic hypothesis is simply deduced from the elastic-viscoplastic model considering that the skeleton has pure viscoplastic behaviour. At the start of the compression, the load is mainly carried by the saturated skeleton. With assuming pure viscoplastic behaviour, the
predicted load displays a threshold Lc that does not exist
in the experiment (Fig.3). In addition, the initial slope is too low. However, a very good quantitative agreement is obtained with the elastic-viscoplastic model (accounting for elasticity) except at the end of the compression test where the slope is underestimated. During deformation, as the bonds of the solid skeleton break down, some liquid is released, and more and more isolated solid agglomerates are created. As a result, the contribution of the concentrated suspension increases and the overall behaviour becomes mainly viscoplastic.
Fig.4 shows the liquid viscosity sensitivity of the load−displacement curves. The slope clearly increases with increasing the liquid viscosity. This result suggests that the strong final experimental rising is attributed to solidification due to thermal exchanges between the specimen and its environment.
The load−displacement curves for different solid fractions are shown in Fig.5. In good agreement with the experiments of LIU et al[8], the model predicts that the
Fig.3 Experimental and predicted load−displacement curves
assuming elastic-viscoplastic or pure viscoplastic behaviour for semi-solids
Fig.4 Experimental and predicted load−displacement curves
after model parameter identification and for two liquid viscosities
Fig.5 Predicted load−displacement curves of isothermal
compression tests for different solid fractions
initial slope and the height of the peak fall with decreasing solid fraction (or increasing temperature). The minimum load before and beyond the peaks also decreases with decreasing solid fraction. The peak occurs at lower displacement with decreasing the solid fraction.
The fraction of skeleton decreases with decreasing overall solid fraction. As a consequence, the skeleton contribution to carry the load decreases at the start of the test (lower initial slope and peak load). Also, the concentrated suspension contributes more significantly at smaller displacements. Then, the load is reduced during the subsequent deformation because the suspension contains a smaller solid fraction.
5 Conclusions
The response of semi-solids during rapid compression was analyzed and modelled. The proposed model is an extension from a previous model to account for elastic-viscoplastic behaviour. The experimental transient behaviour was analysed using rapid compression tests. Experimental load−displacement signals revealed the presence of an elastic-type response in the earlier stages of deformation. The elastic feature of the behaviour is attributed to the response of the porous solid skeleton saturated by incompressible liquid. The rapid compression tests were simulated considering solid fraction higher than 0.5 and that the initial semi-solid material displays a continuous solid skeleton. Typically, the experimental load−displacement curve strongly increases up to a maximum and thereafter decreases and increases again. The strong initial rising part and the
subsequent fall in load are well captured by the modelling. It is shown that the fall in load originates from a 3D continuous solid skeleton, which breaks down under load as suggested in literature. The model predicts that the initial slope and the height of the peak fall with decreasing solid fraction.
References
[1] SPENCER D B, MEHRABIAN R, FLEMINGS M C. Rheological behaviour of Sn-15%Pb in the crystallization range [J]. Metallurgical Transactions, 1972, 3: 1925−1932.
[2] JOLY P A, MERHABIAN R. The rheology of a partially solid alloy [J]. Journal of Materials Science, 1976, 11: 1393−1418.
[3] LOUE W R, SUERY M, QUERBES J L. Microstructure and rheology of partially remelted Al-Si alloys [C]//BROWN S C, FLEMINGS M C. Proceedings of 2nd International Conference Semi-solid Processing of Alloys and Composites. Cambridge, MA, USA, 1992: 266−275.
[4] McLELLAND A R A, HENDERSON H G, ATKINSON H V, KIRKWOOD D H. Anomalous rheological behavior of semi-solid alloy slurries at low shear rates [J]. Materials Science and Engineering A, 1997, 232: 110−118.
[5] BURGOS G R, ALEXANDROU A N, ENTOV V. Thixotropic rheology of semisolid metal suspensions [J]. Journal of Materials Processing and Technology, 2001, 110: 164−176.
[6] KOKE J, MODIGELL M. Flow behavior of semi-solid metal alloys [J]. J Non-Newtonian Fluid Mech, 2003, 112: 141−160.
[7] FAVIER V, CEZARD P, BIGOT R. Transient and non-isothermal semi-solid behavior: 3D micromechanical modeling [J]. Materials Science and Engineering A, 2009, 517: 8−16.
[8] LIU T Y, ATKINSON H V, KAPRANOS P, KIRKWOOD D H, HOGG S C. Rapid compression of aluminium alloys and its relationship to thixoformability [J]. Metallurgical and Material Transactions A, 2003, 34: 1543−1553.
[9] OMAR M Z, PALMIERE E J, HOWE A A, ATKINSON H V, KAPRANOS P. Thixoforming of a high performance HP9/4/30 steel [J]. Materials Science and Engineering A, 2005, 395: 53−61. [10] SHIMAHARA, H, BAADJOU R, KOPP R, HIRT G. Investigation of
flow behavior and microstructure on X210CrW12 stell in semi-solid state [J]. Solid State Phenomena, 2006, 116/117: 189−192. [11] TZIMAS E, ZAVALIANGOS A. Mechanical behavior of alloys with
equiaxed microstructure in the semisolid state at high solid content [J]. Acta Mater, 1999, 47(2): 517−528.
[12] De GNNESFAVIER V, ROUFF C, BIGOT R, BERVEILLER M, ROBELET M. Micro-macro modeling of the isothermal steady-state behavior of semi-solids [J]. Int J Forming Process, 2004, 7: 177−194. [13] MARTIN C, KUMAR P, BROWN S B. Constitutive modeling and
characterization of the flow behaviour of semi-solid metal alloy slurries—Ⅱ. Structural evolution under shear deformation [J]. Acta Metallurgica and Materialia, 1994, 42: 3603 –3614.
[14] LUCAS L D. Viscosité des principaux métaux et métalloïdes [J]. Techniques de l’ingénieur, 1984 : M66.