1
Prediction of heterogeneous microstructural evolution in cold sprayed
copper coatings using local Zener-Hollomon parameter and strain
Zhiying Liua,1,Hongze Wanga,1, Michel J.R Hachéa, Xin Chua, Eric Irissoub, Yu Zoua*
aDepartment of Materials Science and Engineering, University of Toronto, Toronto, ON M5S 3E4, Canada bNational Research Council Canada, Boucherville, QC J4B 6Y4, Canada
Figure S1. (a) Schematic diagram of the cold spray system; (b) Surface temperature as
functions of inlet gas temperature and gas pressure [1].
The cold spray meter is used to measure the impact velocity of sprayed particles. The process involves preheating gas flow under the main gas heater and combining it with the powder-gas mixture from the high-pressure powder feeder in a premixing chamber (Figure S1(a)). When particles impact the substrate with high velocity, their kinetic energies are converted into plastic deformation and thermal energy, and the particles are deposited in a short time. The gas temperature can be used as an estimation of the initial deformation temperature of the powder particles, the variance between inlet gas temperature and surface temperature is nearly constant at all inlet gas pressures, shown in Figure S1(b).
2
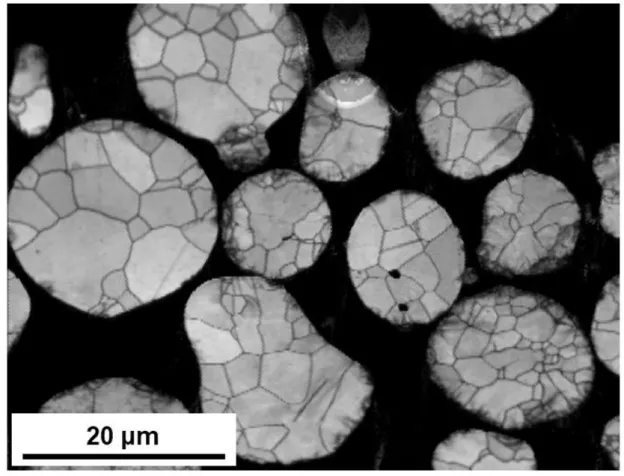
Figure S2. Image quality (IQ) map of as-received powders.
The IQ map of as-received powders shows a relatively high pattern quality of the grains, implying low defect density and lattice strain. A comparison of the as-received powders with as-sprayed coatings reveals the microstructural evolution during particle impact.
3
Table S1. The Johnson-Cook parameters of Cu.
A (MPa) B (MPa) C n m ϵ0̇ (s−1) T0 (K) 90 292 0.025 0.31 1.09 1 298
Table S2. Physical, thermal and mechanical parameters of Cu used in the FEM simulations.
Parameter Value
Density (kg/m3) 8960
Melting temperature (K) 1357 Specific heat (J/kg/K) 384.6 Thermal conductivity (W/m/K) 401
Young’s modulus (GPa) 140
Shear modulus (GPa) 48
4
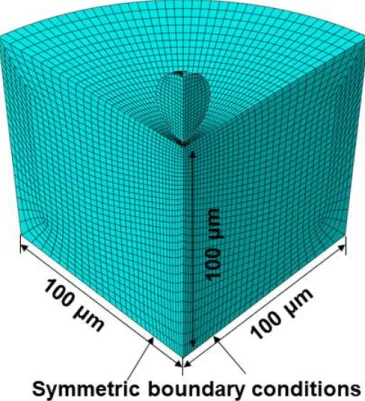
Figure S3. 3D model of the cold spray process.
Figure S3 shows the 3D model developed to estimate the thermal and mechanical histories of
sprayed particles (i.e., temperature, stress, strain, and strain rate) during the cold spray process. There was a total of 40,000 C3D8RT elements in the 3D model. A step number of 250 was set for this model, and the particle diameter was 25 µm. To reduce CPU time, an axisymmetric model with symmetry boundary conditions was used. Based on the simulation results, we choose a height of 100 μm to reach a balance between numerical accuracy and efficiency. Interface contact was simulated using the surface-to-surface penalty contact with a Coulomb friction coefficient 0.2 for tangential deformation. Furthermore, normal behavior and heat generated by friction were included in the contact properties. The particle and substrate were discretized using a thermally coupled element, with trilinear displacement, trilinear temperature, reduced integration and hourglass control. The mesh size was chosen such that the simulation model converged well. At the initial time (0 ns), the particles were defined with an initial downward velocity as shown in Table 1. Two approximations were made: i) actual particle temperature at impact could not be measured. The temperature of the particles was therefore assumed to be equal to the propelling inlet gas temperature as a pre-chamber was inserted before the nozzle to allow for proper heat transfer from the gas to the powder before
5
the acceleration. This approximation was deemed reasonable based on computational fluid dynamics which forecasted only a slight decrease in temperature during the process; ii) the cold spray powder particles were deposited as an isolated scenario. The subsequent particles posed a limited effect on the deformation of the already deposited layers.
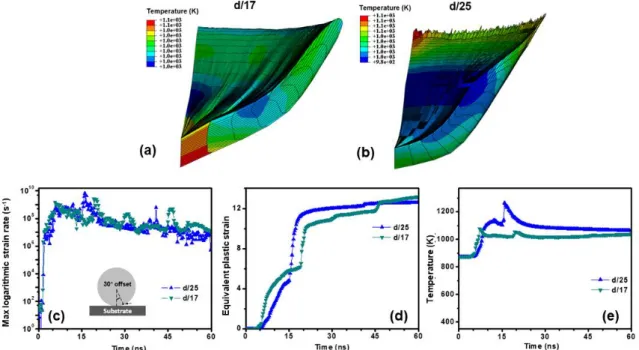
Figure S4. Comparison of the simulated shape of the particles at 60 ns with the mesh size of
the particle equal to (a) diameter/17 and (b) diameter/25; Comparison of the simulated results obtained from the models with the mesh sizes of the particle equal to diameter/17 and diameter/25: (c) max logarithmic strain rate; (d) equivalent plastic strain; (e) temperature. (Initial temperature: 873 K, particle velocity: 732 m/s).
With further refining the mesh size, both the simulated temperature distribution and the shape of a particle don’t have significant change, though jet appears at the mesh size of particle diameter/25. These simulated results don’t have significant changes when the mesh size is further refined. Also, the simulation model will terminate easily when the mesh size of the particle is further refined (e.g., diameter/30) due to the large local distortion of the elements in this thermal-mechanical coupled model, where the heat transfer equations put forwards higher requirements for the mesh quality than the deformation equations [2]. Finally, this mesh size leads to a good balance between calculation efficiency and accuracy.
6
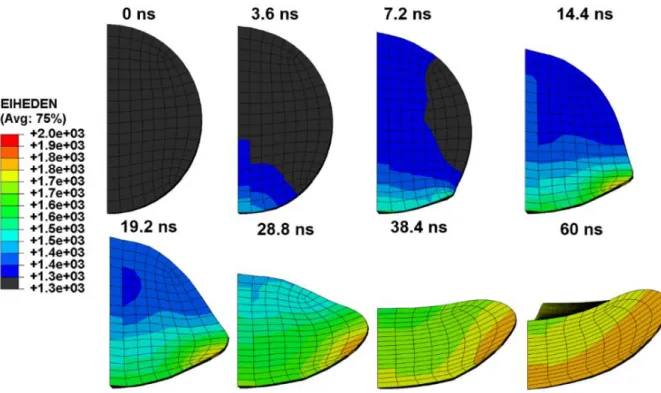
Figure S5. The simulated heat energy density distribution on the deformed particles varying
with time during the cold spray process output by the 3D model.
As shown, significant shape change happens during the spray process, and the shape of the particle changes from a ‘sphere’ to a ‘pie’. The increase of the heat during the cold spray process comes from the energy generated from plastic deformation, and the zone with the highest heat energy density represents the zone with the largest plastic deformation. According to the simulated heat energy density distribution, it could be inferred that the impact process between the particle and substrate firstly occurs at the bottom of the particle before 7.2 ns, then the maximum deformation zone moves from the bottom to the edge of the particle.
7
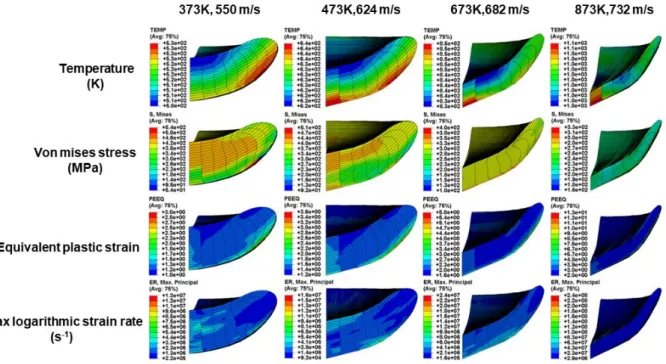
Figure S6. Simulated profiles of the temperature, VonMises stress, equivalent plastic strain
and max logarithmic strain rate at 60 ns output by 3D model.
As shown, the profiles of temperature, Von Mises stress, equivalent plastic strain, and max logarithmic strain rate during cold spray at different processing temperatures are simulated. With a decrease in processing temperature and particle impact velocity, the deposited particles are less flattened. Also, the simulated von Mises stresses at both the edge and the center of the particle increase while the simulated equivalent plastic strain decreases due to a less pronounced thermal softening effect. The differences in strain rates at different temperatures are small. The simulated maximum plastic strain at the particle edge significantly decreases from 1316% (processing temperature - 873 K; velocity - 732 m/s) (at 60 ns) to 253% (processing temperature - 373 K; velocity - 594 m/s). The detailed values of simulated temperature, stress, strain and strain rate at the particle edge (with an offset of ~30° where the maximum strain occurs) and particle center are output for all analyses.
8
Figure S7. Variations of LnZ with impact time during the cold spray process: (a) the edge
point with 30° offset from the contact point between the particle and substrate, and (b) the center point of the particle.
9
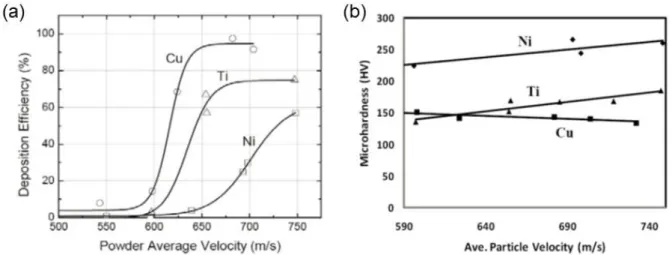
Figure S8. Deposition efficiency (%) (a) and average Vickers hardness (HV) (b) evolution at
different particle impact velocities and of different powders. (Data provided by Ahmad Rezaeian and Stephen Yue)
Compared with titanium and nickel, recrystallization occurs easier in copper due to the lower stacking fault energy. The recrystallization process helps to soften the materials and thus leads to high deposition efficiency. Also, the average Vickers hardness was measured using over 20 indents per sample using a Clark CM-100AT Microhardness Tester (Sun-Tec, Novi, USA) at a load of 100 g and a hold time of 15 s. The variation of average hardness is determined by the competition between work hardening due to continuous particle impacts and a thermal softening effect following impact. When the temperature increases, thermal softening by recrystallization dominates the process, resulting in a decrease in hardness in copper. While in titanium and nickel, thermal softening by recrystallization is less pronounced than the work hardening effect, leading to higher average hardness.
10
Figure S9. Recrystallization fraction (a) and the average size of recrystallized grains (b)
determined from EBSD results at different processing temperatures.
Increasing the processing temperature facilitates the recrystallization process. The recrystallization kinetics can be estimated by the Johnson–Mehl–Avrami–Kolmogorov (JMAK) equation [3]: X(t) = 1 − exp (−B𝑡𝑛 ), where X(t) is the time-dependent fraction of recrystallized area, n is a constant (JMAK exponent) and B is a temperature-dependent parameter. B can be expressed by the Arrhenius law: B = 𝐵0 × exp (−𝑄𝑅/𝑅𝑇), where B0 is a
constant, R is the gas constant, and T is the absolute temperature in Kelvin. Hence, the recrystallization fraction of Cu will increase as a result of the increase in temperature within the coating which is caused by the plastic deformation of particles and the increased temperature of the processing gas during spraying.
11
Figure S10. TEM images of recrystallized grains and annealing twins at 873 K.
When the particles are deposited at high temperature, dislocation-based activity is pronounced, which leads to a high density of dislocations and promotes the formation of defect-free recrystallized grains, within which the annealing twins are formed during grain growth.
12
Figure S11. TEM images of shear bands and elongated grains at 673 K.
Shear bands and elongated grains are observed. It is obvious that when approaching the inter-particle boundaries, the shear bands evolve from continuous to discontinuous. This phenomenon can be explained by the intersection between shear bands and sub-grains near the inter-particle boundaries.
13
Figure S12. TEM images of deformation twining at 473 K.
Figure S12 shows the deformation twins with a small width. The width value measured by the software in TEM is below 10 nm, which is seldom obtained by dynamic plastic deformation (DPD) [4-7]. As we know, deformation twinning prefers to occur in Cu when deformed at either low temperatures (e.g., DPD) or high strain rate (e.g., cold spray). Hence, this work demonstrates that extremely fine deformation twinning (<10 nm) can be obtained under an extremely high strain rate (~1010 s-1) even at a high temperature (~473 K).
14
Figure S13. TEM images of nano-grains at the inter-particle boundaries at 373 K.
These nanograins are only observed at 373 K, indicating the effect of processing temperature on microstructural evolution. The finer grains of about 20 nm in size are commonly observed near the inter-particles boundaries, indicating higher plastic stain and LnZ promote the formation of finer grains, which is similar to what has been observed in cold sprayed aluminum [8].
15
References:
[1] E. Irissou, J. Legoux, C. Moreau, A. Ryabinin, How cold is cold spray? An experimental study of the heat transfer to the substrate in cold gas dynamic spraying, International Thermal Spray Conference & Exposition: Thermal Spray Crossing Borders, 2008, pp. 2-4.
[2] W.-Y. Li, W. Gao, Some aspects on 3D numerical modeling of high velocity impact of particles in cold spraying by explicit finite element analysis, Applied Surface Science 255(18) (2009) 7878-7892. [3] F.J. Humphreys, M. Hatherly, Recrystallization and related annealing phenomena, Elsevier2012. [4] W. Zhao, N. Tao, J. Guo, Q. Lu, K. Lu, High density nano-scale twins in Cu induced by dynamic plastic deformation, Scripta materialia 53(6) (2005) 745-749.
[5] G.H. Xiao, N.R. Tao, K. Lu, Effects of strain, strain rate and temperature on deformation twinning in a Cu–Zn alloy, Scripta Materialia 59(9) (2008) 975-978.
[6] N. Tao, K. Lu, Dynamic plastic deformation (DPD): a novel technique for synthesizing bulk nanostructured metals, JOURNAL OF MATERIALS SCIENCE AND TECHNOLOGY-SHENYANG- 23(6) (2007) 771.
[7] Y. Li, N. Tao, K. Lu, Microstructural evolution and nanostructure formation in copper during dynamic plastic deformation at cryogenic temperatures, Acta Materialia 56(2) (2008) 230-241.
[8] K. Wang, N. Tao, G. Liu, J. Lu, K. Lu, Plastic strain-induced grain refinement at the nanometer scale in copper, Acta Materialia 54(19) (2006) 5281-5291.
