Species identification and connectivity of
marine amphipods in Canada’s three oceans
Astrid Tempestini1*, Søren Rysgaard2,3,4, France Dufresne51 De´partement de biologie et Que´bec Oce´an, Universite´ du Que´becàRimouski, Rimouski, QC, Canada, 2 University of Manitoba, Centre for Earth Observation Science, Winnipeg, MB, Canada, 3 Greenland Institute of Natural Resources, Nuuk, Greenland, 4 Aarhus University, Arctic Research Centre, Aarhus, Denmark, 5 De´partement de biologie et Centre d’e´tude Nordique, Universite´ du Que´becàRimouski, Rimouski, QC, Canada
*astrid.tempestini@gmail.com
Abstract
Monitoring the distribution of marine biodiversity is a crucial step to better assess the impacts of global changes. Arctic marine fauna is dominated by amphipods in terms of abundance and biomass. These peracarids are an important marine order of crustaceans but the number of species found in the different Canadian oceans is currently unknown. Fur-thermore, most species are difficult to identify due to poor taxonomic descriptions and mor-phological convergence. The aim of this study was to assess the species diversity of marine amphipods in the three Canadian oceans using DNA barcoding. To do so, we produced a database of DNA barcodes of amphipods from the three Canadian Oceans publicly avail-able from the BOLD website to which we added 310 new sequences from the Canadian Arc-tic Archipelago. We first delimited amphipod species based on barcode gap detection techniques and tree based method (bPTP) and then compared the composition of amphi-pods among the three oceans in order to assess the influence of past transarctic exchanges on Arctic diversity. Our analysis of 2309 sequences which represent more than 250 provi-sional species revealed a high connectivity between the Atlantic and Arctic Oceans. Our results also suggest that a single threshold to delimitate species is not suitable for amphi-pods. This study highlights the challenges involved in species delimitation and the need to obtain complete barcoding inventories in marine invertebrates.
Introduction
Oceans cover most of the planet, but are still poorly known in terms of biological composition and species richness [1–4]. As climate changes and human pressures are growing, understand-ing the distribution of marine biodiversity is a crucial step towards an effective monitorunderstand-ing of marine ecosystems [2]. Nonetheless, numerous species of marine invertebrates are still await-ing taxonomic description [4]. The identification and estimation of species diversity based on a single genetic locus often appears the best option available for groups for which taxonomy is poor or inexistent [5,6].
DNA barcoding proposed by [7] is a method for identifying unknown specimens to taxo-nomic entities based on sequence similarity of mitochondrial DNA (mtDNA) sequences [8,9]. a1111111111 a1111111111 a1111111111 a1111111111 a1111111111 OPEN ACCESS
Citation: Tempestini A, Rysgaard S, Dufresne F
(2018) Species identification and connectivity of marine amphipods in Canada’s three oceans. PLoS ONE 13(5): e0197174.https://doi.org/10.1371/ journal.pone.0197174
Editor: Roberta Cimmaruta, Universita degli Studi
della Tuscia, ITALY
Received: October 17, 2017 Accepted: April 27, 2018 Published: May 23, 2018
Copyright:© 2018 Tempestini et al. This is an open access article distributed under the terms of the
Creative Commons Attribution License, which permits unrestricted use, distribution, and reproduction in any medium, provided the original author and source are credited.
Data Availability Statement: All sequences are
available from the genbank database.
Funding: This work was supported by the Natural
Sciences and Engineering Research Council of Canada (http://www.nserc-crsng.gc.ca/index_fra. asp), 222948, to FD. SR was supported by the Canada Excellence Research Chair program. The funders had no role in study design, data collection and analysis, decision to publish, or preparation of the manuscript.
Competing interests: The authors have declared
Inexact matches are either grouped with taxa already present in the database or identified as new based on whether they fall within a threshold of sequence similarity [8]. Therefore, delim-iting species based on barcode requires setting a specific threshold beyond which two
sequences will belong to different putative species referred as molecular operational taxonomic units (MOTUs). Several methods have been developed to delimitate species using single locus data such as the barcode gap detection [5,10,11] or based on phylogenetic trees [12,13]. These methods have been successfully used in the exploration of biodiversity in insects [12], in crustaceans [10,14,15], in polychaetes [16], in echinoderms [17]. However, the delimitation of species based on a single locus can be problematic due to incomplete lineage sorting, hetero-plasmy, introgression, young species showing no variation at COI or because it relies on taxo-nomic data [18–20]. Despite its constraints, DNA barcoding has become an important tool in biodiversity investigation leading to an increase amount of barcode data available.
Marine crustaceans are notoriously difficult to identify to the species level by traditional approaches due to their enormous morphological diversity and because morphological stasis is frequent in this group [21,22]. Despite a decade of barcoding, only 7000 crustacean species have been barcoded out of a total of 67,000 described species so far, and it is estimated that there could be as many as 150,000 species world-wide [23]. In crustaceans, barcode gap detec-tion as proposed by [7] has proven to be an efficient tool to discriminate species like marine crustaceans [22,23], and more specifically in decapods [24] and amphipods [25,26].
Amphipods are small crustaceans characterized by a direct development and weak active dispersal capabilities [27]. These characteristics favor cryptic speciation and endemism, and prevent widespread distribution as has been documented in isopods [28]. Despite their key role in the arctic food web [29], little is known about the biodiversity of marine amphipods. Amphipods dominate the arctic marine fauna in terms of abundance and biomass [30]. Despite the fact that Arctic regions are already impacted by global warming, the Arctic Ocean is one of the less understood region in the world and its marine biodiversity is one of the least characterized [30–33]. Arctic marine biodiversity has been shaped by the complex history and environment of this region. At least six openings of the Bering Strait since 5.5 million years ago have allowed trans-Arctic exchanges and invasions of the North Atlantic region by the North Pacific species [34–36]. Moreover, Quaternary glaciations have pushed some taxa out of the Arctic and recolonisation of the Arctic occurred from neighboring oceans during intergla-cial periods [17]. Several studies have documented these transarctic exchanges in molluscs [34,
37], in algae [38], in fishes [39,40] and in polychaetes [16]. So, over millions of years, marine species have dispersed through the Arctic several times leading to a complex pattern of biodi-versity [17].
In this study, we investigated the species delimitation of amphipods and the biodiversity of marine arctic amphipods using publicly available DNA barcodes to which we added new sequences for amphipods from the Canadian Arctic Archipelago. Our aims were 1) to test spe-cies delimitation using both distance-based and coalescent methods and 2) to assess large-scale connectivity of marine amphipods across the three Canadian oceans.
Materials and methods
Sampling and DNA amplification
Samples of Arctic amphipods were collected in 2011 in the Canadian Arctic Archipelago dur-ing the NCGS Amundsen expedition usdur-ing vertical and/or horizontal nets with 200, 500 and 750μm mesh size. Samples from Greenland were provided by the Greenlandic Institute of Natural Resources. Specimens from the southeastern Bering Sea were collected in 2012 during the Bering-Aleutian Salmon International Survey with a 500μm mesh bongo net [41].
Specimens from Prince William Sound in the Gulf of Alaska were collected in 2013 with a 500μm mesh ring net. All individuals were preserved in 95% ethanol. Samples were identified to the species level with appropriate taxonomic keys [42,43] when possible. Description of samples with geographic cordinates can be found under the “CAAB” (Canadian Arctic Amphipods Barcodes) project available in BOLD (www.boldsystem.org).
The DNA of 374 samples was extracted using the E.Z.N.A tissue extraction kit (Omega-bio-tek), or the QuickExtract kit (Omegabiotek) following the manufacturer’s protocols. Individu-als with a body size > 10 mm were extracted using one or two pereopods. IndividuIndividu-als with a size < 10 mm were used whole for the extraction. A 658 base pair (bp) fragment of the mito-chondrial cytochromec oxidase subunit I gene was amplified using the primer pair LCO1490/ HCO2198 [44]. Polymerase chain reaction (PCR) was conducted as described in [45]: the reac-tion mix contained 1X PCR buffer, 2.2 mM MgCl2, 0.5 mM dNTPs, 0.4μM of each primer, 1.5
U of Taq DNA polymerase (Life Technologies, Mississauga, ON, Canada), DNA template (around 40–80 ng), and water for a final volume of 25μl. PCR were performed with an initial denaturation step of 3 min at 94 ˚C, followed by 5 cycles of 45 s at 94 ˚C, 45s at 46 ˚C, 45 s at 72 ˚C and 35 cycles of 45 s at 94 ˚C, 40 s at 51˚C, 45s at 72 ˚C, and a final elongation step of 5 min at 72 ˚C. All PCR products were verified on a 1.5% agarose gel and direct-sequenced by Genome Quebec (McGill University, Montreal, Canada). Over the 374 individuals used, 310 individuals were successfully sequenced and their chromatograms were manually checked on MEGA7 [46].The presence of pseudogenes was assessed by translating sequences into amino acids. All sequences were deposited in the the project “CAAB” (“Canadian Arctic Amphipod Barcodes”) available in BOLD and in GenBank database under the accession numbers MH330696—MH331009.
Dataset and molecular operational taxonomic units construction
Sequences found after searching in December 2017 for “Amphipoda” from Canada, Greenland and United States in the public data portal of BOLD conducted were combined to our data. All sequences were aligned using MUSCLE [47] available in the BOLD sequence analysis tools. The final dataset contained 2309 sequences from the three canadian oceans (S1 Table). As reli-able MOTU depends on the accuracy of the MOTU retrieved with different methods [48,49], we chose to used several gap discovery methods (Barcode Index Number, MOTHUR, ABGD) and coalescent process (bPTP) to find the number of MOTU present in our dataset.
Barcode Index Number (BIN). The Barcode index number was constructed by first using
a 2.2% p-distance threshold for clustering sequences and then each cluster was refined by the examination of the genetic divergence among neighbors [50]. Each cluster was described with a unique and specific identifier (e.g. Barcode Index Number or BIN), already available or newly created if the sequences are clustered in an unknown BIN [50]. Sequences were aligned using Kimura-2 parameters (K2P) [51], with MUSCLE [47]. All analyses were conducted in BOLD with sequence analysis tools.
MOTHUR. We used MOTHUR [52] to cluster our sequences into provisional species (referred as MOTU). In the literature, several thresholds are reported for delimiting species: a 3% threshold commonly used to define species [53], a 4% threshold proposed by [25], a 16% threshold for amphipods species proposed by [10]. Uncorrected pairwise distances were first computed for each threshold values and sequences were clustered into MOTU using the near-est neighbor method considering each gap. Briefly, this method allows the clustering of sequences in the same MOTU if they are at most X% distant from the most similar sequence in the MOTU.
In order to associate taxonomy to MOTUs, we created a molecular taxonomic database containing all amphipods identified to the species level and its barcode sequence. To do so, we selected all amphipod sequences from BOLD with the following criteria: taxonomic identifica-tion at least to the genus level and a COI sequence longer than 500 bp. All sequences were aligned with MAFFT version 7 web server [54] and trimmed to 501 bp. After the construction step, each MOTU was aligned to the reference database with a confidence threshold of 90%. In order to assess the accuracy of our molecular identification, we aligned 305 sequences of 43 taxonomic identified species to our taxonomic database. As no discrepancy was observed, we confirmed the validity for MOTU identification. All analyses were performed with MOTHUR [52].
Automatic Barcode Gap Discovery (ABGD)
Since intra-specific divergences are smaller than inter-specific ones [55], a gap in the distribu-tion of all pairwise distances can be identified using the Automatic Barcode Gap Discovery method available atwww.abi.snv.jussieu.fr/public/abgd. This method is described in detail in [5]. Briefly, the data was first partitioned into a number of groups (i.e. species) such that the distance between two sequences taken from distinct groups was always larger than a given threshold distance and then appply recursively this procedure to get a better partitioning of the data into putative species [5]. We used the default value of 0.001 for the minimum intraspe-cific distance and 0.3 for the maximum intraspeintraspe-cific distance, with 10 steps and K2P distance. We explored the relative gap width (X) for X = 0.5 and X = 1. After the barcode gap discovery, sequences were clustered into MOTU based on the estimated threshold.
Coalescent approach. Poisson Tree Process is a model for delimiting species based on a
rooted tree with branching events representing the number of substitutions [13]. As a large dataset is computer challenging, we selected unique sequences to reconstruct the tree and then performed the analysis. To reconstruct the tree, we rooted it withPandalus borealis (Krøyer, 1838) (accession: KY018893.1). We selected the evolutionary model using the Bayesian Infor-mation Criterion (BIC) available at W-IQ-TREE [56]. We generated a phylogeny under the General Time Reversible model with empirical frequency, invariable site and under gamma rate (GTR+F+I+G4) using Bayesian inferences in MrBayes 3.2.6 [57] available atwww.phylo. org, using two runs for 10,000,000 generations until convergence was observed. Trees were sampled every 10,000 generations and the first 25% of sampled tree were discarded as burn-in. The posterior probabilities (PP) were calculated with the 50% majority-rule consensus tree. We used the web version of bPTP (http://species.h-its.org/ptp/) to generate the species delimi-tation under a coalescent process. Analysis was conducted with 500,000 iterations of MCMC and 25% burn-in. We also removed the outgroup to improve the delimitation.
Diversity among the three canadian oceans. To provide an overview of the similarity in
the MOTU composition among the three oceans, a Venn diagram was obtained for each threshold.
Species threshold identification
As the thresholds proposed by [10] or by [25] were based on a single family of amphipods, we used the same method to identify a species threshold for all Amphipoda. To do so, we collected all amphipod sequences from BOLD (January, 2016). Among the 15516 records, all sequences without a taxonomic identification to the species level, with less than 500 bp or associated with pseudogenes were discarded. A total of 8471 sequences corresponding to 89 families were examined further. Families with less than 30 sequences or containing less than 3 species were also discarded from this dataset. The diversity assessments for the amphipods and for the most
represented families were analysed from the data set with 3879 sequences from 272 species, 70 genera, and 10 families. After performing a first alignment with MAFFT [54], all sequences were trimmed to the same length of 501 bp. After this step, Kimura 2 parameters pairwise dis-tances were computed at each taxonomic level intrafamily (F), intragenus (G) and intraspecies (S) in MEGA7 [46] and plotted by family using the boxplot representation available in R and described in [10]. Based on the ABGD, we estimated a general threshold to 7%. Three ranges of thresholds (3%, 7% and 16%) were plotted to see which one best discriminated the different amphipod species.
Results
Nucleotide diversity
Out of a total of 310 sequences obtained, 5 sequences contained stop codon and were removed from the analysis. All sequences were clustered into 28 MOTUs representing 26 BIN of which 3 were uniques. The mean GC content was 32.9%. Intraspecific K2P distance ranged from 0.6 to 18.07% and interspecific distance ranged from 1.3 to 27.3%.
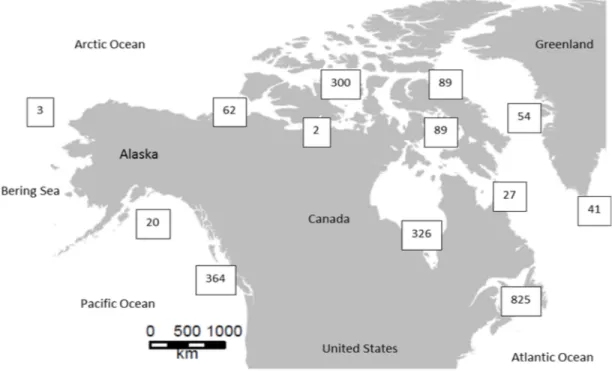
The complete dataset consisted in 2309 sequences that were trimmed to the same length of 400 bp. Within the final alignement, 94 conserved sites and 277 parsimony informative sites were detected. The mean GC content was high (GC = 38.01%). Intraspecific K2P distance ran-ged from zero to 33.33% and interspecific distance ranran-ged from 0.17 to 32.14%. There were 418 sequences from locations within the Pacific Ocean, 998 sequences from the Arctic region and 892 from the Atlantic (Fig 1).
Gap distance based methods
BOLD. All 2309 sequences were grouped into 285 MOTUs and 263 BINs, of which 83
BINs were unique (Table 1,S2andS3Tables). Among these 285 MOTUs, 113 were from the Arctic, 91 were from the Atlantic and 105 were from the Pacific. Nineteen MOTUs were shared between the Arctic and the Atlantic, three were shared between the Pacific and the Atlantic, and three were shared between the Pacific and the Arctic. A single MOTU was shared among the three oceans (Fig 2A).
Barcode gap detection with ABGD
The distribution of K2P genetic distances displayed two modes separated by a gap (‘barcode gap’) between 0.04 and 0.8. The ABGD method split 2309 sequences into 242 groups over a wide range of prior maximum divergence (P = 0.046416—P = 0.100000) after 20 partitions for X = 1 and after 23 partitions for X = 0.5 (Table 1,S1 Fig). All analyses produced a single group when P = 0.11. Among the 242 groups, 94 were from the Arctic, 84 from the Atlantic, and 88 from the Pacific (Fig 2B). One MOTU was shared between the Arctic and the Pacific, two between the Atlantic and the Pacific, and one among the three oceans. Nineteen MOTUs were shared between the Atlantic and the Arctic.
MOTHUR
The 3% threshold allowed the identification of 261 MOTUs (Table 1), for which 100 were from the Arctic, 86 from the Atlantic, and 97 from the Pacific (Fig 2C). Eighteen MOTUs were shared between the Arctic and the Atlantic. In contrast, three MOTUs were shared between the Arctic and the Pacific and two between the Atlantic and the Pacific, of which one MOTU was common among the three oceans and identified asThemisto libellula (Lichtenstein in Mandt, 1822) (Fig 2C). A large proportion of MOTUs belonged to the Gammaridae,
Ischyroceridae, Hyalidae and Aoridae families (Fig 3A). We were unable to identify 6 MOTUs to taxonomic level. At the species level, several species were found in the three oceans: Ampe-lisca spinipes (Boeck, 1861), Aora gracialis (Spence Bate, 1857), Parhyale hawaiensis (Dana, 1853),Microphasma agassizi (Woltereck, 1909), Pontogeneia inermis (Krøyer, 1838), Tiron bio-cellata (Barnard, 1962), Weyprechtia pinguis (Krøyer, 1838). As only one shared MOTU was detected between the three oceans, it suggests that these species consist of distinct MOTUs (Table 2).
Under the 4% threshold, 251 MOTUs were found for which 97 were in the Arctic, 84 in the Atlantic and 94 in the Pacific (Table 1,Fig 2D). Twenty MOTUs were shared between the Arc-tic and the AtlanArc-tic. Three MOTUs were shared between the ArcArc-tic and the Pacific, and two MOTUs between the Atlantic and the Pacific among which one MOTU is shared among the three oceans. Six MOTUs were shared among the three oceans and identified asAmpelisca spi-nipes (Boeck, 1861), Aora gracilis (Spence Bate, 1857), Microphasma agassizi (Woltereck, 1909),Pontogeneia inermis (Krøyer, 1838), Parhyale hawaiensis (Dana, 1853), Themisto
Fig 1. Map of the sampling location of each sequence used in this study.
https://doi.org/10.1371/journal.pone.0197174.g001
Table 1. Number of MOTUs found according to the method used.
Method Threshold Number of MOTUs
BOLD BIN 263 MOTU 285 ABGD X = 0.5 242 X = 1 242 MOTHUR 3% 261 4% 251 16% 173 bPTP 265–287 https://doi.org/10.1371/journal.pone.0197174.t001
libellula (Lichtenstein in Mandt, 1822), Weyprechtia pinguis (Krøyer, 1838), Tiron biocellata (Barnard, 1962) respectively (Table 2). Most MOTUs belong to the Gammaridae, Hyalidae and Ischyroceridae families (Fig 3B). Six MOTUs were not assigned to a taxonomic level.
Under the 16% threshold, 173 MOTUs were found, for which 59 were in the Arctic, 70 in the Atlantic and 75 in the Pacific (Table 1,Fig 2E). Twenty-one MOTUs were shared between the Arctic and the Atlantic. Three MOTUs were shared between the Arctic and the Pacific and nine MOTUs were shared between the Atlantic and the Pacific. Six MOTUs were shared
Fig 2. Venn diagram of shared MOTUs among the three oceans: Arctic (pink), Atlantic (green) and Pacific (blue).
The number of MOTUs in each group and shared between groups is indicated. A: MOTUs were defined with a 3% threshold. B: MOTUs were defined with a 16% threshold. C: MOTUs were defined with a 4% threshold.
https://doi.org/10.1371/journal.pone.0197174.g002
Fig 3. Distribution of MOTUs by family and ocean. MOTUs are defined based on a threshold of A) 3%, B) 4%, C) 16%. Atlantic MOTUs are represented in green, Pacific MOTUs in blue and Arctic MOTUs are in pink.
among the three oceans and identified asAmpelisca spinipes (Boeck, 1861), Aora gracilis (Spence Bate, 1857),Anonyx nugax (Phipps, 1774), Ischyrocerus anguipes (Krøyer, 1838), Microphasma agassizi (Woltereck, 1909), Pontogeneia inermis (Krøyer, 1838), Themisto libel-lula (Lichtenstein in Mandt, 1822), respectively (Table 2). Most MOTUs belong to the Gam-maridae family and the Aoridae family (Fig 3C). Only 11 MOTUs were not assigned to a taxonomic level.
Tree based method
The tree-based bPTP analysis estimated the number of species between 265 and 287 with a mean of 275 species (S2 Fig,S4 Table) with high posterior probablilities (>0.5).
Canadian Arctic diversity
The family identification showed that not all the locations and the families were well sampled across the three Canadian oceans (Fig 3C). Eight families (Bathyporeiidae, Gammaracanthi-dae, IphimediGammaracanthi-dae, PallaseiGammaracanthi-dae, PhotiGammaracanthi-dae, PleustiGammaracanthi-dae, PseudocrangonyctiGammaracanthi-dae, and Urothidae) were represented by a single MOTU in one location. The Gammaridae family had the highest number of MOTUs (Fig 4).
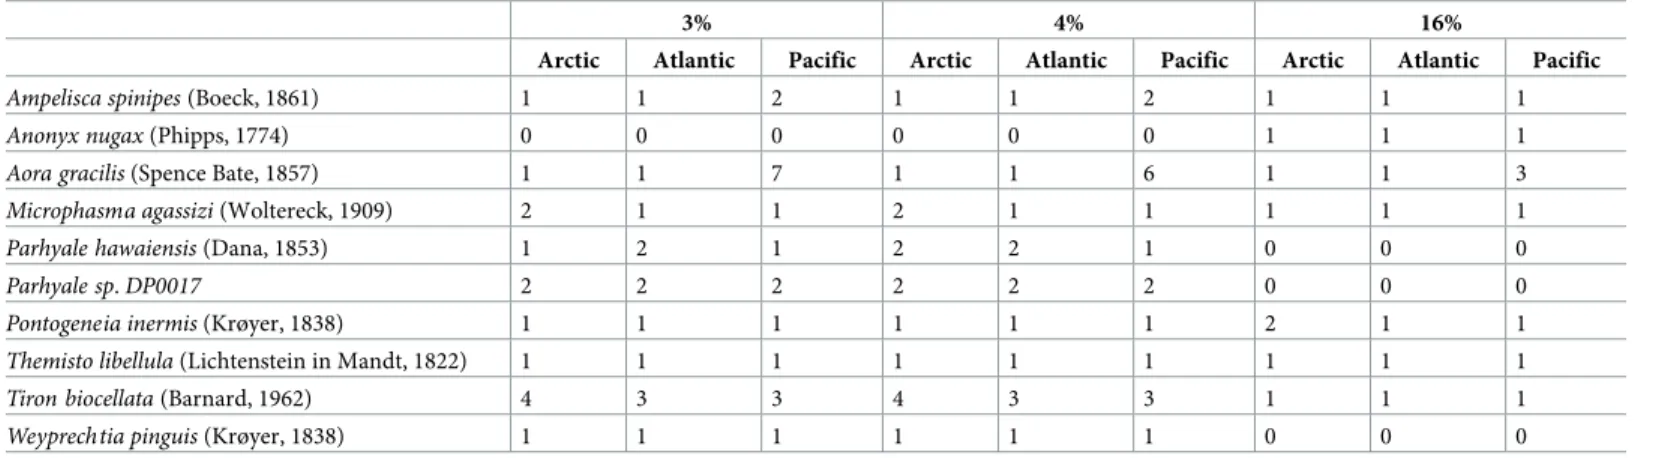
Table 2. Species found in the three oceans.
3% 4% 16%
Arctic Atlantic Pacific Arctic Atlantic Pacific Arctic Atlantic Pacific
Ampelisca spinipes (Boeck, 1861) 1 1 2 1 1 2 1 1 1
Anonyx nugax (Phipps, 1774) 0 0 0 0 0 0 1 1 1
Aora gracilis (Spence Bate, 1857) 1 1 7 1 1 6 1 1 3
Microphasma agassizi (Woltereck, 1909) 2 1 1 2 1 1 1 1 1
Parhyale hawaiensis (Dana, 1853) 1 2 1 2 2 1 0 0 0
Parhyale sp. DP0017 2 2 2 2 2 2 0 0 0
Pontogeneia inermis (Krøyer, 1838) 1 1 1 1 1 1 2 1 1
Themisto libellula (Lichtenstein in Mandt, 1822) 1 1 1 1 1 1 1 1 1
Tiron biocellata (Barnard, 1962) 4 3 3 4 3 3 1 1 1
Weyprechtia pinguis (Krøyer, 1838) 1 1 1 1 1 1 0 0 0
Numbers represent the number of MOTUs from each ocean identified to the species level. MOTUs are defined with a 3%, 4% and 16% threshold respectively.
https://doi.org/10.1371/journal.pone.0197174.t002
Fig 4. Number of MOTUs identified to the family level according to the species threshold used (3% light grey; 4% grey and 16% dark).
As expected, the number of MOTUs decreased with an increase of the threshold value used for all families (Fig 4). Six families were equally recovered (Bathyporeiidae, Corophidae, Iphi-mediidae, Pallaseidae, Pleustidae, Pseudocrangonyctidae) regardless of the threshold.
Species threshold
Divergences were estimated for the validated dataset from 3879 sequences representing 272 species, 79 genera, and 10 families. As expected, genetic divergence increased with taxonomic rank: a higher divergence was observed at the family level (K2P from 0 to 0.9), than at the genus level (K2P from 0 to 0.7), and the species level (K2P from 0 to 0.3). However, the thresh-old used to delimit species varied among families (Fig 5). The threshold proposed by [10] (0.16 substitution/site) discriminated well the Gammaridae species but not the other amphipods species from different genera. The lowest species divergence was observed in the Melitidae (0.001), the lowest genus and family divergences were observed in the Hyperiidae (0.26). The highest species (0.3) and genus (0.7) divergence was observed within the Gammaridae and the highest family divergence (0.9) was observed within the Melitidae.
Discussion
Inventories of marine biodiversity are much needed in the context of global changes. A decade of DNA barcoding has resulted in the acceleration of species discovery and has helped to
Fig 5. Boxplot distribution of the COI K2P distances for the 10 selected families representative of the Amphipoda order at the intraspecies (S–light blue), intragenus (G–blue) and intrafamily (S–dark blue) levels. Median (central
bar), position of the upper and lower quartiles (central box) and extremes of the data (dots) are represented. Black lines represent different thresholds used for discriminating species: long dash = 0.16 substitution/site [10]; dashed line = 7% of divergence (this study) and solid line = 3% of divergence [53].
provide partial or complete inventories lists for selected taxa [23,58]. The ability to assign spe-cies identities to DNA sequences depends on the availability of comprehensive DNA reference libraries such as BOLD [59]. The generation of these libraries represents an important task, in particular in some difficult acessible region such as the poles or the abyss where our knowledge on their biodiversity is still lacking [23]. With the increasing use of metabarcoding approach, the need for complete library references will become essential to allow an easier investigation of species richness and to monitor the faith of the biodiversity in an area undergoing global changes such as the Arctic ocean [14].
Our study provides a useful example of how one can retrieve information from BOLD data-base to produce an exhaustive first step inventory of specific animal groups or specific regions that are otherwise lost among the different publicly available projects. We showed that wide-spread species are in fact composed of different MOTUs, suggesting the presence of cryptic species. This implies that a careful look at the taxonomic keys is needed for amphipods. More-over, we found that using a single threshold for species delimitation for different families of amphipods is not always accurate.
MOTU delimitation
The number of MOTU retrieved varied between 173 (MOTHUR-16% threshold) and 285 (BOLD). Excluding the highest threshold used in MOTHUR, ABGD retrieved the lowest num-ber of MOTUs. Some discripancy have been noticed among methods. For example, da Silva et al. [60] noticed that ABGD and PTP produce lower estimates of snapper species diversity (based on the COI) than other methods. The relative performance of species delimitation methods has been examined in other studies [61]. The results produced by AGBD vary accord-ing to the metrics used and with the number of individuals per species and might be useless in the exploration of species diversity in poorly known groups [10,61,62]. Several authors emphasize the importance of combining several methods in species delimitation [6]. Defining species based on genetic data alone might be limiting and additional characters such as life his-tory traits and geographic ditribution are also of interest for species description [6,63].
Delimiting species based on a single mitochondrial fragment can introduce some bias. First, the DNA barcoding protocol has different steps that can introduce some errors that can lead to misidentification of the specimen [22]. Second, incomplete lineage sorting or homo-plasy can contribute to an overlap between the intra- and interspecific distances leading to dif-ficulties in the identification of the barcode gap [19]. “COI like” sequences can contribute to increase the threshold estimate as it has been investigated in crustacean [64].
We also conducted our species clustering analyses using a tree-based method. We found around 270 species which is less than the number of MOTUs found with BOLD (285) and less than the number of MOTUs found with ABGD (242). It is well known that tree based methods like GMYC or PTP are sensitive to the genealogy of a particular locus, wich can be discordant with the true species tree [65,66]. Moreover, singletons can also represent difficulties [67,68].
Species threshold
Delimiting species relies on a threshold over which species belong to the same or to two differ-ent species. The 3% of divergence [53] is a commonly used threshold in the literature. Other studies report that a 16% threshold was more suitable for delimiting amphipod species like Gammaridae or Niphargidae [10,69,70,71]. On the contrary, lower value for threshold has been also reported in other family of amphipods like in Talitridae (8% -17%) [71] or in Hyalle-lidae (4%) [72]. By including ten amphipod families, we have showed that the use of 16% is appropriate for the discrimination of Gammaridaea species but is too high to discriminate
species from other families. Based on the interspecific distance distribution among amphipod families, we found that this threshold can discriminate most amphipod species but is not always suitable.
Based on the automatic barcode gap detection, we estimated a threshold of 7% for discrimi-nating amphipod species, which is intermediate between the previous thresholds proposed. This threshold seems appropriate for the majority of amphipod species but again, based on diverse family distances distribution, this threshold will underestimate the number of Gam-maridae or Talitridae species. Instead, we found that for discriminating amphipod species, a threshold specific to each family will be more appropriate. However, we should emphasize that not all amphipod families are equally studied and less than 10 sequences are not enough to estimate intraspecific distances [19,67]. For example, Gammaridae is one of the best studied amphipod family for which a large amount of molecular data is available but other amphipod families such as Hyperiidae have not received the same attention. Here, we focused on 10 amphipod families that represent less than a quarter of all amphipod families [43]. Neverthe-less our analysis provides the first molecular attempt to determine species threshold in amphi-pods. Additional barcoding data is needed on the other amphipod families for helping to refine our species threshold and to determine factors (e.g. benthic vs pelagic lifestyle, life his-tory traits, speciation rates, effective population size, etc. . .) responsible for the large variation in sequence divergence among different crustacean families.
Arctic diversity
Our study, based on the analysis of more than 2300 sequences distributed throughout the three Canadian oceans, indicates the presence of at least 250 provisional amphipod species. We found 100 putative Arctic species representing circa 85% of the known amphipods inven-tory in the Arctic (from the Chukchi Sea) [73]. We recovered more putative species in the Atlantic and less in the Pacific. Marine Arctic fauna is mostly derived from recent and repeated colonisations from both Pacific and Atlantic species after Pleistocene glaciation events or mul-tiple Bering Strait openings [reviewed in17and34]. Most studies on trans-arctic interchanges have reported a Pacific origin of the invasion [34,38,39,74–78]. Regarless of the threshold used, our results indicate a higher similarity between Arctic and Atlantic oceans (>15 MOTUs shared) than between the Arctic and the Pacific (one MOTU shared). Similarity between Arc-tic and North AtlanArc-tic fauna has also been reported in polychaetes [16] or in bryozoans [79], suggesting that the Atlantic Ocean contributed significantly to the recolonization of the Arctic. In addition, the Pacific harbors the highest number of MOTUs compared to the number of sequences available (418), corroborating a higher diversity of this ocean compared to others [16,34]. The limited number of shared MOTUs between the Arctic and Pacific oceans suggests the presence of a barrier restricting exchanges between these oceans. Moreover, the fact that the retrieved Pacific MOTUs were not found elsewhere confirms the isolation of Pacific taxa from colder Arctic waters. In copepods [80,81] and in amphipods [82], isolation between Pacific and Arctic populations has been documented. The cold temperature of the Arctic waters has likely impeded the survival and reproduction of North Pacific species. Global warming induced changes in the Arctic ocean leading to less inhospitable barriers for Pacific species and promoting interchanges between Pacific and Atlantic oceans as suggested by recent models [83]. Therefore, further sampling of the Pacific region is needed to confirm this isolation as our results might be biased by differential sampling efforts between the Pacific and the Atlantic oceans.
We found a relatively higher proportion of benthic species belonging to the intertidal or infralittoral family of Gammaridae, Hyalidae and Ischyroceridae [84,85] than pelagic species.
In the unique pelagic amphipod family (e.g. Hyperiidae), we recovered 12 MOTUs of which the majority (8 MOTUs) were Arctic. In the Eurasian arctic waters inventory, the presence of eight Hyperiidae species were recorded [73]. This result suggests that pelagic diversity is not well known maybe due to sampling difficulties; further efforts are needed to better character-ized ocean diversity. As sampling in the Arctic is quite challenging, it is most likely that rare taxa were not included in our analyses (S3 Fig–S5 Fig). Although, our study does not include depth information, it will also be interesting to investigate the diversity of MOTUs among oceans according to depth to get a more precise picture of the marine biodiversity.
However we were not able to identify all MOTUs to the species level. Several explanations can be considered. First, during the taxonomic reference creation, we discarded more than half of the sequences due to pseudogenes or short sequences. Secondly, the 15 516 sequences of amphipods available in BOLD correspond to 1 514 species which is under the number of amphipods estimates [4]. Despite these constraints, barcoding techniques have provided useful information on the amphipod biodiversity in the three Canadian oceans. This approach can benefit the study of oceanic Arctic region which is one of the least studied [3,23,33]. More-over, we also showed that widespread marine amphipods species are composed of different MOTUs, suggesting an underestimated diversity. A large number of studies have revealed the presence of cryptic species complex in marine invertebrates[16,55,86–88], suggesting the util-ity of combining different types of data (e.g. molecular and morphological) to identify species.
Conclusions
Our analyses have contributed to the assessment of marine arctic amphipod biodiversity in revealing potential cryptic species, in showing the sharing of MOTUs between the Arctic and the Atlantic amphipods and in the isolation of Arctic amphipods from those of the Pacific. Moreover, thanks to the increasing barcode data available in amphipods, we were able to show that threshold value for species identification in amphipods needs to be estimated for each family. It has become evident that species definition should not be restricted to a COI sequence but should include additional information such as ecological niche. Pursuing arctic amphipods studies with DNA barcodes will ultimately lead to a better understanding of marine biodiver-sity and the mechanisms of speciation in marine environments. With arctic waters already showing the presence of temperate invaders [89], there is an urgency to complete this task.
Supporting information
S1 Table. Dataset used in this study.
(XLSX)
S2 Table. Common BIN identified in this study.
(XLSX)
S3 Table. Unique BIN identified in this study.
(XLSX)
S4 Table. List of potential species found with bPTP.
(XLSX)
S1 Fig. The automatic partition results by ABGD with two X-values. In red, X = 0.5. In
green, X = 1. (DOCX)
S2 Fig. PTP species delimitation tree. Red clades represent putative species. bPTP analyses
resulted in an identical topology and putative species. (EPS)
S3 Fig. Rarefaction curve showing the number of MOTUs found in each ocean according the the number of sequence sampled. MOTUs are defined at 3% threshold.
(DOCX)
S4 Fig. Rarefaction curve showing the number of MOTUs found in each ocean according the the number of sequence sampled. MOTUs are defined at 4% threshold.
(DOCX)
S5 Fig. Rarefaction curve showing the number of MOTUs found in each ocean according the the number of sequence sampled. MOTUs are defined at 16% threshold.
(DOCX)
Acknowledgments
We wish to thank the officers and crew of the CCGS Amundsen during sampling efforts in 2011. We are also grateful to the Greenland Institute of Natural Resources in Nuuk, Greenland for providing samples. We thank Dr. A. Comeau for MOTHUR presentation. (SR) was sup-ported by the Canada Excellence Research Chair program. We also thank Dr. K. Dionne, Dr N. Bierne, Dr. C. Nozais and Dr. A. Derry for comments on a previous version of this manu-script. We wish to thank the Canadian Healthy Ocean Network. We are grateful to Que´bec Oce´an and EnviroNord.
Author Contributions
Conceptualization: Astrid Tempestini. Data curation: Astrid Tempestini. Formal analysis: Astrid Tempestini. Funding acquisition: France Dufresne. Methodology: Astrid Tempestini.
Resources: Astrid Tempestini, Søren Rysgaard.
Software: Astrid Tempestini. Supervision: France Dufresne.
Writing – original draft: Astrid Tempestini.
Writing – review & editing: Astrid Tempestini, Søren Rysgaard, France Dufresne.
References
1. Angel MV. Biodiversity of the Pelagic Ocean. Conserv Biol. 1993; 7(4):760–72.
2. Webb CO, Slik JWF, Triono T. Biodiversity inventory and informatics in Southeast Asia. Biodivers Con-serv. 2010; 19(4):955–72.
3. Archambault P, Snelgrove PVR, Fisher JAD, Gagnon J-M, Garbary DJ, Harvey M, et al. From Sea to Sea: Canada’s Three Oceans of Biodiversity. PLoS ONE. 2010; 5(8):e12182.https://doi.org/10.1371/ journal.pone.0012182PMID:20824204
4. Appeltans W, Ahyong Shane T, Anderson G, Angel Martin V, Artois T, Bailly N, et al. The Magnitude of Global Marine Species Diversity. Curr Biol. 2012; 22 (23):2189–202.https://doi.org/10.1016/j.cub. 2012.09.036PMID:23159596
5. Puillandre N, Lambert A, Brouillet S, Achaz G. ABGD, Automatic Barcode Gap Discovery for primary species delimitation. Mol Ecol. 2011; 21(8):1864–1877.https://doi.org/10.1111/j.1365-294X.2011. 05239.xPMID:21883587
6. Carstens BC, Pelletier TA, Reid NM, Satler JD. How to fail at species delimitation. Mol Ecol. 2013; 22 (17):4369–4383.https://doi.org/10.1111/mec.12413PMID:23855767
7. Hebert PDN, Cywinska A, Ball SL, deWaard JR. Biological identifications through DNA barcodes. Proc R Soc B: Biol Sci. 2003; 270(1512):313–21.
8. Vogler AP, Monaghan MT. Recent advances in DNA taxonomy. J Zoolog Syst Evol Res. 2007; 45 (1):1–10.
9. Goldstein PZ, DeSalle R. Integrating DNA barcode data and taxonomic practice: Determination, discov-ery, and description. BioEssays. 2010; 33(2):135–147.
10. Lefe´bure T, Douady CJ, Gouy M, Gibert J. Relationship between morphological taxonomy and molecu-lar divergence within Crustacea: Proposal of a molecumolecu-lar threshold to help species delimitation. Mol Phylogenet Evol. 2006; 40(2):435–447.https://doi.org/10.1016/j.ympev.2006.03.014PMID:16647275 11. Hebert PDN, Stoeckle MY, Zemlak TS, Francis CM. Identification of Birds through DNA Barcodes.
PLoS Biol. 2004; 2(10):e312.https://doi.org/10.1371/journal.pbio.0020312PMID:15455034 12. Pons J, Barraclough TG, Gomez-Zurita J, Cardoso A, Duran DP, Hazell S, Kamoun S, Sumlin WD,
Vogler AP. Sequence-based species delimitation for the DNA taxonomy of undescribed insects. Syst. biol. 2006; 55(4): 595–609. PMID:16967577
13. Zhang J, Kapli P, Pavlidis P, Stamatakis A. A general species delimitation method with applications to phylogenetic placements. Bioinformatics 2013; 29(22): 2869–2876.https://doi.org/10.1093/ bioinformatics/btt499PMID:23990417
14. Raupach MJ, Barco A, Steinke D, Beerman J, Laakman S, Mohrbeck I, Neumann H, Kihara TC, Point-ner K, Radulovici A, Segelken-Voigt A, Wesse C, Knebelsberger T. The application of DNA barcodes for the identification of marine crustaceans from the North Sea and adjacent regions. PloS ONE 2015; 10(9): e0139421.https://doi.org/10.1371/journal.pone.0139421PMID:26417993
15. Young RG, Abbott CL, Therriault TW, Adamowwicz SJ. Barcode-based species delimitation in the marine realm: a test using Hexanauplia (Multicrustacea: Thecostraca and Copepoda). Genome. 2016; 60 (2): 169–182.https://doi.org/10.1139/gen-2015-0209PMID:28094568
16. Carr CM, Hardy SM, Brown TM, Macdonald TA, Hebert PDN. A Tri-Oceanic Perspective: DNA Barcod-ing Reveals Geographic Structure and Cryptic Diversity in Canadian Polychaetes. PLoS ONE. 2011; 6 (7):e22232.https://doi.org/10.1371/journal.pone.0022232PMID:21829451
17. Hardy SM, Carr CM, Hardman M, Steinke D, Corstorphine E, Mah C. Biodiversity and phylogeography of Arctic marine fauna: insights from molecular tools. Mar Biodivers. 2011; 41(1):195–210.
18. Witt JD, Blinn DW, Hebert PDN. The recent evolutionary origin of the phenotypically novel amphipod Hyalella montezuma offers an ecological explanation for morphological stasis in a closely allied species complex. Mol. Ecol. 2003; 12(2): 405–413. PMID:12535091
19. Meier R, Zhang G, Ali F. The Use of Mean Instead of Smallest Interspecific Distances Exaggerates the Size of the “Barcoding Gap” and Leads to Misidentification. Syst Biol. 2008; 57(5):809–813.https://doi. org/10.1080/10635150802406343PMID:18853366
20. Costa FO, DeWaard JR, Boutillier J, Ratnasingham S, Dooh RT, Hajibabaei M, Hebert PDN. Biological identifications through DNA barcodes: the case of the Crustacea. Can J Fish Aquat Sci. 2007; 64(2): 272–295.
21. Knowlton N. Sibling Species in the Sea. Annu Rev Ecol Syst. 1993; 24(1):189–216.
22. Radulovici AE, Archambault P, Dufresne F. DNA Barcodes for Marine Biodiversity: Moving Fast For-ward? Diversity. 2010; 2(4):450–72.
23. Raupach MJ, Radulovici AE. Looking back on a decade of barcoding crustaceans. ZooKeys. 2015; 539:53–81.
24. Matzen da Silva J, Creer S, dos Santos A, Costa AC, Cunha MR, Costa FO, et al. Systematic and Evo-lutionary Insights Derived from mtDNA COI Barcode Diversity in the Decapoda (Crustacea: Malacos-traca). PLoS ONE. 2011; 6(5):e19449.https://doi.org/10.1371/journal.pone.0019449PMID:21589909 25. Costa FO, Henzler CM, Lunt DH, Whiteley NM, Rock J. Probing marine Gammarus (Amphipoda)
taxon-omy with DNA barcodes. Syst Biodivers. 2009; 7(4):365–379.
26. Radulovici AE, Sainte-Marie B, Dufresne F. DNA barcoding of marine crustaceans from the Estuary and Gulf of St Lawrence: a regional-scale approach. Mol Ecol Resour. 2009; 9:181–7.https://doi.org/ 10.1111/j.1755-0998.2009.02643.xPMID:21564977
27. Va¨ino¨la¨ R, Witt JDS, Grabowski M, Bradbury JH, Jazdzewski K, Sket B. Global diversity of amphipods (Amphipoda; Crustacea) in freshwater. Hydrobiologia. 2007; 595(1):241–255.
28. Raupach MJ, Malyutina M, Brandt A, Wa¨gele J-W. Molecular data reveal a highly diverse species flock within the munnopsoid deep-sea isopod Betamorpha fusiformis (Barnard, 1920) (Crustacea: Isopoda: Asellota) in the Southern Ocean. Deep Sea Res Part 2 Top Stud Oceanogr. 2007; 54(16–17):1820– 1830.
29. Darnis G, Robert D, Pomerleau C, Link H, Archambault P, Nelson RJ, et al. Current state and trends in Canadian Arctic marine ecosystems: II. Heterotrophic food web, pelagic-benthic coupling, and biodiver-sity. Clim Chang. 2012; 115(1):179–205.
30. Josefson AB, Mokievsky V, Bergmann M, Blicher ME, Bluhm B, Cochrane S, Denisenko NV, et al. Marine invertebrates. In Arctic Biodiversity Assessment 2013: Conservation of Arctic Flora and Fauna (CAFF); 2013.
31. Wassmann P, Duarte CM, AgustI´ S, Sejr MK. Footprints of climate change in the Arctic marine ecosys-tem. Glob Change Biol. 2010; 17(2):1235–1249.
32. Bluhm B, Gebruk A, Gradinger R, Hopcroft R, Huettmann F, Kosobokova K, et al. Arctic Marine Biodi-versity: An Update of Species Richness and Examples of Biodiversity Change. Oceanography. 2011; 24(3):232–248.
33. Wassmann P, Kosobokova KN, Slagstad D, Drinkwater KF, Hopcroft RR, Moore SE, et al. The contigu-ous domains of Arctic Ocean advection: Trails of life and death. Prog Oceanogr. 2015; 139:42–65. 34. Vermeij GJ. Anatomy of an Invasion: The Trans-Arctic Interchange. Paleobiology. 1991; 17(03):281–
307.
35. Gladenkov AY, Oleinik AE, Marincovich L, Barinov KB. A refined age for the earliest opening of Bering Strait. Palaeogeogr, Palaeoclimatol, Palaeoecol. 2002; 183(3–4):321–328.
36. Heads M. Towards a panbiogeography of the seas. Biol J Linnean Soc. 2005; 84(4): 675–723. 37. Layton KKS, Martel AL, Hebert PDN. Patterns of DNA Barcode Variation in Canadian Marine Molluscs.
PLoS ONE. 2014; 9(4):e95003.https://doi.org/10.1371/journal.pone.0095003PMID:24743320 38. Coyer JA, Hoarau G, Van Schaik J, Luijckx P, Olsen JL. Trans-Pacific and trans-Arctic pathways of the
intertidal macroalga Fucus distichus L. reveal multiple glacial refugia and colonizations from the North Pacific to the North Atlantic. J Biogeogr. 2010; 38(4):756–771.
39. Dodson JJ, Tremblay S, Colombani F, Carscadden JE, Lecomte F. Trans-Arctic dispersals and the evo-lution of a circumpolar marine fish species complex, the capelin (Mallotus villosus). Mol Ecol. 2007; 16 (23):5030–5043.https://doi.org/10.1111/j.1365-294X.2007.03559.xPMID:17944848
40. Pa´lsson S, Ka¨llman T, Paulsen J, A´ rnason E. An assessment of mitochondrial variation in Arctic gadoids. Polar Biol. 2008; 32(3):471–479.
41. Eisner LB, Napp JM, Mier KL, Pinchuk AI, Andrews AG. Climate-mediated changes in zooplankton community structure for the eastern Bering Sea. Deep Sea Res Part II: Top Stud Oceanogr, 2014; 109: 157–171.
42. Vinogradov ME, Causey D, Semenova TN, Volko AF. Hyperiid amphipods (Amphipoda, Hyperiidea) of
the world oceans. Smithsonian Institution, Washington, DC. 1996
43. Martin JW, Davis GE. An updated classification of the recent Crustacea. Sci Series, 2001; 39: 1–124. 44. Folmer O, Hoeh W, Black M, Vrijenhoek R. Conserved primers for PCR amplification of mitochondrial
DNA from different invertebrate phyla. Mol Mar Biol Biotechnol. 1994; 3:294–299. PMID:7881515 45. Dionne K, Vergilino R, Dufresne F, Charles F, Nozais C. No Evidence for Temporal Variation in a
Cryp-tic Species Community of Freshwater Amphipods of the Hyalella azteca Species Complex. Diversity. 2011; 3(4):390–404.
46. Kumar S, Stecher G, Tamura K. MEGA7: molecular evolutionary genetics analysis version 7.0 for big-ger datasets. Mol Biol Evol 2016; 33(7): 1870–1874.https://doi.org/10.1093/molbev/msw054PMID: 27004904
47. Edgar RC. MUSCLE: multiple sequence alignment with high accuracy and high throughput. Nucleic acids res. 2004; 32 (5): 1792–1797.https://doi.org/10.1093/nar/gkh340PMID:15034147
48. Blaxter M, Floyd R. Molecular taxonomics for biodiversity surveys: already a reality. Trends Ecol Evol. 2003; 18(6): 268–269
49. Blaxter M, Mann J, Chapman T, Thomas F, Whitton C, Floyd R, Abebe E. (2005). Defining operational taxonomic units using DNA barcode data. Philos Trans R Soc B: Biol Sci. 2005; 360(1462): 1935–1943 50. Ratnasingham S, Hebert PDN. A DNA-based registry for all animal species: the Barcode Index Number
(BIN) system. PloS ONE. 2013; 8(7): e66213.https://doi.org/10.1371/journal.pone.0066213PMID: 23861743
51. Kimura M. A simple method for estimating evolutionary rates of base substitutions through comparative studies of nucleotide sequences. J Mol Evol. 1980; 16:111–120. PMID:7463489
52. Schloss PD, Westcott SL, Ryabin T, Hall JR, Hartmann M, Hollister EB, et al. Introducing mothur: Open-Source, Platform-Independent, Community-Supported Software for Describing and Comparing Microbial Communities. Appl Environ Microbiol. 2009; 75(23):7537–7541.https://doi.org/10.1128/ AEM.01541-09PMID:19801464
53. Hebert PDN, Ratnasingham S, de Waard JR. Barcoding animal life: cytochrome c oxidase subunit 1 divergences among closely related species. Proc R Soc B: Biol Sci. 2003b; 270(Suppl_1):S96–S9. 54. Katoh K, Standley DM. MAFFT Multiple Sequence Alignment Software Version 7: Improvements in
Per-formance and Usability. Mol Biol Evol. 2013; 30(4):772–780.https://doi.org/10.1093/molbev/mst010 PMID:23329690
55. Havermans C, Sonet G, d’Udekem d’Acoz C, Nagy ZT, Martin P, Brix S, et al. Genetic and Morphologi-cal Divergences in the Cosmopolitan Deep-Sea Amphipod Eurythenes gryllus Reveal a Diverse Abyss and a Bipolar Species. PLoS ONE. 2013; 8(9):e74218.https://doi.org/10.1371/journal.pone.0074218 PMID:24086322
56. Trifinopoulos J, Nguyen LT, von Haeseler A, Minh BQ. W-IQ-TREE: a fast online phylogenetic tool for maximum likelihood analysis. Nucleic acids res. 2016; 44(W1): W232–W235.https://doi.org/10.1093/ nar/gkw256PMID:27084950
57. Ronquist F, Teslenko M, van der Mark P, Ayres DL, Ho¨hna S, Larget B, Liu L, Suchard MA, Huelsen-beck JP. MrBayes 3.2: efficient Bayesian phylogenetic inference and model choice across a large model space. Syst Biol. 2012; 61(3): 539–542.https://doi.org/10.1093/sysbio/sys029PMID:22357727 58. Bucklin A, Steinke D, Blanco-Bercial L. DNA Barcoding of Marine Metazoa.Annu. Rev of Mar. Sci.
2011; 3(1):471–508.
59. Trebitz AS, Hoffman JC, Grant GW, Billehus TM, Pilgrim EM. Potential for DNA-based identification of Great Lakes fauna: match and mismatch between taxa inventories and DNA barcode libraries. Sci Rep. 2015; 5:12162.https://doi.org/10.1038/srep12162PMID:26199185
60. da Silva R, Peloso PLV, Sturari MJ, Veneza I, Sampaio I, Schnaider H, Gomes G. Comparative analy-ses of species delimitation methods with molecular data in snappers (Perciformes: Lutjaninae). Mito-chondrial DNA. A, DNA mapp, seq anal. 2017; 1–7.
61. Kekkonen M, Hebert PDN. DNA barcode-based delineation of putative species: efficient start for taxo-nomic workflows. Mol Ecol Resour. 2014; 14(4):706–715.https://doi.org/10.1111/1755-0998.12233 PMID:24479435
62. Kekkonen M, Mutanen M, Nieminen M, Hebert PND. Delineating species with DNA barcodes: a case of taxon dependent method performance in moths. PloS ONE. 2015; 10(4): e0122481.https://doi.org/10. 1371/journal.pone.0122481PMID:25849083
63. Hickerson M, Meyer C, Moritz C. DNA Barcoding Will Often Fail to Discover New Animal Species over Broad Parameter Space. Syst Biol. 2006; 55(5):729–739.https://doi.org/10.1080/
10635150600969898PMID:17060195
64. Buhay JE. “COI-like” sequences are becoming problematic in molecular systematic and DNA barcoding studies. J Crustacean Biol. 2009; 29(1): 96–110.
65. Maddison WP. Gene trees in species trees. Syst Biol. 1997; 46(3): 523–536.
66. Reid NM. Carstens BC. Phylogenetic estimation error can decrease the accuracy of species delimita-tion: a Bayesian implementation of the general mixed Yule-coalescent model. BMC Evol. Biol. 2012; 12 (1): 196.
67. Zhang AB, He LJ, Crozier RH, Muster C, Zhu CD. Estimating sample sizes for DNA barcoding. Mol Phy-logenet Evol. 2010; 54(3):1035–1039.https://doi.org/10.1016/j.ympev.2009.09.014PMID:19761856 68. Lim GS, Balke M, Meier R. Determining species boundaries in a world full of rarity: singletons, species
delimitation methods. Syst. biol. 2010; 61(1): 165–169.
69. Flot JF, Wo¨rheide G, Dattagupta S. Unsuspected diversity of Niphargus amphipods in the chemoauto-trophic cave ecosystem of Frasassi, central Italy. BMC Evol Biol. 2010; 10(1): 171.
70. Fisˇer Zˇ , Altermatt F, Zaksˇek V, KnapičT, Fisˇer C. Morphologically cryptic amphipod species are “eco-logical clones” at regional but not at local scale: a case study of four Niphargus species. PloS ONE. 2015; 10(7): e0134384.https://doi.org/10.1371/journal.pone.0134384PMID:26226375
71. King RA, Leys R. The Australian freshwater amphipods Austrochiltonia australis and Austrochiltonia
subtenuis (Amphipoda: Talitroidea: Chiltoniidae) confirmed and two new cryptic Tasmanian species
revealed using a combined molecular and morphological approach. Invertebr Syst. 2011; 25(3): 171– 196.
72. Witt JD, Threloff DL, Hebert PDN. (2008). Genetic zoogeography of the Hyalella azteca species com-plex in the Great Basin: rapid rates of molecular diversification in desert springs. Geol Soc Spec Pap, 2008; 439: 103.
73. Sirenko BI. List of species of free-living invertebrates of Eurasian Arctic seas and adjacent deep waters: Russian Academy of Science, Zoological Institute; 2001.
74. Cunningham CW, Collins TM. Beyond area relationships: extinction and recolonization in molecular marine biogeography. Molecular approaches to ecology and evolution: Springer; 1998. p. 297–321. 75. Hewitt G. The genetic legacy of the Quaternary ice ages. Nature. 2000; 405(6789):907–913.https://
doi.org/10.1038/35016000PMID:10879524
76. Va¨ino¨la¨ R. Repeated trans-Arctic invasions in littoral bivalves: molecular zoogeography of the Macoma balthica complex. Mar Biol. 2003; 143(5):935–946.
77. Nikula R, Strelkov P, Va¨ino¨la¨ R. Diversity and trans-arctic invasion history of mitochondrial lineages in the North Atlantic Macoma balthica complex (Bivalvia: Tellinidae). Evolution. 2007; 61(4):928–941. https://doi.org/10.1111/j.1558-5646.2007.00066.xPMID:17439622
78. Rawson PD, Harper FM. Colonization of the northwest Atlantic by the blue mussel, Mytilus trossulus postdates the last glacial maximum. Mar Biol. 2009; 156(9):1857–1868.
79. Kuklinski P, Taylor PD, Denisenko NV, Berning B. Atlantic Origin of the Arctic Biota? Evidence from Phylogenetic and Biogeographical Analysis of the Cheilostome Bryozoan Genus Pseudoflustra. PLoS ONE. 2013; 8(3):e59152.https://doi.org/10.1371/journal.pone.0059152PMID:23536863
80. Nelson RJ, Carmack EC, McLaughlin FA, Cooper GA. Penetration of Pacific zooplankton into the west-ern Arctic Ocean tracked with molecular population genetics. Mar Ecol Prog Ser. 2009; 381:129–138. 81. Questel JM, Blanco-Bercial L, Hopcroft RR, Bucklin A. Phylogeography and connectivity of the
Pseudo-calanus (Copepoda: Calanoida) species complex in the eastern North Pacific and the Pacific Arctic
Region. J Plankton Res. 2016; 38(3):610–623.https://doi.org/10.1093/plankt/fbw025PMID:27274099 82. Tempestini A, Fortier L, Pinchuk AI, Dufresne F. Molecular phyolgeny of the genus Themisto (Gue´rin,
1925) (Amphipoda: Hyperiidae) in the Northern Hemisphere. J Crustacean Biol. 2017: 1–11.
83. Wisz MS, Broennimann O, Grønkjær P, Møller PR, Olsen SM, Swingedouw D, et al. Arctic warming will promote Atlantic–Pacific fish interchange. Nat Clim Change. 2015; 5(3):261–265.
84. McLaughlin PA, Camp DK, Angel MV, Bousfield E, Brunel P, Brusca R, et al. Common and scientific names of aquatic invertebrates from the United States and Canada: crustaceans: American Fisheries Society; 2005.
85. Serejo CS, Sittrop DJ. Hyalidae. Zootaxa. 2009; 2260:440–452.
86. Goetze E. Global population genetic structure and biogeography of the oceanic copepods Eucalanus
hyalinus and E. spinifer. Evolution. 2005; 59(11):2378–2398. PMID:16396179
87. Goetze E. Species discovery in marine planktonic invertebrates through global molecular screening. Mol Ecol. 2010; 19(5):952–967.https://doi.org/10.1111/j.1365-294X.2009.04520.xPMID:20089123 88. Lo¨rz A-N, Linse K, Smith PJ, Steinke D. First Molecular Evidence for Underestimated Biodiversity of
Rhachotropis (Crustacea, Amphipoda), with Description of a New Species. PLoS ONE. 2012; 7(3):
e32365.https://doi.org/10.1371/journal.pone.0032365PMID:22396761
89. Kraft A, Bauerfeind E, No¨thig E-M, Klages M, Beszczynska-Mo¨ller A, Bathmann UV. Amphipods in sedi-ment traps of the eastern Fram Strait with focus on the life-history of the lysianassoid Cyclocaris