Science Arts & Métiers (SAM)
is an open access repository that collects the work of Arts et Métiers Institute of Technology researchers and makes it freely available over the web where possible.
This is an author-deposited version published in: https://sam.ensam.eu
Handle ID: .http://hdl.handle.net/10985/11179
To cite this version :
Sebastian ECKEL, Fodil MERAGHNI, Pascal POMAREDE, Nico Felicien DECLERCQ -Nondestructive testing of composites using a nonlinear acoustic spectroscopy method - 2016
Any correspondence concerning this service should be sent to the repository
NONDESTRUCTIVE TESTING OF COMPOSITES USING A
NONLINEAR ACOUSTIC SPECTROSCOPY METHOD
Sebastian Eckel1, Fodil Meraghni2, Pascal Pomarede3 and Nico Felicien Declercq4
1Arts et Métiers ParisTech – LEM3-UMR 7239 CNRS and Karlsruhe Institute of Technology,
4 Rue Augustin Fresnel, 57078 Metz, France Email: [email protected]
2Arts et Métiers ParisTech – LEM3-UMR 7239 CNRS, 4 Rue Augustin Fresnel, 57078 Metz, France
Email: [email protected]
3Arts et Métiers ParisTech – LEM3-UMR 7239 CNRS, 4 Rue Augustin Fresnel, 57078 Metz, France
Email: [email protected]
4G.W. Woodruff School of Mechanical Engineering,CNRS UMI2958,Georgia Tech Lorraine,
Georgia Institute of Technology, 2 rue Marconi, 57070 Metz, France Email: [email protected], Web Page: http://declercq.gatech.edu
Keywords: Nondestructive testing, Laminates, Polymer-matrix composites, Nonlinear acoustics
Abstract
The presented experimental work describes the nondestructive examination of polymer based composites using an acoustic method under the consideration of nonlinear effects. The technique is based on the fact that material behaves more nonlinearly in the presence of damage than in the undamaged state during dynamic load. Damaged structures show an increased nonlinear transmission behavior. Consequently, the level of nonlinearity is an indication of the damage severity. The aim is to analyze the nonlinear transfer behavior and if a quantification can be used to determine the damage severity. The focus is on the type of nonlinear acoustic spectroscopy methods that analyses the modulation spectrum. When two harmonic waves are applied with different frequencies to a damaged material, the amplitude of the high-frequency wave will be modulated by the low-frequency wave and the created spectrum manifests an intermodulation by showing new frequencies such as sidebands and higher harmonics. Samples made of glass fiber reinforced vinyl ester respectively epoxy, both taffeta woven, and pre-damaged by application of tensile tests using different levels of tension have been considered. A new experimental setup has been developed and a clearly visible increase of the intermodulation with increasing damage has been noticed for both materials. Finally, the method is proven to nondestructively evaluate the damage state of composites.
1. Introduction
This paper focuses on the nondestructive evaluation of laminated, polymer matrix composites reinforced by woven glass fibers. These materials show complex damage mechanisms like delamination, fiber rupture, debonding, etc. affecting the mechanical response. To detect and quantify such damage in a structure, adequate testing techniques are needed. In quality control and inspection, particularly nondestructive testing techniques are required. The range of nondestructive testing techniques is wide and includes for example radiographic, infrared and electromagnetic characterization. Also, mechanical testing methods like ultrasonic and acoustic methods are known as appropriate and suitable characterization techniques of damage in composites. This paper’s focus is on the latter testing techniques, and particularly on the application of nonlinear acoustic methods which
stand in contrast to linear methods like for example the classical C-scan or the Polar-scan presented in reference [1].
Actually, apart from the linear testing methods of materials, such as for instance the well-established A-, B- and C-scan, there is another possibility to evaluate the damage using nonlinear spectroscopy techniques. These methods base on the fact that a material behaves much more nonlinear dynamic in the presence of damage than in the undamaged state [2] during dynamic loading. The damaged material exhibits an increased nonlinear transmission behavior [3]. This phenomenon can be explained by the formation of new inner contact surfaces with increasing damage [4]. Qualitatively, it is possible to state that the nonlinear response of the composite increases with increasing damage [2]. Consequently, the level of the dynamic nonlinearity indicates the damage severity. The measurement and analysis of these nonlinear effects is established by so called Nonlinear Elastic Wave Spectroscopy (NEWS) methods [2]. Their advantage is to be much more sensitive to measure damage than classical linear methods [5] basing on bulk wave velocity measurements and they are more appropriate to inhomogeneous materials like composites where in particular the crack size is comparable to the wavelength of the ultrasonic waves [6].
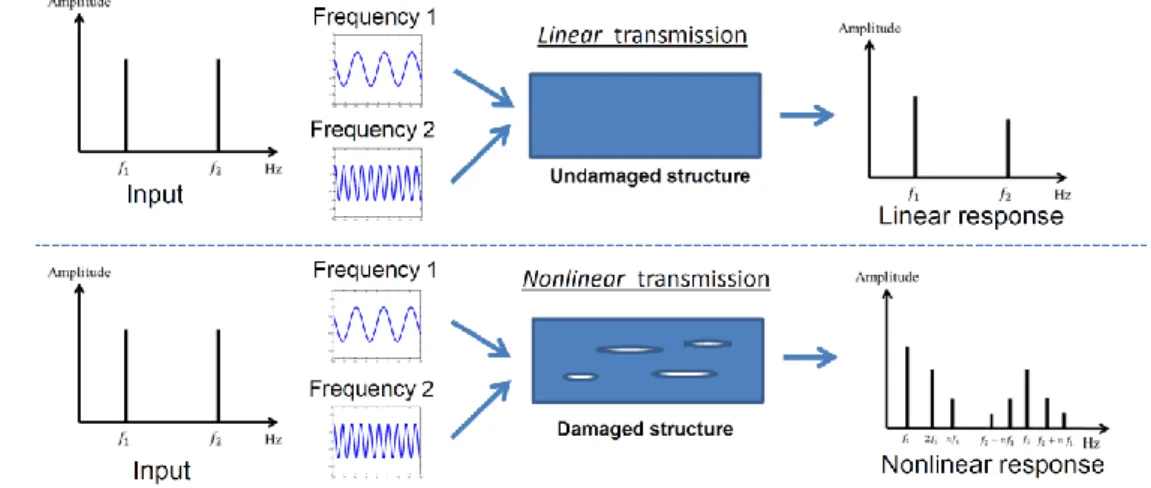
Two general types of NEWS methods are presented in the literature [2, 5, 6]: Resonance based methods and methods that are non-resonance based. The present paper deals with the latter type of nonlinear ultrasonic spectroscopy methods that analyze the modulation spectrum. When two harmonic
waves are applied with different frequencies f1 and f2 (f1 < f2) in a damaged material, the amplitude of
the high-frequency wave will be modulated by the low-frequency wave because of a nonlinear transmission behavior. Consequently, the created spectrum manifests a nonlinear intermodulation
response by creating new frequencies such as sidebands (f2 nf1; n = 2, 3, …) and higher harmonics
(nf1; n = 1, 2, 3, …): The damage operates like a multiplier and nonlinear mixer of the excitation
frequencies. Fig. 1 illustrates schematically this phenomenon [6].
This article is presented in different sections: The following section is dedicated to the description of the investigated composite materials, the experimental setup and the signal treatment. Next, the results are exposed and discussed. Finally, the paper ends with a conclusion.
Figure 1. Linear and nonlinear modulation. Excitation frequencies and response of an undamaged
sample with linear transmission behavior (Top) as well excitation frequencies and response of a damaged sample with nonlinear transmission behavior (Bottom).
2. Materials description and experimental procedure
In this section the two studied composite materials and the experimental procedure are presented and described.
2.1. Materials and samples
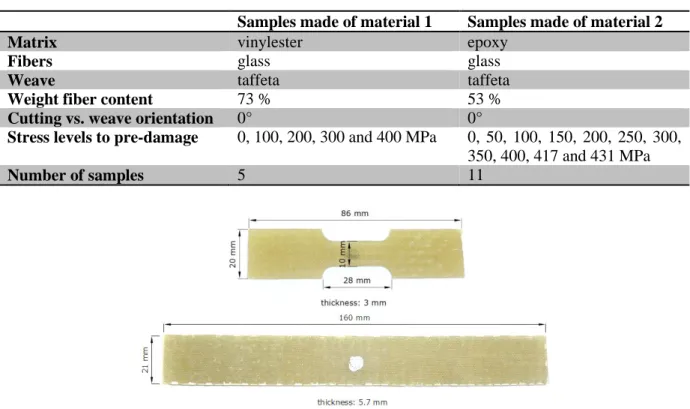
The characteristics of the investigated materials and samples are summarized in Table 1. Each set of samples, made either of material 1 or material 2, has been prepared by application of tensile tests that are interrupted at predefined stress levels, findable also in Table 1. This allows introducing a progressive damage in the samples. Additionally, a reference sample of each set is left in the initial undamaged state. The sample’s geometry of each set is detailed in Fig. 2.
Table 1. Materials’ and samples’ characterisitcs.
Samples made of material 1 Samples made of material 2 Matrix vinylester epoxy
Fibers glass glass
Weave taffeta taffeta
Weight fiber content 73 % 53 %
Cutting vs. weave orientation 0° 0°
Stress levels to pre-damage 0, 100, 200, 300 and 400 MPa 0, 50, 100, 150, 200, 250, 300, 350, 400, 417 and 431 MPa
Number of samples 5 11
Figure 2. Top: Geometry of samples made of material 1 (vinylester matrix); Bottom: Geometry of
samples made of material 2 (epoxy matrix).
2.2. Experimental setup
Here the experimental setup, the instruments and their settings are described.
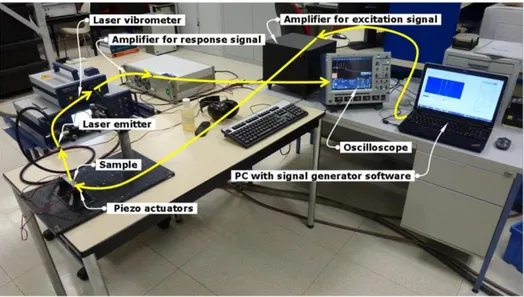
The generation of the two excitation signals is provided by the sound card of a common PC using a software based signal generator. The frequencies are randomly chosen, but it has been respected that the difference between the two frequencies is smaller than the lower frequency [7]. The so generated signals are transmitted to the sound signal amplifier over the common speaker output of the PC. The generated sound-signals are then amplified and transformed into mechanical vibrations using the piezo elements of two piezoelectric loudspeakers. These are opened to place the two sample’s extremities in direct contact with the piezo elements (see Fig. 4). To improve the tactile contact, an coupling gel is used. The sample’s dynamic response, represented by their vibrations, is afterwards recorded by the sensor of a laser vibrometer. A second amplifier is connected to the vibrometer’s output. This amplifier sends the vibration signal to an oscilloscope, which treats the signal using the Fast Fourier
Transform (FFT) to get its frequency spectrum. The experimental setup is presented in Fig. 5 including the different instruments.
Figure 4. Two opened loudspeakers using the piezoelectric actuators to excite a sample in place.
Figure 5. Experimental setup: Instruments are labeled and the signal paths are illustrated by yellow
arrows.
3. Signal treatment
The given frequency spectrum of the samples’ vibration response is evaluated by an routine written in
MATLAB. The aim is to compute the “Total Difference Frequency Distortion” (TDFD) according to
reference [8]. It offers the possibility to quantify the nonlinearity by measuring the intensity of the intermodulation:
𝑇𝐷𝐹𝐷 = √∑ 𝐴𝑖,𝑖𝑛𝑡𝑒𝑟𝑚𝑜𝑑𝑢𝑙𝑎𝑡𝑖𝑜𝑛
2 𝑖
𝐴𝑒𝑥𝑐𝑖𝑡𝑎𝑡𝑖𝑜𝑛 1+𝐴𝑒𝑥𝑐𝑖𝑡𝑎𝑡𝑖𝑜𝑛 2 (1)
𝐴𝑖,𝑖𝑛𝑡𝑒𝑟𝑚𝑜𝑑𝑢𝑙𝑎𝑡𝑖𝑜𝑛 are the amplitudes of the intermodulation products and 𝐴𝑒𝑥𝑐𝑖𝑡𝑎𝑡𝑖𝑜𝑛 1 respectively
𝐴𝑒𝑥𝑐𝑖𝑡𝑎𝑡𝑖𝑜𝑛 2 are the amplitudes of the two peaks placed at the excitation frequencies in the response’s
spectrum.
It can be stated that this distortion measure is well-established in the field of sound system equipment to evaluate the unwanted distortion behavior of audio amplifiers. That is why it is suitable to introduce this parameter in the field of nondestructive testing by nonlinear acoustics as distortion effects of amplifiers are comparable to the dynamic nonlinear behavior of damaged composites.
4. Experimental results and discussion
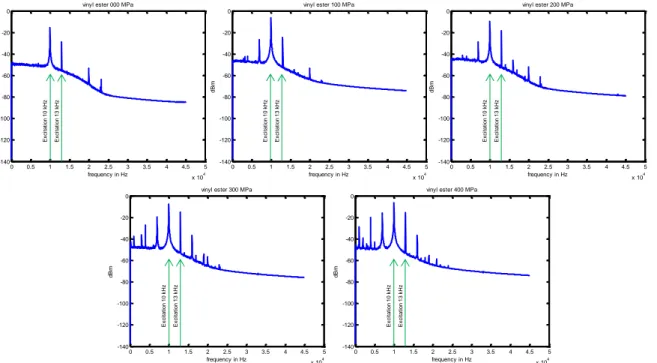
As described, increasing damage should lead to an evolution of the intermodulation products when the presented nonlinear acoustic method is applied. Exemplarily, the resultant spectra of the tests executed on the woven glass vinylester composite samples are presented in Fig. 8. Without any doubt, it can be observed that the number of peaks in the response spectrum increases with increasing damage. In the case of the undamaged sample, there are only two peaks remarkable beside the peaks resulting from the excitation indicating a nearly linear transmission behavior. The nonlinearity increases with an increase of tensile stress. This is visible by the appearance of peaks in sidebands and higher harmonics.
Figure 8. Evolution of the intermodulation with increasing damage in vinylester matrix samples
excited with frequencies of 10 kHz and 13 kHz. The damage state is indicated by the corresponding applied tensile stress.
4.1. Results for woven glass vinylester composite
Randomly chosen excitation frequencies of 10 kHz and 13 kHz have been used to apply the method to the woven glass vinylester composite samples.
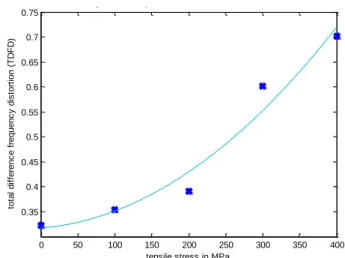
The result presented as the dependence between damage and intermodulation (as consequence of nonlinear transmission behavior) is shown in Fig. 9. The Total Difference Frequency Distortion (TDFD) traces over the tensile stress reached to pre-damage the correspondent sample for five different cases. A quadratic regression of these measuring points is also reported and plotted to support the interpretation. An increase of the intermodulation with increasing damage is clearly visible, from
TDFD = 0.3176 in the case of the virgin sample to TDFD = 0.7014 in the case of the maximal
damaged sample. 0 0.5 1 1.5 2 2.5 3 3.5 4 4.5 5 x 10⁴ -140 -120 -100 -80 -60 -40 -20 0 frequency in Hz d B m
vinyl ester 000 MPa
0 0.5 1 1.5 2 2.5 3 3.5 4 4.5 5 x 10⁴ -140 -120 -100 -80 -60 -40 -20 0 frequency in Hz vinyl ester 100 MPa
d B m 0 0.5 1 1.5 2 2.5 3 3.5 4 4.5 5 x 10⁴ -140 -120 -100 -80 -60 -40 -20 0 frequency in Hz vinyl ester 200 MPa
d B m 0 0.5 1 1.5 2 2.5 3 3.5 4 4.5 5 x 10⁴ -140 -120 -100 -80 -60 -40 -20 0 frequency in Hz d B m
vinyl ester 300 MPa
0 0.5 1 1.5 2 2.5 3 3.5 4 4.5 5 x 10⁴ -140 -120 -100 -80 -60 -40 -20 0 frequency in Hz vinyl ester 400 MPa
d B m Ex ci ta ti o n 1 0 kH z Ex ci ta ti o n 1 3 kH z Ex ci ta ti o n 1 0 kH z Ex ci ta ti o n 1 3 kH z Ex ci ta ti o n 1 0 kH z Ex ci ta ti o n 1 3 kH z Ex ci ta ti o n 1 0 kH z Ex ci ta ti o n 1 3 kH z Ex ci ta ti o n 1 0 kH z Ex ci ta ti o n 1 3 kH z
Fig. 9 Measuring points and quadratic regression of the nonlinear transmission behavior of the woven
glass vinylester composite samples under excitation of 10 kHz and 13 kHz.
4.2. Results for woven glass epoxy composite
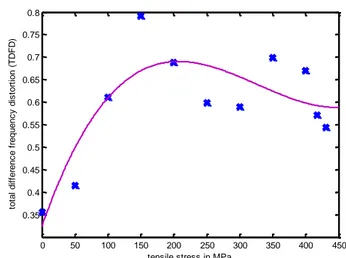
The method is equally applied to the woven glass composite samples with an epoxy matrix using the randomly chosen excitation frequencies of 11 kHz and 14 kHz. The resultant chart is presented in Fig. 10 including a cubic regression to support the estimation of the general behavior. The chart traces the Total Difference Frequency Distortion (TDFD) over the tensile stress used to introduce a well-defined pre-damage in the corresponding sample for 11 different cases. With increasing damage, an increase of the parameter up to 150 MPa of tensile stress (from TDFD = 0.3557 to TDFD = 0.7910) is remarkable followed by an oscillation and even a slight decrease of the parameter with increasing damage is visible when the general behavior in this range of damage is considered. The measure of the maximal damaged sample is TDFD = 0.5444.
The described oscillation and reduction could possibly be explained by large cracks and open delaminations in the composite material. In fact, delaminations that are completely open are sources of nonlinearities particularly in their boundary zones; only in this boundary region is a contact surface that introduces nonlinear effects [9]. The parameter’s oscillation is consequently justified as follows: At lower stress, small defects are created that increase the nonlinearity because of the creation of new contact areas. However, when the cracks and delaminations open and coalesce during a state of higher stress, the level of nonlinearity decreases partially. The zone of contact has been reduced. Then followed by still higher stress, new small cracks are created that start again to increase the nonlinearity up to a level till they open too. This effect is mentioned in [9] and [10] where another distortion factor has been recorded during a high cycle fatigue test of carbon fiber reinforced plastic.
0 50 100 150 200 250 300 350 400 0.35 0.4 0.45 0.5 0.55 0.6 0.65 0.7 0.75
measure of the nonlinear transmission behavior of the vinyl ester-samples under excitation of 10kHz and 13 kHz
tensile stress in MPa
to ta l d if fe re n c e f re q u e n c y d is to rt io n ( TD FD ) data1 quadratic
Fig. 10 Measure of the nonlinear transmission behavior of the woven glass epoxy composite samples
under excitation of 11 kHz and 14 kHz including the plot of a cubic regression.
5. Concluding remarks
The presented work is based on the literature of nondestructive examination of composites under the use of nonlinear acoustic methods. The nonlinear transmission behavior of two different composite materials in dependence of damage evolution was examined to verify and advance these methods. A new experimental setup has been constructed and an intermodulation measure has been introduced. It has been presented that a dependency exists between the nonlinear transmission behavior of samples and the damage state introduced by prior and interrupted tensile tests performed at defined stress levels. Therefore, the method is appropriate to nondestructively evaluate the damage state of composite samples, at least for the geometries and materials used in this work. The work exhibits a strict increase of the nonlinearity with an increase of the damage for the composite samples made of woven glass vinylester. This stands in contrast to the case of the woven glass epoxy composite material having observed an oscillation. This oscillation has to be deeply re-investigated by further research to assess the given explanation of a varying amount of contact surface in relation to the damage state level. Finally, it has been stated that the Nonlinear Wave Modulation Spectroscopy and the introduced TDFD provide an effective damage examination.
Further informations, explanations and results achieved by this research can be found in [11].
Acknowledgments
The research was established in the frame of the OpenLab “Materials and Processes” supported by PSA Peugeot Citroën.
References
[1] Declercq NF, Decrieck J, Leroy O (2006) Ultrasonic polar scans Numerical simulation on generally. Ultrasonics 45:32–39.
[2] Van Den Abeele KE -a., Johnson P a., Sutin a. (2000) Nonlinear Elastic Wave Spectroscopy (NEWS) Techniques to Discern Material Damage, Part I: Nonlinear Wave Modulation Spectroscopy (NWMS). Res Nondestruct Eval 12:17–30. doi: 10.1080/09349840009409646 [3] Solodov (2014) Resonant Acoustic Nonlinearity of Defects for Highly-Efficient Nonlinear NDE.
J Nondestruct Eval 33:252–262.
[4] Jiao J-P, Liu W-H, He C-F, et al. (2014) Nonlinear Acoustic Interaction of Contact Interfaces. Exp Mech 54:63–68. doi: 10.1007/s11340-012-9710-5
0 50 100 150 200 250 300 350 400 450 0.35 0.4 0.45 0.5 0.55 0.6 0.65 0.7 0.75 0.8
Measure of the nonlinear transmission behavior of the epoxy-samples under excitation of 11 kHz and 14 kHz and plotted cubic regression
to ta l d if fe re n c e f re q u e n c y d is to rt io n ( TD FD )
tensile stress in MPa
data1 cubic
[5] Van Den Abeele KE -a., Johnson P a., Sutin A (2000) Nonlinear Elastic Wave Spectroscopy (NEWS) Techniques to Discern Material Damage, Part II: Single-Mode Nonlinear Resonance Spectroscopy (NWMS). Res Nondestruct Eval 12:17–30. doi: 10.1080/09349840009409646 [6] Meo M, Polimeno U, Zumpano G (2008) Detecting damage in composite material using
nonlinear elastic wave spectroscopy methods. Appl Compos Mater 15:115–126. doi: 10.1007/s10443-008-9061-7
[7] DIN IEC 268-2:1994-08. Elektroakustische Geräte – Tl. 2 Allg. Begr. und Berechnungsverfahren (lEC 268-2 1987 + A1 1991) Dtsch. Fassung HD 483.2 S2 1993
[8] DIN EN 60268-3:2014-03. Elektroakustische Geräte – Tl. 3 Verstärker (IEC 60268-32013), Dtsch. Fassung EN 60268-32013
[9] Helfen TB (2014) Nichtlinearer Ultraschall zur Charakterisierung von Ermüdungsschäden während der Hochfrequenz - Beanspruchung von C - Faser - Kunststoffverbunden. Universitat des Saarlandes
[10] Rabe U, Helfen T, Weikert M, et al. (2012) Nonlinear ultrasonic testing of carbon fibre reinforced plastics in the very high cycle fatigue regime. Proc Meet Acoust 16:1–6. doi: 10.1121/1.4748345 [11] Eckel S, Meraghni F, Pomarede P, Declercq NF (2016) Investigation of damage in woven glass
fiber reinforced composites using nondestructive nonlinear acoustic spectroscopy. Experimental Mechanics, status: under review.