HAL Id: hal-01097476
https://hal.inria.fr/hal-01097476
Submitted on 14 Nov 2016
HAL is a multi-disciplinary open access
archive for the deposit and dissemination of
sci-entific research documents, whether they are
pub-lished or not. The documents may come from
teaching and research institutions in France or
abroad, or from public or private research centers.
L’archive ouverte pluridisciplinaire HAL, est
destinée au dépôt et à la diffusion de documents
scientifiques de niveau recherche, publiés ou non,
émanant des établissements d’enseignement et de
recherche français ou étrangers, des laboratoires
publics ou privés.
Distributed under a Creative Commons Attribution| 4.0 International License
Characterizing Bufferbloat and its Impact at End-hosts
Stephane Wustner, Renata Teixeira, Jaideep Chandrashekar
To cite this version:
Stephane Wustner, Renata Teixeira, Jaideep Chandrashekar. Characterizing Bufferbloat and its
Im-pact at End-hosts. 6th International Workshop on Traffic Monitoring and Analysis (TMA), Apr 2014,
London, United Kingdom. pp.51-64, �10.1007/978-3-642-54999-1_5�. �hal-01097476�
Characterizing Bufferbloat and its Impact at
End-hosts
St´ephane Wustner12, Renata Teixeira3 and Jaideep Chandrashekar2
1
UPMC Sorbonne Universities, Paris, France
2
Technicolor, Paris, France
3 Inria, France
Abstract. While buffers on forwarding devices are required to handle bursty Internet traffic, overly large or badly sized buffers can interact with TCP in undesirable ways. This phenomenon is well understood and is often called “bufferbloat”. Although a number of previous studies have shown that buffering (particularly, in home) can delay packets by as much as a few seconds in the worst case, there is less empirical evidence of tangible impacts on end-users. In this paper, we develop a modified algorithm that can detect bufferbloat at individual end-hosts based on passive observations of traffic. We then apply this algorithm on packet traces collected at 55 end-hosts, and across different network environ-ments. Our results show that 45 out of the 55 users we study experience bufferbloat at least once, 40% of these users experience bufferbloat more than once per hour. In 90% of cases, buffering more than doubles RTTs, but RTTs during bufferbloat are rarely over one second. We also show that web and interactive applications, which are particularly sensitive to delay, are the applications most often affected by bufferbloat.
1
Introduction
Internet routers and other forwarding devices (e.g., home gateways, middble-boxes) are engineered with buffers that can help deal with sudden bursts in traffic. When properly sized, these buffers can avoid packet losses which could lead to network instability. However, on the other hand, large buffers can inter-act with TCP’s feedback control mechanism in unexpected ways. Such buffers have the effect of delaying TCP feedback, making the end-points wait longer to understand the fate of packets that are in flight. Recent papers report that exces-sive buffering at the edge (mostly in home routers and access points) can cause additional delay on the order of seconds [1], as a direct result of what is termed BufferBloat [2, 3]. When buffering is excessive, and the delays large, applications seem “laggier” and end-users perceive the network as being slower and less re-sponsive. Such effects are most felt with short interactive (or semi-interactive) applications such as web-browsing, VoIP, and online gaming.
Most previous work in this area has focused on two distinct aspects: (i) measuring the extent of excessive buffering in the network, or (ii) designing mechanisms to mitigate it. Corresponding to the first category, previous work
quantifies worst case buffering carrying out delay measurements after attempting to saturate network buffer [1] [4] [5], or leveraging bittorent traffic [6]. This body of work conclusively establishes that bufferbloat can occur on the Internet for a particular set of conditions. However, they do not address the question of whether this directly affects the normal user (and their traffic) and to what extent. The one exception to this is the work by Allman [7], which analyzed real user traffic seen deep in the network and reported that bufferbloat rarely delays packets by more than a second (which contrasts some of the previous work). A possible explanation is that the dataset consists primarily of fiber users with 1GB bi-directional links, and the lack of buffering is simply due to the very high access link speeds.
In this paper, we examine a different vantage point to characterize the size and impact of excessive buffering, and this is on the end-host itself. By placing ourselves on the end-host, we are better able to measure and understand the act ual performance of an application as experienced by the end-user. It is extremely challenging to close the loop and actually state whether a bad performance episode indeed has an impact on the user – such observations are very subjec-tive and depend on application, mood, expectations, etc. In our work, we simply measure how some application characteristics are degraded by excessive buffer-ing, which serves as a proxy for the actual experience of the end-user. Another advantage of being able to characterize this at the end-host is that mechanisms might be easier to deploy at the end-hosts and the mitigation mechanisms, such as those discussed in [8, 9] could be customized for particular applications. A key challenge that needs to be addressed is a methodology to detect excessive buffering, which intimately depends on a large set of parameters – access link speeds, buffer sizes, traffic rates, etc. This has been narrowly addressed in pre-vious work [3], which was squarely focused on the network core. However, these methods are not directly applicable at the end-host.
A key contribution of this paper is a modified algorithm that can detect extended periods of buffering passively and on end-hosts.
Subsequently, we apply this new detection methodology on a corpus of data (described in §2) collected from 55 hosts, covering 2300 cumulative days of traffic. The users and environments in our dataset cover a wide variety of network settings – ranging from enterprise LAN networks to home DSL networks. Our characterization (§4) complements Allman’s study [7], which only examined very well connected end-hosts. In particular, we focus onto individual bufferbloat episodes and quantify the actual impact on applications that are affected by the buffering in the particular episode.
2
Dataset
We study bufferbloat using data passively collected directly on users’ machines with the Hostview [10] monitoring tool. HostView was developed to study user perception of network performance. It collects network and system performance as well as user feedback on the quality of network experience. In this paper, we
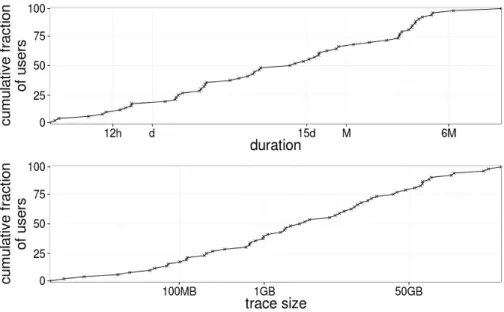
Fig. 1. Distribution of the duration covered by capture across users
only study the network performance of active application connections. HostView extracts network performance from packet-header traces collected with libpcap. It labels traces with information about the network environment : (i) the hash of the MAC address of the default gateway, (ii) the interface name, (iii) the type of the interface. HostView uploads traces from the user machine to a server every four hours. We merge all consecutive traces collected in a single environment collected less than one hour apart into a session. We then process packets in each session with tcptrace [11] to obtain round-trip time (RTT) estimates over each TCP connection in the session. Note that because the data is collected at the end-host we can only estimate RTTs for upload traffic and at the beginning and end of every connection (since the RTT estimations relies on ACKs). This is not a problem for our study because bufferbloat has mainly been observed in upload traffic [1] [4] [5]. HostView also maps connections to the application executable name that originated them using GT [12]. This allows us to identify the application running within particular intervals.
Users, mostly computer scientists, ran HostView between November 2010 and April 2012. We study data from 55 users who contributed at least four hours of cumulative trace over ethernet. We only study traces collected when users are connected over Ethernet to avoid any interaction with other buffering effects happening in wireless. The traces we study were collected on 87 unique network environments in 14 different countries. The sizes of traces and the duration varied per user as we can see in Figure 1. We study traces that lasted between 4 hours and 15 months, depending on the user. For 80% of users the traces lasted for at
least one day. Trace sizes also vary considerably across users; the median trace is 2.6GB.
3
Bufferbloat detection
Given RTT samples computed from packet traces collected on the end-host, we must detect periods when packets are experiencing bufferbloat. We develop a methodology that works in two steps. First, we identify instances of sustained buffering, which we call buffering episodes, using a heuristic inspired by coDel [3]. Then, we apply this heuristic to the HostView data to identify episodes of ex-cessive buffering and quantify their magnitude. From these, we select the largest episodes and analyze them in detail. This section first presents a brief overview of the heuristic coDel uses to detect buffering, then it presents how we extend this heuristic to work only with the data that we have available at end-hosts. Finally, we present our analysis of buffering on HostView data and the definition of bufferbloat we will consider for the rest of the paper.
3.1 CoDel heuristic
CoDel is an active queue management algorithm designed for gateways. The al-gorithm detects when queue is building up so that it can start dropping packets early, to avoid bufferbloat. As a basis to our detector we choose the same, well-tested, heuristics as in coDel. CoDel measures the sojourn time at the buffer. It declares a buffering episode when the sojourn time is above a target for at least an interval (in the original work, these are set as 5ms and 100ms, respec-tively [3]). These two heuristics are complementary: a sojourn time greater than a certain target would not necessarily imply there is a buffering episode, while a sojourn time sustained above that target and over a large interval implies the phenomenon was not transient.
3.2 Detecting of buffering episodes at end-hosts
The coDel heuristic doesn’t apply directly at end-hosts: (i) we need to estimate the sojourn time from RTT samples, which can suffer from measurement noise mostly due to traffic conditions; (ii) in addition, we only observe traffic from one of the end-hosts behind the buffer (if the applications running on the end-host are not sending traffic continuously, which is often the case in practice, then we may not have enough samples to determine whether the additional delay in the buffer was indeed sustained for at least the given interval). We propose the following modification to the coDel heuristic to address these issues.
Additional delay as an estimate of sojourn time We use the additional delay of an RTT sample computed as the RTT sample minus the baseline latency to the same destination as an estimator for sojourn time across all buffers along
the path (we assume that, only one hop is experiencing a buffering episode at a time). To estimate the baseline latency to a destination we select the minimum RTT we observe for that destination during a session. Our algorithm later verifies whether a baseline latency estimate was computed during a buffering episode. If so, then we cannot be confident in our estimate of additional delay. If the additional delay is above the target, then we can still consider this sample. Otherwise, we discard the sample.
Setting target and interval We set the target to 5ms and the interval to 100ms as in coDel [3]. Although we are measuring additional delay at end-hosts and not the sojourn time in the buffer of the router, we choose to be conservative and use the same parameters as coDel. We will later filter out these episodes to select just the largest episodes (which we would have also detected using a higher target, or a longer interval).
Dealing with measurement noise CoDel defines the end of an episode when the sojourn time falls back under the target. Measurement noise may cause some RTT samples to be below the target even though the end-host is still experiencing the same buffering episode. This may happen when we overestimate the baseline latency for some destinations. To avoid breaking up one long episode into multiple shorter episodes, we aggregate shorter episodes that are within a threshold time of each other into a larger episode. This threshold time is defined as the smoothed average additional delay of all samples in the first episode plus the baseline latency of the last sample of this episode. We use the smoothed average because tcptrace sometimes reports unrealistic high RTTs that we attribute to measurement noise.
Dealing with sparsity of samples In some cases, the end-host we monitor may not be sending enough traffic, either because the application is not trying to send traffic or because buffering is so bad that sending rate becomes really low. If the problem is the latter, then we should see at least one sample per RTT. To account for these cases, we define that two RTT samples can potentially belong to the same episode if they are separated by less than a threshold. We set this threshold to the baseline latency of the last sample of this episode plus the smoothed average of the additional delay of this episode.
Gateway versus end-host view We then compare the output of our end-host heuristic with that of coDel running at the gateway with a controlled experiment using a simple topology: client—gateway—server. We vary uplink bandwidth from 10Kbps to 6Mbps and downlink bandwidth from 56Kbps to 100Mbps in both links; buffer size from 10 to 400 Kbits at the gateway; and latency from 5ms to 100ms and jitter from 1ms to 20ms at the server. Results vary depending on specific network conditions, but in general we see that: (i) the duration of episodes detected at the end-host is shorter than the duration of the same episode
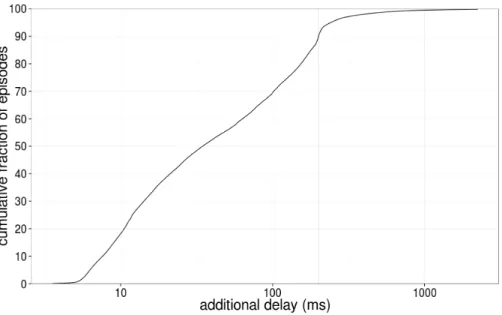
Fig. 2. Distribution of additional delay per buffering episode (computed as the area under the curve of additional delays of samples during this episode). We define all episodes that incur at least 200ms of additional delay as bufferbloat.
measured at the gateway (this is mainly due to the sparsity of samples), (ii) the additional delay seen at the end-host is most of the time larger than the sojourn time at the gateway (due to the effect of the jitter on tcptrace’s RTT calculation), (iii) the fraction of time where we detect a buffering episode at the end-host and coDel also detects an episode is 60%. Note that these two vantage points are measuring different things and that there is no notion of ground truth here. This comparison is only useful to illustrate how the two metrics differ.
3.3 Identifying bufferbloat
We apply the heuristic described in the previous section to the HostView data to identify the beginning and end of buffering episodes. Not all buffering episodes are significant, in fact most buffering is just part of normal TCP/network behav-ior. We now want to select a subset of the buffering episodes that are significant enough to potentially impact users. Figure 2 presents the cumulative distribu-tion of the addidistribu-tional delay per episode (the x-axis is in log scale). We compute the additional delay for an episode using the area under the curve defined by the additional delay corresponding to the successive RTT samples within this episode. For this computation we only take into consideration samples for which the baseline latency was computed outside of an episode. The additional delay of buffering episodes in our data varies from 5ms (which is the value of the target) to over 22 seconds. This distribution has a sharp knee at 200ms. 90% of buffering
episodes cause less than 200ms of additional delay. An additional delay of 200ms is significant when compared to typical RTTs and it should impact many in-teractive applications. Therefore, we choose to define bufferbloat as all buffering episodes that incur at least 200ms of additional delay. In the rest of this paper, we only study bufferbloated episodes.
Our approach allows us to infer the beginning and the end of each bufferbloat episode. This contrasts with Allman’s study [7], which simply studies distribu-tions of absolute RTTs and discusses how often RTTs larger than one second happen in the traces. Allman’s approach is appealing because it avoids having to parametrize bufferbloat, which is challenging in practice. Nevertheless, we choose to detect bufferbloat episodes so that we can study their duration, their magnitude, and their impact on applications. We pick a conservative threshold empirically to focus only on the largest episodes.
4
Bufferbloat characterization
This section analyzes bufferbloat episodes observed in the traffic of the 55 HostView users. We first study the occurrence of bufferbloat episodes and their duration. Then, we study by how much bufferbloat inflates RTTs and the duration of TCP connections. Finally, we analyze bufferbloat impact per application.
4.1 Bufferbloat occurrence
We detect at least one bufferbloat episode for 45 out of the 55 users we stud-ied. This result shows that bufferbloat affects users traffic in practice. Figure 3 presents the histogram of the number of bufferbloat episodes per hour for each of the 45 users who experienced at least one episode. We bin users according to the number of episodes per hour. For example, the first bin groups all users that had between zero and one episode per hour. Although the majority of users ex-perienced less than one episode per hour, seven users exex-perienced more than ten episodes per hour. One user, who connected from a residential ISP in Lebanon, experienced as many as 19.7 episodes per hour. We cannot generalize based on measurements from a single user. This example suggests, however, that having a larger deployment in developing regions, where residential access speeds are often lower, could discover a much higher occurrence of bufferbloat.
4.2 Duration of bufferbloat episodes
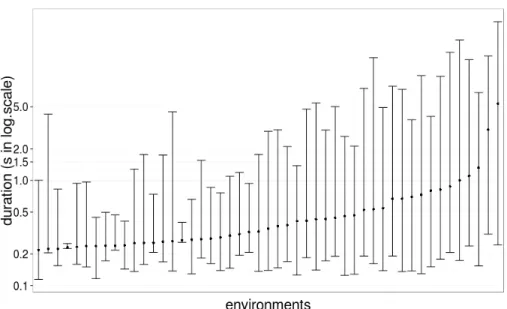
We study the duration of bufferbloat episodes. Intuitively, inflated RTTs over longer periods of time are more likely to affect users. Both the duration and the magnitude of bufferbloat episodes depend on the network environment users connect from: the size of the buffer, the connection speed (i.e., the buffer drain-ing rate), and the usage patterns (i.e., the traffic demand at the buffer). Figure 4 presents the distribution of duration of bufferbloat episodes per environment. We
Fig. 3. Histogram of the number of episodes per hour across users. The ticks in the x-axis mark the end of the range in a bin. The first bin groups users from 0 to 1 bufferbloat episode per hour, whereas the last groups users between 19 and 20 episodes per hour.
observe bufferbloat in a total of 86 network environments, but we only present re-sults for the 49 environments where we observed at least 100 bufferbloat episodes. We order environments by the median duration of episodes. In all the environ-ments, the median episode duration is above 200ms. However, the median dura-tion rarely exceeds 2s. We identify the ISP for the six environments with largest median episode duration and find that most of them are residential providers (two of them are a campus network, which may in fact be students who are in on-campus housing). This result confirms Allman’s findings that residential users often experience higher buffering delays than non-residential [7].
This figure shows that the duration of episodes vary considerably across environments and within an environment. Variation of episode duration across environments comes mainly from the differences in buffer size and connection speed, whereas variation in a single environment comes from the different traffic demands over time.
4.3 Impact of bufferbloat episodes
We now study the impact of bufferbloat episodes: how are connections affected? how are latencies and connection duration inflated? As in §3.3, we use the area under the curve of the additional delay of RTT samples in an episode as the additional delay of the episode. We already saw in the results presented in Fig-ure 2 that the absolute value of additional delay for bufferbloat episodes vary
Fig. 4. Box-plot of the duration of bufferbloat episodes across network environments with more than 100 episodes (ordered by the median duration of bufferbloat episodes). The point in the middle represents the median episode duration for an environment; the bottom line represents the 5th-% and the upper line the 95th-%.
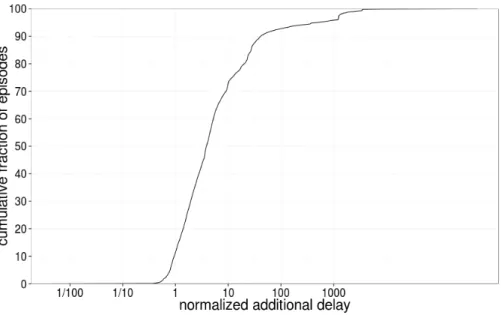
from 200ms (which is how we define bufferbloat) to over 10s. However, 200ms of additional delay on a baseline RTT of 20ms is far more significant than on a baseline of 200ms. We define the normalized additional delay of an RTT sample as the additional delay of an episode divided by the baseline latency for each RTT sample in that episode.
Figure 5 presents the cumulative distribution of the median normalized ad-ditional delay of RTT samples in an episode. We see that for 90% of bufferbloat episodes the normalized additional delay is above one, which means the added delay due to buffering is more than the baseline RTT for the destinations of packets in the episode. In 70% of cases the additional delay is more than twice the baseline RTT. This result shows that when bufferbloat happens, it is a sig-nificant factor on end-to-end RTTs.
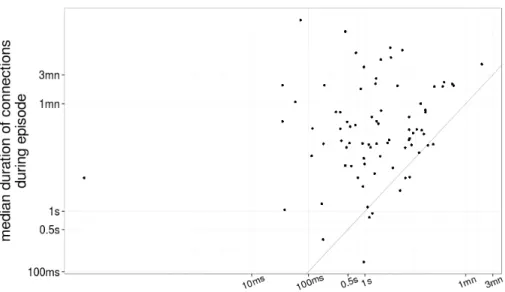
We also study by how much bufferbloat affects TCP connections, or how much longer TCP connections take to finish during bufferbloat episodes. Clearly, we cannot compare the same TCP connection during an episode and outside an episode. Instead, we study the median value of the duration of TCP connections in each environment and compare with the median duration during bufferbloat. Figure 6 presents the scatter plot of the median duration of TCP connections overall and during bufferbloat episodes per environment.
We see that the vast majority of points (90%) are above the x=y line. So on most environments bufferbloat increases the duration of TCP connections.
Fig. 5. Cumulative distribution of the median of the normalized additional delay during bufferbloat episodes. A normalized additional delay equal one means that the additional delay due to buffering is the same as the baseline RTT.
In some environments, the median duration of TCP connections went from less than 100ms to over a few minutes. The impact of the longer duration will depend on the application, which we study next.
4.4 Bufferbloat per application
This section characterizes bufferbloat per application. Bloated delays are more severe for interactive applications than bulk, for instance. We want to under-stand which applications most often appear during bufferbloat episodes and by how much their RTTs increase during bufferbloat episodes. We divide the RTT samples in each episode according to the application executable name. Together the 55 users we monitor use hundreds of different applications. For simplicity of presentation, we manually group these applications into six classes: streaming, which includes applications such as real-player, VLC; interactive, e.g., Skype, SSH; bulk, with applications like Dropbox, P2P clients, FTP; web, with all browsers; mail, with Thunderbird, mail; other, which includes applications we couldn’t fit in one of the previous categories. The HostView dataset has the application executable name for 84% of TCP connections. We exclude the 16% of connections for which we don’t have an application name from the rest of the analysis in this section.
Table 1 presents the rank of application classes based on the percentage of the bufferbloat episodes with traffic from each application class. We see that the
Fig. 6. Scatter plot of the median TCP connection duration per environment. Each point represents an environment. The x-axis is the median connection duration in the environment overall and the y-axis is the median connection duration only for connections that were affected by some bufferbloat episodes. The diagonal represents x=y.
vast majority of episodes affected interactive and web applications. Both these applications are sensitive to additional delays of few hundreds of milliseconds. Although bulk applications are often pointed out as the cause of bufferbloat, not all bufferbloat episodes co-occurred with bulk applications. Note that we are only measuring one end-host behind the buffer, so it is possible that another end-host is doing a bulk transfer that is causing bufferbloat but we don’t observe it in our data. Although we don’t know which application is causing bufferbloat, we can say that all applications sending traffic during the episode will suffer from the additional delay.
Table 1. Percentage of bufferbloat episodes per application class. application class % bufferbloat episodes
interactive 83.34% web 80.40% bulk 57.55% other 41.97% mail 38.99% streaming 1.09%
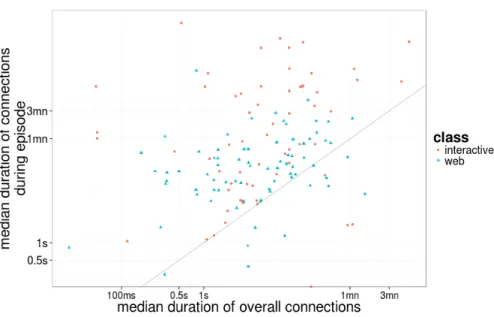
Fig. 7. Scatter plot of the median TCP connection duration for interactive and web applications per environment.
We analyze the increase in TCP connections duration for interactive and web applications during bufferbloat episodes. Figure 7 replots the same metrics as in Figure 6 only for interactive and web traffic.
The duration of TCP connection for both web and interactive applications increase considerably during bufferbloat (the vast majority of points are above the x=y line). For example, our analysis of the data in this figure shows that in 75% of environments TCP connections of web last less than 12 seconds, but during bufferbloat only in a little over 36% of environments connections last less than 12 seconds. For interactive applications, in approximately 2% of envi-ronments TCP connections have a median duration above three minutes. This percentage increases to 40% during bufferbloat episodes.
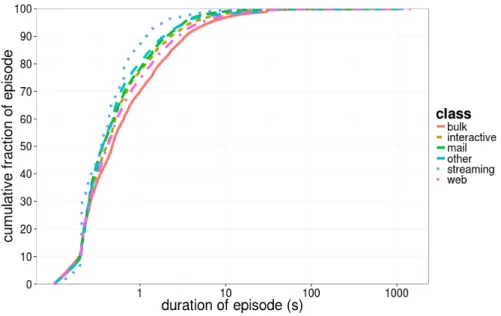
Figure 8 presents the duration of bufferbloat episodes in seconds per appli-cation class. The distribution of episode duration is similar across appliappli-cation classes. The only small deviation is for bulk and streaming applications. The results for streaming may deviate simply because we don’t have many streaming samples. Bufferbloat episodes that contain traffic of bulk applications that tend to last a bit longer when compared to other applications. This result is intuitive as bulk transfers tend to sustain a high transfer rate for longer periods of time.
5
Summary
This paper performed the first characterization of bufferbloat from data col-lected at end-hosts, where we can better gauge its impact on actual application
Fig. 8. Cumulative distribution of duration of bufferbloat episodes that affect each of the application classes.
performance as experienced by end-users. First, we designed an algorithm to detect buffering episodes from RTT samples passively collected at end-hosts. Our algorithm is robust to measurement noise and sparsity of RTT samples. It detects the beginning and end of each episode, which allow us to perform a more detailed characterization of buffering episodes. We define empirically that all buffering episodes that last for more than 200ms are bufferbloat episodes. Then, we apply this algorithm to data collected over Ethernet from 55 users in 87 network environments to study bufferbloat in the wild. Our results show that most users do experience bufferbloat episodes that introduce from 200ms to over 22s of additional delay for a sustained period of time. The magnitude and duration of bufferbloat episodes depends heavily on the network environment. Furthermore, we find that during bufferbloat episodes RTTs are at least doubled and sometimes over one thousand times more than baseline latency for the same destinations. This additional delay impacts the duration of TCP connections. Our analysis per application shows that web and interactive applications, which are particularly sensitive to delays, are the most often affected by bufferbloat.
Acknowledgment
We thank Diana Joumblatt, Diego da Hora, and Oana Goga, for their contribu-tions. We also thank shepherd, Philippe Owevarski. This work was partly done at the LINCS (Paris) and was supported by the European Commission’s Seventh Framework Program (FP7/2007-2013) no. 258378 (FIGARO).
References
1. C. Kreibich, N. Weaver, B. Nechaev, and V. Paxson, “Netalyzr: illuminating the edge network,” in Proceedings of the 10th ACM SIGCOMM conference on Internet measurement, ser. IMC ’10. New York, NY, USA: ACM, 2010, pp. 246–259. [Online]. Available: http://doi.acm.org/10.1145/1879141.1879173 2. J. Gettys and K. Nichols, “Bufferbloat: dark buffers in the internet,”
Commun. ACM, vol. 55, no. 1, pp. 57–65, Jan. 2012. [Online]. Available: http://doi.acm.org/10.1145/2063176.2063196
3. K. Nichols and V. Jacobson, “Controlling queue delay,” Queue, vol. 10, no. 5, pp. 20:20–20:34, May 2012. [Online]. Available: http://doi.acm.org/10.1145/2208917.2209336
4. S. Sundaresan, W. de Donato, N. Feamster, R. Teixeira, S. Crawford, and A. Pescap`e, “Broadband internet performance: A view from the gateway,” SIGCOMM Comput. Commun. Rev., vol. 41, no. 4, pp. 134–145, Aug. 2011. [Online]. Available: http://doi.acm.org/10.1145/2043164.2018452
5. L. DiCioccio, R. Teixeira, M. May, and C. Kreibich, “Probe and pray: using upnp for home network measurements,” in Proceedings of the 13th international conference on Passive and Active Measurement, ser. PAM’12. Berlin, Heidelberg: Springer-Verlag, 2012, pp. 96–105. [Online]. Available: http://dx.doi.org/10.1007/978-3-642-28537-0 10
6. C. Chirichella and D. Rossi, “To the moon and back: are internet bufferbloat delays really that large?” in TMA, 2013.
7. M. Allman, “Comments on bufferbloat,” SIGCOMM Comput. Commun. Rev., vol. 43, no. 1, pp. 30–37, Jan. 2012. [Online]. Available: http://doi.acm.org/10.1145/2427036.2427041
8. M. Ghobadi, Y. Cheng, A. Jain, and M. Mathis, “Trickle: rate limiting youtube video streaming,” in Proceedings of the 2012 USENIX conference on Annual Technical Conference, ser. USENIX ATC’12. Berkeley, CA, USA: USENIX Association, 2012, pp. 17–17. [Online]. Available: http://dl.acm.org/citation.cfm?id=2342821.2342838
9. H. Jiang, Y. Wang, K. Lee, and I. Rhee, “Tackling bufferbloat in 3g/4g networks,” in Proceedings of the 2012 ACM conference on Internet measurement conference, ser. IMC ’12. New York, NY, USA: ACM, 2012, pp. 329–342. [Online]. Available: http://doi.acm.org/10.1145/2398776.2398810
10. D. Joumblatt, R. Teixeira, J. Chandrashekar, and N. Taft, “Hostview: annotating end-host performance measurements with user feedback,” SIGMETRICS Perform. Eval. Rev., vol. 38, no. 3, pp. 43–48, Jan. 2011. [Online]. Available: http://doi.acm.org/10.1145/1925019.1925028
11. S. Ostermann, “tcptrace,” http://www.tcptrace.org/.
12. F. Gringoli, L. Salgarelli, M. Dusi, N. Cascarano, F. Risso, and k. c. claffy, “Gt: picking up the truth from the ground for internet traffic,” SIGCOMM Comput. Commun. Rev., vol. 39, no. 5, pp. 12–18, Oct. 2009. [Online]. Available: http://doi.acm.org/10.1145/1629607.1629610

![Risiko- & [und] Schutzfaktoren der psychischen Gesundheit humanitärer Einsatzhelfer : eine systematische Literaturübersicht](data:image/gif;base64,R0lGODlhAQABAIAAAP///wAAACH5BAEAAAAALAAAAAABAAEAAAICRAEAOw==)