Crop Breeding and Applied Biotechnology 4:298-304, 2004 Brazilian Society of Plant Breeding. Printed in Brazil
Prediction of selection gains in Coffea canephora based
on factorial scores
Adésio Ferreira
1*, Paulo Roberto Cecon
2, Cosme Damião Cruz
1, Romário Gava Ferrão
3, Marcia Flores da Silva
4, Aymbiré
Francisco Almeida da Fonseca
5, and Maria Amélia Gava Ferrão
5Received 6 April 2004 Accepted 11 July 2004
ABSTRACT - The technique of factor analysis in the simultaneous selection of traits and prediction of genetic gains was evaluated in Coffea canephora var. conilon. Fourteen traits in 40 assessed genotypes were evaluated at two sites. The technique was used aiming at the structuring and simplification of the data, without information loss and with biological interpretation. The experimental design was of randomized blocks in four replications, each plot containing two useful plants. The technique was efficient for the data simplification and structuring. Moreover, the estimates of the predicted gains in the traits involved in the factors showed magnitude near the direct selection gain, attesting the suitability of the technique and its use in improvement programs of the species.
Key words: coffee, genetics and plant improvement, multivariate analysis.
1Departamento de Biologia Geral, Universidade Federal de Viçosa (UFV), 36570-000, Viçosa, MG, Brasil.
*E-mail: adesio@vicosa.ufv.br
2Departamento Informática, UFV
3Instituto Capixaba de Pesquisa, Assistência Técnica e Extensão Rural (INCAPER), Rua Afonso Sarlo, 160, Bento Ferreira, 29052-010,
Vitória, ES, Brasil
4Departamento de Bioquímica e Biologia Molecular, UFV
5Centro Regional Centro-Serrano, INCAPER, BR 262, km 92, 29052-010, Venda Nova do Imigrante, ES, Brasil INTRODUCTION
C o f f e a c a n e p h o r a i s a s p e c i e s t h a t h a s b e e n commercially exploited in Brazil since the 50s, when soluble coffee came up. The species was used in blends of roasted and ground coffee with Coffea arabica (Malta 1986) and gives these a greater industrial output with lower sales prices, and consequently a higher competitiveness on the market.
The programs of genetic improvement of C. canephora have focused especially on achieving productive clonal or
synthetic varieties with enhanced beverage quality (Charrier and Berthaud 1988, Ferrão et al. 2000).
According to Cruz and Carneiro (2003), a way to achieve a genetic superior material in improvement programs, is to deal, simultaneously, with a set of favorable attributes that lead to a comparatively higher productivity, meeting all requirements of consumers as well as producers. The authors mention that selection based on one or few traits has proven inadequate.
C. canephora breeding programs with the objective of simultaneously selecting several attributes require special
attention, since many of the analyzed traits are highly correlated and can therefore obtain indirect favorable gains with positive and negative correlations, according to the desired objective. However, undesirable indirect gains are also possible, causing serious practical problems, owing to the inconvenient positive and negative correlations. The high magnitudes of these correlations can cause difficulties at obtaining reliable estimates of genetic parameters, due to the multicolinearity.
The breeding strategies for the crop must be reasonably applied, using adequate techniques. Factor analysis is, according to Cruz and Carneiro (2003), a multivariate technique that aims at structuring and simplifying the original data, so that a relatively large number of traits can be represented by fewer, conserving a maximum of information. So theoretically, the technique can be used to minimize the problem of the practice of simultaneous selection in Coffea canephora.
This study aimed at evaluating the possibility of using factor analysis to help solve the problem of selection with several attributes in Coffea canephora var. Conilon improvement programs predicting selection gains, assessing 14 traits in 40 genotypes and in two environments.
MATERIAL AND METHODS
Forty Coffea canephora var. Conilon genotypes were studied, which are part of the improvement program of the INCAPER of the Espírito Santo (ES) State. Thirty-five of the clones had their origin in the phenotypic selection of mother plants from agricultural properties in several counties across the northern region of the ES; three were elite clones (ES 01 classified as of early maturation, ES 23 of intermediate, and ES 36 of late maturation); a cultivar of the seminal population type from the INCAPER improvement program, and a polyclonal commercial cultivar.
Data from two experiments conducted on experimental farms of the INCAPER, in Marilândia and Sooretama, counties whose soil and climate are representative of the region in the north of the state, where the species is intensely cultivated, were collected in the harvests of 1996, 1998, 1999, 2000, and 2001 and analyzed.
In the county of Marilândia (190 24’ lat S, 400 31’ long W, and altitude 150 m asl) the soil of low fertility is prevailingly crystalline; the annual rainfall precipitation 1200 mm; the mean annual temperature 23 0C; relative humidity 80%; and the topography is strongly undulated. The county of Sooretama (150 47’ lat S, 430 18’ long W, and altitude 40 m asl) has a sandy soil (80% sand), yellow red dystrophic latosol of low fertility; with an annual rainfall precipitation of 1100 mm; mean annual temperature of 24 0C; relative humidity of 80%; and the topography is plain with predominant south wind.
The soil was fertilized according to a previous soil analysis for a target yield of 80 sacks of processed coffee per ha (340 kg ha-1 N, 55 kg ha-1 P
2O5, and 170 kg ha-1 K2O) in three applications. The management and cultural treatments during the experiments were carried out following the requirements and technical recommendations for the crop, without irrigation. The experiment was established in randomized complete blocks in four replications, each plot represented by two plants in a 3.0 x 1.5 m spacing and plant density of 2222 plants ha-1. The treatments were evaluated in five samples 24, 48, 60, 72, and 84 months after planting. The following traits were assessed: 1) cycle - number of days between the main flowering and harvest; 2) productivity - processed bean yield in kg ha-1, with 14% humidity; 3) yield in kg of cherry/fruit dried (CfCo); 4) yield in kg of cherry fruit/processed beans (CfPb); 5) yield in kg dried cherry/processed beans (CoPb); 6) percentage of fruits with peaberry beans; 7) percentage of flat beans; 8) percentage of peaberry beans; 9) percentage of humidity; 10) percentage of beans retained in a screen coarser than 15 (S 17); 11) percentage of beans retained in a 15 screen (S 15); 12) percentage of beans retained in a 13 screen (S 13); 13) percentage of beans retained in a 11 screen (S 11); and 14) screen mean (Sm).
The applied factor analysis model was the one proposed by Cruz and Carneiro (2003):
j m jm 2 2 j 1 1 j j I F I F ... I F X = + + + +ε where
is the variable with
is the factorial loading for the variable associated to the factor, and
is the common factor and the specific factor of the variable.
Similarly to Abreu et al. (1999), an initial definition of a number of common factors equal to the number of eigenvalues that are higher than the unit and the model of the orthogonal, i.e., not correlated factors were chosen.
After establishing the number of common factors, the communalities ( ) were calculated by the expression: , where is the variance of the specific factor associated to the variable, and the initial factor loadings of these factors. After the orthogonal rotation based on the varimax algorithm (Mardia et al. 1979), the final loadings were obtained. Each factor was interpreted and the factorial scores obtained by the equation:
where
1 x m vector of dimension of the factorial scores; p x m matrix of dimension of the final rotated factor loadings;
p x 1 vector of dimension of the trait means of the kth genotype. Hence, for each genotype, there will be m new traits, which will correspond to different factors.
The score values were considered representative of a new variable or complex, used as selection criterion in order to obtain simultaneous gains in the original variables. Thereafter, the variance of these new complexes was analyzed and the genetic parameters and selection gains estimated for both sites. To estimate the proportional selection gain of the original variables in consequence of the selection realized on the factorial scores of the complex, the following expression was adopted:
− = j 2 j ji% (DSH )100/X SG where
selection differential obtained in trait j by the selection realized on the complex i
genotypic determination coefficient of trait j; genotypic mean of trait j.
The statistical analyses were run on the software Genes (Cruz 1997).
RESULTS AND DISCUSSION Factor evaluation
Table 1 presents the final factor loadings and the communalities obtained by the factor analysis with data of
the experiments in Marilândia and Sooretama. Based on the final factor loadings, the possibility of establishing representative factors of the biological complex was evaluated. These were determined by the greatest values of these loadings and their signals. Traits with the same target gain in C. canephora var. Conilon improvement programs must have identical signals and those with opposed objectives opposite signals, and the magnitude and signal of the final factor loadings of the trait yield must be verified. Final factor loadings with values above 0.7 were considered high, and values above 0.64 were adopted for the communality.
Four factors were obtained from the experiment in Marilândia. The first factor (F1) was related to the traits retained in screens S.17, S.15, S.13, S.11. The Sm presented the greatest final factor loadings and signals according to the objectives of coffee improvement programs. This factor was interpreted as the complex called SCREEN. The second factor (F2) presented highest factor loadings with adequate signals for the traits cycle, CfCo, CfPb, and CoPb. It was the most influenced by processing and cycle, which explains the complex designated YIELD1. The third factor (F3) was most linked to the type of bean quality, with the highest final factor loadings for the traits flat and peaberry, which explains the complex called BEAN TYPE. The fourth factor (F4) was related to the malformed fruits, with highest final factor loadings for the trait malformed, which explains the complex denominated EMPTY.
Table 1. Final loadings factor and communality (C) values obtained by the factor analysis of the traits evaluated in genotypes of Coffea
canephora var. conilon, of the harvests 1996 and 1998 to 2001
Marilândia S o o r e t a m a
Final loading factor Final loading factor
F1 F2 F3 F4 C F1 F2 F3 F4 C cycle -0.1998 0.7959 -0.3015 -0.0404 0.7659 0.3527 0.4679 -0.3013 -0.2110 0.4786 Product. -0.4733 0.0961 -0.1458 -0.5681 0.5773 0.2334 -0.1359 -0.0094 0.6688 0.5203 C f C o 0.0686 0.8791 0.0428 -0.2331 0.8337 -0.1716 0.0201 0.0942 0.8438 0.7508 CfPb 0.0474 0.9294 -0.0171 0.2146 0.9123 -0.1886 0.9287 -0.0712 0.1728 0.9330 CoPb 0.1161 0.7189 -0.1046 0.5784 0.8757 -0.1115 0.9237 -0.1038 -0.2159 0.9231 Empty 0.0307 0.0364 0.1145 0.8861 0.8005 0.0840 0.8168 0.1031 -0.2510 0.7479 Flat -0.2148 -0.1079 0.9469 0.0743 0.9599 0.2301 -0.1219 0.9411 0.0422 0.9553 peaberry 0.1879 0.0856 -0.9559 -0.0675 0.9609 -0.2271 0.1174 -0.9415 -0.0446 0.9538 m o i s t u r e -0.3886 0.1457 -0.1721 0.2884 0.2850 -0.2227 -0.6257 0.2453 -0.2002 0.5413 S 17 -0.8186 -0.1713 0.2543 0.0030 0.7641 0.8970 0.0198 0.1841 -0.0178 0.8393 S 15 -0.8926 0.1010 0.0347 -0.1249 0.8237 0.9550 0.0142 0.0760 0.0574 0.9212 S 13 0.8985 0.1210 -0.1728 -0.0862 0.8593 -0.8577 0.0117 0.0469 -0.0081 0.7381 S 11 0.8777 -0.1070 -0.1020 0.2881 0.8752 -0.8534 -0.0391 -0.2380 -0.0380 0.7880 S m -0.9619 -0.0396 0.1895 -0.1118 0.9752 0.9688 0.0329 0.1746 0.0161 0.9704
*Values in bold refer to the loadings factor of the traits that compose the factors and their communalities
Variables
Sooretama
Final loading factor
Marilândia Final loading factor
Table 2. Summary of the variance analyses, general mean and VC% of the evaluated traits in genotypes of Coffea canephora var.
conilon, for the harvests 1996 and 1998 to 2001
Mean squares of the variation sources
Blocks1 Genotypes1 Error1 G e n e r a l V C
(3) (39) (117) M e a n % Marilândia productivity 93247.85 1663294.88** 178025.76 2990.34 14.11 SCREEN 0.27 4.00** 0.15 -5.29 7.22 YIELD1 0.40 4.00** 0.32 21.71 2.60 BEAN TYPE 1.41 4.00** 0.35 7.35 8.10 E M P T Y 3.29 4.00** 0.75 1.06 81.33 S o o r e t a m a productivity 131398.65 1040166.58** 62825.91 2393.37 10.47 SCREEN 0.04 4.00** 0.04 0.40 48.16 YIELD2 1.56 4.00** 0.38 7.36 8.37 BEAN TYPE 0.24 4.00** 0.27 11.13 4.63
** Significant at P<0.01 by the F test; productivity: bean yield in five harvests (kg ha-1); SCREEN: S 17, S 15, S 13, S 11, and Sm; YIELD1:
ratios CfCo, CfPb, CoPb, and cycle; YIELD2: ratios CfPb, CoPb, and malformed; BEAN TYPE: percentage of flat and peaberry beans; EMPTY: percentage of malformed beans. 1value in brackets expresses the degree of freedom
Three factors were obtained from the experiment in Sooretama. The first factor (F1) was related to the traits bean size. This factor explains the complex called SCREEN, as in Marilândia. The second factor (F2) was more related to the yield, presenting highest final factor loadings and appropriate signals for the traits CfPb, CoPb, and malformed, so this factor explains the complex designated YIELD2. The third factor (F3) was more influenced by the quality, since it presented highest final factor loadings and adequate signals for the traits flat and mocha, which explains the complex BEAN TYPE. In this experiment, no fourth factor (F4) was obtained, since the trait CfCo presented a factorial loading of 0.84 and a high communality of 0.75, but the signal of the final factorial loading was identical to that of the productivity. This last trait had a relative high final factorial loading (0.66), which was inadequate for the goal of a Coffea canephora improvement program, where the ratio CfCo is being diminished and the productivity increased, which would not occur if this factor were used. It was therefore not considered a factor of biological interest.
The productivity trait was not included in complexes, suggesting the absence of correlation between this trait and the factors, as demonstrated by their final factor loadings below 0.7 and communality lower than 0.64.
Variance analysis and genetic parameters
Significant values (P < 0.01) of the genotype effects were verified by the F test for all complexes and for
productivity at both sites, which would give proof of the existence of genetic variability, required for selection, making the identification of superior genetic material possible (Table 2). There were differences between the estimates of the experimental precision (VC%) (Table 2) of the evaluated complexes. This indicates a weaker influence of the environment on YIELD1 in Marilândia and, on bean type in Sooretama, which also indicates a weaker effect of the environment on these traits. There was a stronger influence for EMPTY in Marilândia and for SCREEN in Sooretama.
Table 3 presents the phenotypic, environmental, and genotypic variances, the genotypic determination coefficient among progenies, the percentage of the genotypic variation c o e f f i c i e n t ( V Cg) , a n d t h e r a t i o o f t h e g e n e t i c a n d environmental VC (VCg/VCe) in Marilândia and Sooretama. In Marilândia, these variation values were higher than 1.04 and lower than 2.57, and in Sooretama, they were higher than 1.54 and lower than 5.10. According to Vencovsky (1987), values of this index equal to or higher than 1.0 indicate a favorable situation for selection. The complexes as well as the productivity presented a genotypic determination coefficient (H2) equal to or higher than 81.29%, attaining 96.36% for SCREEN in Marilândia. In Sooretama, all complexes and the productivity presented a genotypic determination coefficient (H2) equal to or higher than 90.50%, attaining 99.05%, for SCREEN. The predominance of the genetic variability in relation to the environmental was characterized at both sites, for all complexes and for
productivity. However, the results suggested a favorable condition for improvement, because H2 is a relative parameter of reliability by which the phenotypic value represents the genotypic value.
Table 4 displays the values of the original mean, selected mean, selection differential, genotypic determination coefficient, and estimates of the predicted gain by direct
selection. All factors provided an adequate combination of expected gains in the considered traits, as is desirable in improvement programs of the species according to Ferrão et. al (1999) and Fonseca et al. (2001), as for example increase in the traits S 17 and S 15, decrease in the percentage of peaberry beans, and increase in the percentage of flat beans (Tables 5 and 6). The direct gains for the traits were higher than the Table 3. Estimates of the genetic and environmental parameters of the complexes, established by the factor analysis, based on the linear combinations of the traits evaluated in Coffea canephora var. conilon, genotypes of the harvests of 1996 and 1998 to 2001 in Marilândia and Sooretama
Variances of the variation sources of genetic-statistical parameters
% Marilândia productivity 415823.72 44506.44 371317.28 89.30 20.38 1.44 SCREEN 1.00 0.04 0.96 96.36 18.56 2.57 YIELD1 1.00 0.08 0.92 92.02 4.42 1.70 BEAN TYPE 1.00 0.09 0.91 91.15 12.99 1.60 E M P T Y 1.00 0.19 0.81 81.29 84.75 1.04 S o o r e t a m a productivity 260041.64 15706.48 244335.17 93.96 20.65 1.97 SCREEN 1.00 0.01 0.99 99.05 245.74 5.10 YIELD2 1.00 0.09 0.91 90.50 12.92 1.54 BEAN TYPE 1.00 0.07 0.93 93.37 8.68 1.88
productivity: bean yields in five harvests (kg ha-1); SCREEN: S 17, S 15, S 13, S 11 and Sm; YIELD1: ratios CfCo, CfPb, CoPb, and cycle;
YIELD2: ratios CfPb, CoPb, and malformed; BEAN TYPE: percentage of flat and mocha beans; EMPTY: percentage of malformed beans; : Mean phenotypic variance; :mean variance; : mean genotypic variance; H2: Herdability; VC
g(%) : coefficient of the genetic variation;
VCe: environmental variation coefficient Variables
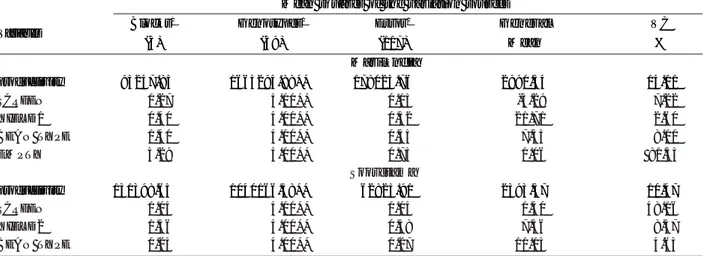
Table 4. Estimates of the predicted gains with direct selection (SG), genotypic determination coefficient (H2), original mean (X 0), selection mean (XS), and differential selection (DS) in the traits of Coffea canephora var. conilon genotypes, in the harvests 1996, 1998, 1999, 2000, and 2001 in Marilândia and Sooretama
Variables X0 XS D S H 2 S G S G % % Marilândia productivity 2990.34 3759.26 768.92 89.30 686.62 22.96 SCREEN -5.29 -6.44 -1.15 96.36 -1.10 20.87 YIELD1 21.71 20.48 -1.23 92.02 -1.13 -5.22 BEAN TYPE 7.35 8.41 1.06 91.15 0.97 13.15 E M P T Y 1.06 -0.23 -1.29 81.29 -1.05 -98.54 S o o r e t a m a productivity 2393.37 3040.70 647.33 93.96 608.24 25.41 SCREEN 0.40 1.62 1.20 99.05 1.20 296.09 YIELD2 7.36 6.32 -1.04 90.50 -0.94 -12.82 BEAN TYPE 11.13 12.25 1.12 93.37 1.04 9.38
SG (%): selection gain based on the selection differential; productivity: beans yields in five harvests (Kg ha-1); SCREEN: S 17, S 15, S 13,
S 11, and Sm; YIELD1: ratios CfCo, CfPb, CoPb, and cycle; YIELD2: ratios CfPb, CoPb, and malformed; BEAN TYPE: percentage of flat and malformed beans; EMPTY: percentage of malformed beans
%
Marilândia
gains by the complexes. However, direct selection did not obtain adequate simultaneous gains for any of the traits in the other involved traits, which was the case with selection via complexes.
Based on the obtained results, the simplification and structuring of the original data of Coffea canephora were obtained in the two experiments by the factor analysis. In Marilândia 12 traits were represented by four complexes, and in Sooretama 10 traits were represented by three complexes. The factors preserved a maximum of information of the traits in the experiments, made quite clear by the estimates of the predicted gains obtained by the complexes, which were close to the prediction of the direct selection gains in the traits.
The analyses of the two experiments demonstrated that the use of the factor analysis technique was adequate and there was evidence that it could be applied in Coffea canephora improvement programs.
ACKNOWLEDGEMENTS
Data courtesy of the Instituto Capixaba de Pesquisa, Assistência Técnica and Extensão Rural (INCAPER). The authors wish to thank the Universidade Federal de Viçosa, the Conselho Nacional de Desenvolvimento Científico and Te c n o l ó g i c o ( C N P q ) , a n d t h e C o o r d e n a ç ã o d e Aperfeiçoamento de Pessoal de Nível Superior (CAPES).
Predição de ganhos genéticos em Coffea canephora com
base em escores fatoriais
RESUMO - Avaliou-se a utilização da técnica de análise de fatores na seleção simultânea de caracteres e predição de ganhos genéticos em Coffea canephora var. conilon. Foram avaliados 14 caracteres em 40 genótipos ensaiados em dois locais. A técnica foi utilizada visando a estruturação e a simplificação dos dados, sem perda de informação e com interpretação biológica. Os dados analisados pertencem ao programa de melhoramento do INCAPER/ES. O delineamento experimental utilizado foi o de blocos casualizados com quatro repetições, cada parcela composta por duas plantas úteis. A técnica foi eficiente na simplificação e estruturação dos dados. As estimativas de ganhos preditos nas características envolvidas nos fatores apresentaram magnitudes próximas ao ganho com seleção direta, atestando o potencial de uso da técnica em programas de melhoramento da espécie.
Palavras-chave: café, genética e melhoramento de plantas, análise multivariada.
Table 5. Percentage of predicted gains in Marilândia for the traits
that compose the complexes SCREEN, YIELD1, BEAN TYPE, and EMPTY by the selection via complexes and direct selection in the traits SCREEN S.17 105.23 121.55 S.15 22.96 30.28 S.13 -37.1 -42.68 S.11 -58.7 -60.49 Sm 5.70 6.11 YIELD1 cycle -5.29 -6.61 CfCo -3.86 -4.12 CfPb -7.91 -8.78 CoPb -3.31 -5.10 BEAN TYPE flat 4.89 5.18 peaberry -22.59 -24.00 EMPTY empty -28.48 -31.81
Variables Selection gain via complexes
Direct selection gain in the traits 6. , 2, . 1 7 1 1 6 . 1 9 1 3 0 . 3 6 . 1 5 3 7 . 5 9 3 8 . 2 6 . 1 3 29.79 30.56 . 1 1 54.96 59.52 6 . 1 2 6.30 2 7.08 7.53 7 . 1 8 7.68 40.84 52.82 4.90 4.99 2 1 . 6 9 22.08
Variables Selection gain via complexes
Direct selection gain in the traits
REFERENCES
Abreu VMN, Cruz CD, Silva MA, Figueiredo, EAP and Abreu PG (1999) Estudo da capacidade de combinação de linhagens de matrizes de frango de corte, por meio da análise de fatores de características produtivas. Revista Brasileira de Zootecnia 28: 1209-1218.
Charrier A and Berthaud J (1988) Principles and methods in coffee plant breeding: Coffea canephora Pierre. In: Clark RJ and Macrae R (eds.) Coffee agronomy. Editora Elsevier, London, p. 167-195.
Cruz CD and Carneiro PC (2003) Modelos biométricos aplicados ao melhoramento genético. Editora UFV, Viçosa, 623p. Cruz CD (1997) Programa Genes: aplicativo computacional
em genética e estatística. Editora UFV, Viçosa, 442p. Ferrão RG, Ferrão MAG and Fonseca AFA (2000) Desempenho
de clones de café conilon no estado do Espírito Santo. In: Simpósio dos Cafés do Brasil. Embrapa Café/Minasplan, Poços de Caldas, p. 430-433.
Ferrão RG, Fonseca AFA and Ferrão MAG (1999) Programa de m e l h o r a m e n t o g e n é t i c o d e c a f é r o b u s t a n o B r a s i l . I n : Simpósio de Atualização em Genética e Melhoramento de Plantas . UFLA, Núcleo de Estudos em Cafeicultura, Lavras, p. 50-65.
Fonseca AFA, Ferrão RG, Ferrão MAG, Santos LP, Bragança SM and Marques EMG (2001) Melhoramento genético de Coffea
c a n e p h o r a n o e s t a d o d o E s p í r i t o S a n t o . I n : S i m p ó s i o
B r a s i l e i r o d e P e s q u i s a d o s C a f é s d o B r a s i l. E m b r a p a Café, Vitória, p. 1379-1384.
Malta MM (1986) Brasil - novo produtor de café robusta. In: Seminário Internacional do Café Robusta . SEAG-ES, Vitória, p. 19-28.
Mardia KV, Kent JT and Bibby J (1979) Multivariate analysis. Academic Press, London, 518p.
Vencovsky R (1987) Herança quantitativa. In: Paterniani E and Viegas GP (eds.) Melhoramento e produção do milho. Fundação Cargill, Campinas, p. 137-214.