i
Université de Montréal
Synthesis of a Biotin-functionalized biguanide for the identification
of the tumor growth inhibition mechanism of Metformin
Par
Farzaneh Mohebali
Département de chimie
Faculté des arts et des sciences
Mémoire présenté à la Faculté des études supérieures et postdoctorales
En vue de l’obtention de grade de
Maîtrise ès sciences (M.Sc.)
en chimie
août 2017
i
Acknowledgments
At the beginning, I would like to show my appreciation for my advisor, Prof. Andreea Schmitzer for trusting and offering me this honorable opportunity to study and work as one of her group’s member. She supported me throughout my thesis with her patience and knowledge. I also want to thank all the members of Prof. Andreea Schmitzer’s group for their helpful suggestion and comments regarding this project.
I present my appreciation of the Department of Chemistry, Université de Montréal for providing the required facilities and suitable environment to pursue my Master’s degree. I owe appreciation to all those who have supported me to reach the results of my thesis, especially Dr. A. Fürtös, K. Venne, and M-C. Tang from the Laboratory of Mass Spectrometry, Sylvie Bilodeau, Antoine Hamel and Cedric Malveau from the Laboratory of NMR Spectroscopy and Francine Belanger-Gariepy from the Laboratory of X-ray Analysis, at the Université de Montréal. I thank them for their assistance to perform many of the analyses herein.
I thank my family for their love and support. Last but not the least, I thank my husband for all of his support and efforts during the completion of this research.
ii
Résumé
La metformine est largement utilisée pour réduire le taux de glycémie dans le cas des patients souffrant de diabète de type 2. Dans des études récentes, les chercheurs ont observé une association inverse entre l'utilisation de la metformine et le cancer dans différents tissus. L'inhibition du complexe I de la chaine respiratoire des mitochondries a été considéré responsable pour l'activité antinéoplasique de la metformine, mais le mécanisme par lequel la metformine conduit à inhiber le complexe I et, par conséquent, la prolifération des cellules cancéreuses, n'a jamais été entièrement démontrée ou comprise.
Dans cette thèse, nous nous somme proposé d'identifier le mécanisme d'action de la metformine et de sa cible dans les mitochondries, en fonctionnalisant la biguanide analogue de la metformine avec de la biotine. Des extraits de mitochondries ont mises en contact avec la metformine biotinylée et ont été séparés sur des colonnes d'affinité contenant de la streptavidine immobilisée. Les protéines éluées après les étapes de lavage ont été analysées par LC-MS/MS et leurs séquences analysées en utilisant l'algorithme BLAST (NCBI). Nous avons isolé et identifié par spectrométrie de masse (MS) une protéine de 8 KDa qui lie spécifiquement et directement la metformine. Cette protéine a été identifiée comme étant la sous-unité de la ATP synthase. Nos résultats suggèrent que la metformine inhibe la prolifération des cellules cancéreuses par l'inhibition directe de l'ATP synthase de la chaîne respiratoire mitochondriale.
Les travaux présentés dans cette thèse ont été réalisés dans le département de chimie, en collaboration avec le département de biochimie et médecine moléculaire de l'université de Montréal.
Mot-clés : metformine, biguanide, biotine, streptavidine, chromatographie d'affinité, anticancéreux, complexe I, ATP synthase, chaîne respiratoire des mitochondries
iii
Abstract
Metformin is widely used to reduce high blood sugar levels in type 2 diabetes patients.In recent studies, researchers observed an inverse association between metformin use and cancer incidence in different tissues. Inhibition of the mitochondrial respiratory complex I has been proposed to be the cause of the antineoplastic activity of metformin, but the mechanism by which metformin inhibits the complex I and consequently stops proliferation of cancer cells was not fully identified and understood.
In this thesis, we present the functionalization of a biguanide. A metformin - biotin conjugate was synthesized and used to identify the mechanism of action of metformin and its target in mitochondria. Mitochondrial extracts were put in contact with the biotinylated biguanide and were passed over affinity columns containing immobilized streptavidin. The proteins eluted after the washing steps were analyzed by LC-MS/MS and their sequences analyzed using the BLAST algorithm (NCBI).
We isolated and identified by mass spectrometry (MS) an 8 KDa protein that specifically and directly binds metformin. This protein has been identified as the ATP synthase-subunit e. Our results suggest that metformin inhibits cancer cell proliferation through the direct inhibition of the ATP synthase of the mitochondrial respiratory chain.
The research presented in this thesis has been performed in the Department of Chemistry, in collaboration with the Department of Biochemistry and Molecular Medicine, at the University of Montreal.
Keywords: metformin, biotin, streptavidin, affinity chromatography, anticancer, complex I, ATP synthase, biguanide, mitochondria respiratory chain,
iv Table of Contents
List of Figures ... vii
List of Schemes ... ix
List of Tables ... x
List of Abbreviations ... xii
Chapter 1 : Introduction ... 1
1.1. Metformin ... 2
1.2. Antidiabetic effect of metformin ... 3
1.3. Metformin and the inhibition of cancer cell growth ... 6
1.4. The AMPK-depended mechanism ... 9
1.5. The AMPK-independed mechanism ... 9
1.6. Cellular target of metformin in cancer cells ... 10
1.6.1. Effect of metformin and other biguanides on isolated complex I ... 13
1.6.2. Effect of metformin and other biguanides on complex V ... 15
1.7. Our objectives ... 16
Chapter 22 : Synthesis of the biotin-conjugated biguanide ... 22
2.1. Introduction ... 23
2.2. Results and discussion ... 24
2.2.1. Synthetic protocol A ... 24
2.2.2. Synthetic protocol B ... 29
v 2.3. Purification of 2.5 by preparative HPLC ... 34 2.4.. Experimental ... 35 2.4.1. 6-(tert-Butoxycarbonylamino)hexylamine (2.1)... 35 2.4.2. (2,5-Dioxopyrrolidin-1-yl-5-((3aS,4S,6aR)-2-oxohexahydro-1H-thieno[3,4-d]imidazol-4-yl)pentanoate (2.2) ... 36 2.4.3. 6-((((Amino(iminio)methyl)amino)(iminio)methyl)amino)hexan-1-aminium (2.6) .. 37 2.4.4. Amino((iminio((6-(5-((3aS,4S,6aR)-2-oxohexahydro-1H-thieno[3,4-d]imidazol-4-yl) pentanamido)hexyl)amino)methyl)amino)methaniminium (2.5) ... 38 2.4.5. tert-Butyl(6-(5-((3aS,4S,6aR)-2-oxohexahydro-1H-thieno[3,4-d]imidazol-4-yl)pentan amido)hexyl)carbamate (2.3) ... 39 2.4.6. 6-(5-((3aS,4S,6aR)-2-Oxohexahydro-1H-thieno[3,4-d]imidazol-4yl)pentanamido)hexan-1-ammonium chloride (2.4) ... 40 2.5. Conclusion ... 41 2.6. References ... 42
Chapter 3 : Identification of the metformin’s target byaffinity chromatography ... 43
3.1. Introduction ... 44
3.1.1. Biotin-Strept(avidin) System ... 44
3.1.2. Affinity chromatography method for the identification of proteins interacting with metformin ... 46
3.1.3. Structure of the ATP synthases enzyme ... 48
3.1.4. The ATP synthases subunit e (ATP5I) ... 52
3.2. Materials and methods ... 53
3.2.1. Cell culture and treatments ... 53
3.2.2. Mitochondrial protein isolation... 54
vi
3.2.4. Indirect capture of biotinylated metformin ... 55
3.2.5. Mass spectrometry ... 56
3.3. Results and discussion ... 56
3.3.1. In vivo activity of 2.5 ... 56
3.3.2. Identification of metformin-AMP5I interaction ... 57
3.3.3. Association of ATP5I with the anticancer properties of metformin ... 58
3.4. Conclusion ... 59
3.5. References ... 60
Chapter 4: Conclusion ... 64
Appendix ... 66
Spectral data related to chapter 2 ... 66
vii List of Figures
Figure 1.1. Chemical structure of Metformin ... 2
Figure 1.2. G. officinalis Linn ... 2
Figure1.3. Molecular mechanisms of the effect of metformin on hepatic gluconeogenesis21 ... 5
Figure1.4. Effect of metformin on cancer cells53 ... 10
Figure 1.5. Effect of metformin on oxygen uptake in intact isolated hepatocytes, permeabilized hepatocytes and isolated liver mitochondria.56 ... 12
Figure 1.6. Inhibition of mitochondrial respiration by metformin in permeabilized rat hepatoma cells.18... 13
Figure 1.7. Effects of biguanides on isolated bovine complex I.57 ... 14
Figure 1.8. Effect on biguanides on the inhibition of ATP hydrolysis57 ... 15
Figure 1.9. Relative inhibition of ATP production in SMPs in the presence of piericidin (open circles) and metformin (filled circles).57 ... 16
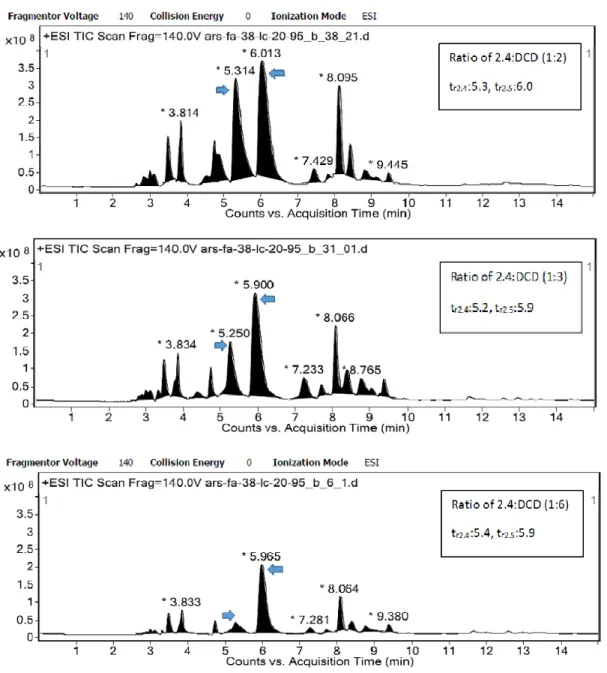
Figure 2.1. Screening the LCMS of the crude sample, obtained from the fusion method by increasing the ratio of DCD ... 28
Figure 3.1. Structure of biotin ... 45
Figure 3.2. Biotin-streptavidin interaction ... 45
Figure 3.3. Identification of the protein target of a bioactive small molecule using affinity chromatography .6 ... 47
Figure 3.4. ATP synthase in the inner membrane of mitochondria.9 ... 48
viii
Figure 3.6. The role of subunit e in stabilizing the ATP synthase dimer (A) and oligomers (B).32 ... 53 Figure 3.7. Western blot analysis of KP-4 cells by metformin or 2.5. ... 57 Figure 3.8. Coomassie staining of the SDS-PAGE showing proteins recovered after pull-down for the identified samples. ... 58
ix List of Schemes
Scheme 2.1. Structures of the designed biotin-functionalized ammonium salt and biotinylated
biguanide ... 23
Scheme 2.2. Proposed synthetic protocol A ... 25
Scheme 2.3. Proposed synthetic method B ... 30
Scheme 2.4. Synthesis of biguanide compounds using FeCl3 as catalysis8 ... 32
x List of Tables
Table 1.1. Protective effect of metformin in animal models of cancer25 ... 7
Table 2.1. Attempts to synthesize BFB 2.5 using method type A ... 26
Table 2.2. Effect of the reaction time on the formation of 2.5 ... 27
Table 2.3. Effect of the ratio of the DCD on the yield of 2.5 ... 27
Table 2.4. Attempts to purify the BFB 2.5 obtained from the fusion method ... 29
Table 2.5. Attempts to synthesize biguanide 2.8... 31
Table 3.1. The subunit composition of ATP synthase of different species; Escherichia coli (E. coli), Saccharomyces cerevisiae (S. cerevisiae) and Homo sapiens (H. sapiens) ... 49
Table 3.2. Conditions for mass spectrometry ... 56 `
xi List of Abbreviations
ADA American Diabetes Association
ADP Adenosine triphosphate
ACC Acetyl-CoA carboxylase
AF Acid Formic
ATP Adenosine triphosphate
AMP Adenosine monophosphate
AMPK 5-activated protein kinase
A6L protein encoded by mitochondria DNA
Bcl-2 B-cell lymphoma 2
BCA bicinchoninic acid
br Broad (spectral)
BFB Biotin functionalized biguanide
BSA Bovine serum albumin
oC Centigrade
CBP A protein in the human cells
CHREBP Carbohydrate responsive element binding protein
CREB cAMP response element-binding protein
CM Conditioned medium
d Doublet
xii
DMEM Dulbecco’s modified eagle media
2D Two dimension
Da Dalton
DCD Dicyandiamide
DCM Dichloromethane
DMF N,N-dimethylformamide
DMSO-d6 Hexadeuterodimethyl sulfoxide
EDC N-(3-Dimethylaminopropyl)-N′-ethylcarbodiimide
ECL Enhanced chemiluminescence reagent
E. coli Escherichia coli
EASD European Association of study of Diabetes
FAS Fatty acid synthesis
G6P Glucose-6-phosphate
g/mole Gram per mole
h Hour
HK Hexokinases
HER2/neu A type of receptor tyrosine kinase HRMS High-resolution mass spectrometry
H. sapiens Homo sapiens
IR Infrared
IC50 The half maximal inhibitory concentration
IL-6 Interleukin-6
xiii
IL-2 Interleukin-2
IF1 Inhibitor factor 1
IRSI Insulin receptor substrate 1
IGF1 Growth factor 1
J Coupling constant
KD Dissociation constant
KDa Kilo Dalton
KLF15 Kruppel Like Factor 15
LCMS Liquid chromatography mass spectrometry
LM Lauryl maltoside
M-1 Litre per mole
LKB1 liver kinase B1 mM Millimolar mg Milligram min Minutes MHz MegaHertz mmol Millimole ml Millilitre MS Mass spectrometry MW Molecular weight
miRNA Small non coding RNA molecule
NAD Nicotinamide adenine dinucleotide
xiv
NMR Nuclear magnetic resonance
NF-kB Nuclear Facture Kappa Beta
OSCP Oligomycin sensitivity conferring protein
Pi Phosphate
PTEN+/- mice Lung tumor resistance
Prep HPLC Preparative high performance liquid chromatography
ppm Part per million
PBS Phosphate buffer saline
Raptor Regulatory protein of mTOR Rag GTPases GTPases protein, subunit Rag
rpm Revolutions per minute
REDD1 Protein regulated in development and DNA damage Response 1
ROS Reactive oxygen species
S Singlet
S14 Ribosomal protein S14
SDS-PAGE Sodium dodecyl polyacrylamide gel electrophoresis SREBP Sterol regulatory element binding protein
SIRT1 Sirtuin 1
S. cerevisiae Saccharomyces cerevisiae
SHP Small heterodimer partner
SMP Submithocondrial particle
t Triplet
xv
TBSCl Tert-butyldimethylsilyl chloride
TEA Triethylamine
TLC Thin layer chromatography
TILs Tumor-infiltrating lymphocytes
TNFa Tumour necrosis factor a
TSC1 Tuberous sclerosis 1
TMSCl Trimethylsilyl chloride
1
Chapter 1
2 1.1. Metformin
Metformin (N,N-dimethyl biguanide hydrochloride) (Figure 1.1) is known under the commercial name Glucophage and has a half-life of six hours in the body.1 Metformin is representative of the general class of biguanides and is widely used to reduce high blood sugar levels in type 2 diabetic (T2D) patients.1
Figure 1.1. Chemical structure of Metformin
The history of Metformin dates to the use of Galega officinalis Linn (G. officinalis, Figure 1.2) as an herbal medicine in medieval Europe. G. officinalis was used as a medication for the treatment of different diseases such as Plague, Miasma, Dysuria and even to relieve snake bites.2 Metformin was also used to stimulate lactation in cows to increase milk production.3
3
In 1917, guanidine extracted from G. officinalis had shown hypoglycaemic activity in animals, but was too toxic for clinical use.4 Research in this area provided additional observations on the antidiabetic actions of G. officinalis extracts. In 1929, a few synthetic biguanides were prepared, but despite their non-toxic properties in animals, they were not further tested in humans.5
Later in 1957, metformin started to be clinically developed and used in Paris, France and was shown to possess antidiabetic activity in patients with T2D.6 At the same time, an American team reported similar results for phenformin (phenylethyl biguanide).7 One year later, Meherent
et al. report the same antidiabetic properties of buformin (butyl biguanide)8, which opened the door for the usage of phenformin and buformin as antidiabetic drugs. However, despite their interesting antidiabetic properties and potency, many reports showed their association with lactic acidosis, causing their withdrawal from the market in 1970. At that moment, researchers have started to look back at metformin, because it lacked toxicity related to lactic acidosis.9
In 1995, a report from the UK Prospective Diabetes Study demonstrated that metformin controlled the level of glycaemia, reduced cardiovascular-related mortality and increased survival in overweight diabetic type 2 patients.10 In the recent strategies of both the American Diabetes Association (ADA) and the European Association of Study of Diabetes (EASD), metformin was approved as a first choice therapy for T2D.11 In Canada, metformin became available in 1972 and is currently the most prescribed antidiabetic drug.12
1.2. Antidiabetic effect of metformin
Different mechanisms are involved in the reduction of serum glucose levels induced by metformin, but the most obvious result of metformin use is a decrease in hepatic glucose production without hypoglycemia.13,14 Production of glucose requires energy in the form of adenosine triphosphate (ATP). By decreasing the production of ATP in liver cells, metformin
4
reduces hepatic glucose production. In addition to this action on the liver, metformin increases insulin sensitivity, which increases glucose uptake from hepatocytes.15 Other antidiabetic drugs, like sulfonylureas, also reduce blood glucose levels, but they also contribute to elevated levels of insulin, increasing neoplastic growth through the activation of insulin receptors.16 In muscles, metformin increases the tyrosine kinase activity of the insulin receptors and promotes the translocation of glucose transport leading to glucose uptake from muscles.17
Cellular uptake of metformin in the hepatic cells is promoted by the organic cationic transporter (OCT 1). Inhibition of complex I of the mitochondrial respiratory chain has been hypothesized to be the result of metformin action.18 Whether complex I is the main target of metformin or not will be discussed in chapter 3. Complex I may reduce both the gradient of protons across mitochondrial membrane, and ATP synthesis. Inhibition of complex I leads to an increase in the ratios of adenosine mono-phosphates and tri-phosphates (AMP/ATP) or adenosine di-phosphates and tri-di-phosphates (ADP/ATP), which activate the 5-activated protein kinase (AMPK).13a AMPK is a multi-subunit enzyme that is known as a major manager of cell energy and lipid biosynthesis (Figure 1.3).13a
On the other hand, the decrease of ATP itself inhibits fructose-1,6-bisphosphatase, a vital enzyme for gluconeogenesis.19 Metformin activates liver kinase B1 (LKB1)/AMPK signaling which leads to the inhibition of genes coding proteins involved in fatty acid synthesis (FAS), such as ribosomal protein S14 (S14) and acetyl-CoA carboxylase (ACC), by phosphorylation of the transcription factors of carbohydrate responsive element binding protein (ChREBP), hepatocyte nuclear factor 4 (HNF4) and co-activators (Figure 1.3).20
Metformin decreases hepatic lipid synthesis by increasing the fatty acid oxidation and inhibition of lipogenesis through the phosphorylation and consequent inactivation of pivotal
5
enzymes. Metformin blocks translocation of transcriptional co-activator (TorC2) and suppresses the expression of its target genes in hepatocytes. These functions lead to the overall inhibition of glucose production (Figure 1.3).13a
Figure1.3. Molecular mechanisms of the effect of metformin on hepatic gluconeogenesis21
Another mechanism of gluconeogenesis inhibition occurs in the nucleus of the cell, through the suppression of TORC2 and the increase of the activity of hepatic Sirtuin 1 (SIRT1), a NAD+- dependent protein deacetylase.22,23 The increase of the small heterodimer partner (SHP)-mediated AMPK inhibits hepatic gluconeogenesis through the interaction with cAMP response element-binding protein (CREB).24 In addition, metformin quenches the activity of Kruppel Like Factor 15
6
(KLF15) which has an important role in genes coding for gluconeogenesis and amino acid catabolic enzymes (Figure 1.3).25 It is believed that metformin regulates lipogenesis gene expression by decreasing the level of the transcription factor ChREBP and the sterol regulatory element binding protein (SREBP) via AMPK phosphorylation (Figure 1.3).13a, 20b
Recently, it was proven that in addition to glucose metabolism, metformin has other areas of potential therapeutic applications, including cardiovascular diseases and cancer therapy.26 1.3. Metformin and the inhibition of cancer cell growth
The association between cancer and diabetes has been widely investigated from a number of research fields included epidemiological, metabolic, preclinical and clinical.27 T2D generally increases the risk of different types of cancer such as liver, colorectal, pancreas, bladder, kidney, endometrial and breast cancers and non-Hodgkin’s lymphoma,28 but T2D patients treated with metformin showed decreased cancer incidence and mortality.29
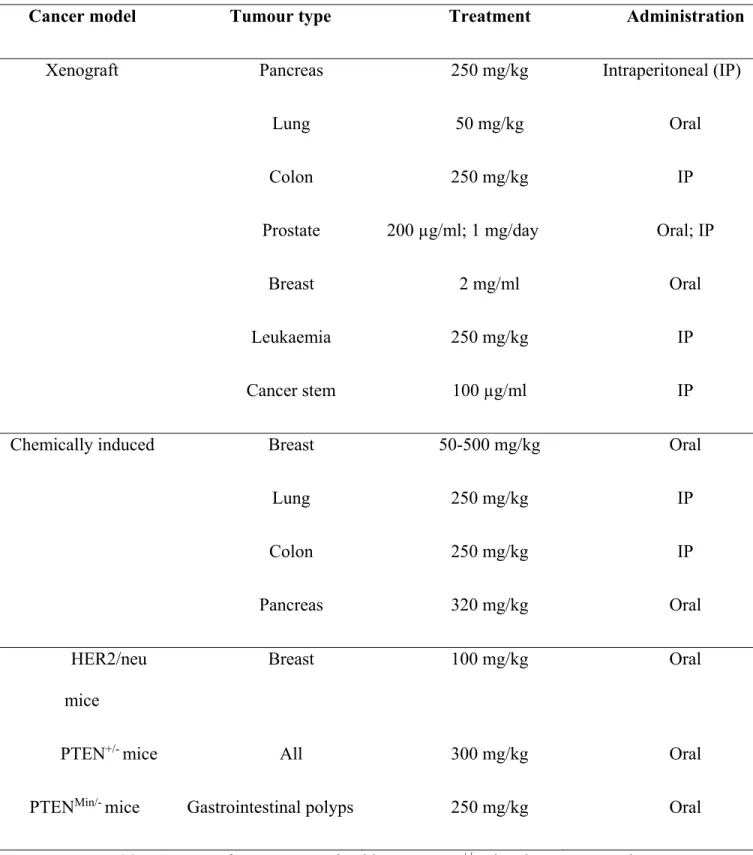
In 2005, the Evans’s laboratory recognized the reduced risk of cancer in diabetic patients receiving metformin with dose-response association.30 In 2009, the same research group confirmed a 63% reduction in the risk of cancer for diabetic patients using metformin.31 In 2009, Li et al. reported a 62% reduction in the risk of pancreatic cancer in diabetic patients taking metformin.32 These results support the use of metformin in cancer treatment. Later in vitro and in vivo studies confirmed the antitumor activity of metformin on different types of cancer cell lines in animal models (Table 1.1).25
7
Table 1.1. Protective effect of metformin in animal models of cancer25
Cancer model Tumour type Treatment Administration
Xenograft Pancreas 250 mg/kg Intraperitoneal (IP)
Lung 50 mg/kg Oral
Colon 250 mg/kg IP
Prostate 200 µg/ml; 1 mg/day Oral; IP
Breast 2 mg/ml Oral
Leukaemia 250 mg/kg IP
Cancer stem 100 µg/ml IP
Chemically induced Breast 50-500 mg/kg Oral
Lung 250 mg/kg IP Colon 250 mg/kg IP Pancreas 320 mg/kg Oral HER2/neu mice Breast 100 mg/kg Oral
PTEN+/- mice All 300 mg/kg Oral
PTENMin/- mice Gastrointestinal polyps 250 mg/kg Oral HER2/neu: a type of receptor tyrosine kinase, PTEN+/- mice: lung tumor resistance
8
Metformin can inhibit cancer cell proliferation by acting both at the macroscopic and cellular state. In the macroscopic state, there are numerous probable explanations for how metformin reduces the risk of cancer in metformin-treated T2D patients. Notably, T2D and cancer show similar risk factors including age, obesity, physical inactivity, diet, alcohol and smoking.28 For example, obesity is consistently associated with the increase of cancer risk.33 Several factors mediate the effects of obesity on cancer, such as sex hormones and inflammatory cytokines.34 Several studies have shown that the higher level of sex hormones, including estrogen and estradiol, in the serum of obese women correlate with cancer growth and metastasis.35 Moreover, in vitro and in vivo studies have shown that obesity raises the cancer risk by increasing inflammatory cytokine levels, including those of interleukin-6 (IL-6) and tumour necrosis factor a (TNFa).36 The increase of cytokine levels leads to chronic inflammation directly associated with cancer growth, through various mechanisms.
Hyperinsulinaemia is another important factor that increases the risk of cancer in T2D patients.37 A condition in which there is an excess of insulin circulating in the blood, hyperinsulinemia that may induce the growth of neoplastic tissues, through several mechanisms, including the activation of insulin-like growth factor 1 receptors (IGF1-Rs), and the disturbance of the level of free circulating hormones and growth factors level in the blood.38 Metformin can inhibit hyperinsulinaemia and consequently may lower the risk of cancer by reducing the hepatic glucose output.39
Metformin may also decrease the risk of cancer in T2D patients by decreasing the production of inflammatory cytokines.40 In the cellular state, the antitumor effect of metformin could be divided in two main categories of AMPK-dependent and AMPK-independent activity.
9 1.4. The AMPK-depended mechanism
Multiple pathways are considered to be involved in the anti-tumor activities of metformin in the cell. Metformin has a direct preventive action on tumour growth through a mechanism involving the activation of the LKB1/AMPK signalling (Figure 1.4).41It can suppress tumor cell growth and proliferation through the inhibition of transcriptional co-activator (mTORC1) signalling. mTORC1 signaling may control cancer cell growth and proliferation in multiple ways, including phosphorylation of tuberous sclerosis 1 (TSC1), tuberous sclerosis 2 (TSC2), and the regulatory protein of mTOR (Raptor).42
Metformin may inhibit tumor cell proliferation by mediating protein p53 expression and phosphorylation by AMPK.43 However, the role of p53 in the activity of metformin as an inhibitor of cancer cell growth is debatable, because studies have confirmed that metformin blocks tumor cell cycle without changes in p53 status.44 Other studies have shown that the inhibitory effect of metformin on cancer cell growth is associated with p53 activity (Figure 1.4).45
Tumor cell growth can also be controlled by modulation of specific small non coding RNAs (miRNAs).46 The activation of miRNAs can act to promote or suppress tumor growth. In addition, metformin can induce the insulin like growth factor (IGF)/insulin signaling through the AMPK-depended phosphorylation of protein insulin receptor substrate 1 (IRSI) (Figure 1.4).47 1.5. The AMPK-independed mechanism
Metformin can inhibit cancer cell proliferation without AMPK activation (Figure 1.4). For example, the Rag subunit guanosine triphosphate hydrolases (Rag GTPases) are specific enzymes regulating mTOR signaling in the cell. Blockage of the Rag GTPases/mTORC1 signaling by metformin leads to the inhibition of cancer cell proliferation (Figure 1.4).48
10
Tumor cells use glucose as a source of energy for fast growth and proliferation. Production of glucose-6-phosphate (G6P), catalysed by hexokinases (HK) I and II, has an important role in glucose metabolism. Metformin inhibits cancer cell proliferation by inhibiting the enzymatic function of HKI and II.49 Metformin could inhibit cancer cell proliferation via the decrease of the cyclin D1 level and through the activation of the proteins regulated in the development and DNA damage Response 1 (REDD1).50 It can also reduce the production of reactive oxygen species (ROS) that leads to a lower oxidative stress and consequently lowers the risk of DNA damage and mutagenesis in normal cells.51 In addition, metformin induces cell apoptosis and autophagy by down regulation of the transcription 3 (Stat3) activity and B-cell lymphoma 2 (Bcl-2) expression (Figure 1.4).52
Figure1.4. Effect of metformin on cancer cells53 1.6. Cellular target of metformin in cancer cells
As previously mentioned, the principal target of metformin in the cell have been thought to be the complex I of the mitochondrial electron transport respiratory chain.54 Complex I (NADH:
11
ubiquinone oxidoreductase) is one of the five complexes present in the inner membrane of mitochondria and has a vital role for respiration and oxidative phosphorylation in mitochondria. Complex I uses electrons from the oxidization of NADH to NAD+ to reduce ubiquinone to ubiquinol. The NADH ubiquinone redox reaction releases energy that is used to create an electrochemical gradient across the mitochondrial inner membrane. This leads to the synthesis of ATP by complex V (ATP synthase). In addition, complex I is the main source of ROS in mitochondria.55
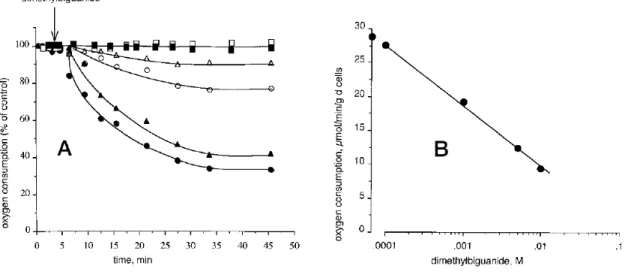
In 2000, two independent groups, El-mir and Owen, both mentioned complex I as the possible target of metformin in the cell.18, 56 El-mir et al. examined the effect of metformin on isolated rat hepatocytes, permeabilized hepatocytes and isolated liver mitochondria,56 and showed that at high concentrations (10±1 mM), metformin decreased oxygen consumption and mitochondrial membrane potential in intact cells (Figure 1.5).
12
Figure 1.5. Effect of metformin on oxygen uptake in intact isolated hepatocytes, permeabilized
hepatocytes and isolated liver mitochondria.56
Panel A: filled circles, 10 mM; filled triangles, 5 mM; open circles, 1 mM; open triangles, 0.1 mM; permeabilized hepatocytes (open squares) or isolated mitochondria (filled squares), 2 mg of protein/ml. Panel B shows dose dependence of hepatocyte oxygen consumption rate after 30 min of incubation.
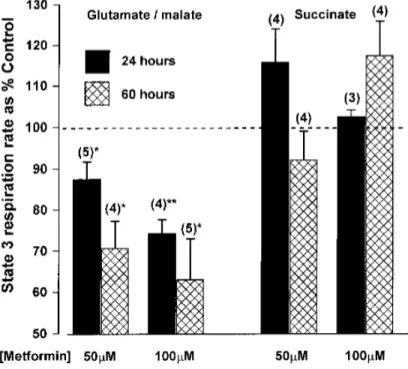
Inhibition of complex I by metformin was claimed not to occur through a direct interaction with the respiratory chain, because no effect was observed on isolated mitochondria. An indirect effect of metformin on the respiratory chain complex I was proposed an undefined signaling pathway. On the other hand, Owen et al. provided evidence that metformin affected directly complex I,18 by showing that reduced oxidation of glutamate and malate inhibited hepatoma cell growth by 13 and 30% after 24 and 60 h, respectively (Figure 1.6).
13
Figure 1.6. Inhibition of mitochondrial respiration by metformin in permeabilized rat hepatoma cells.18
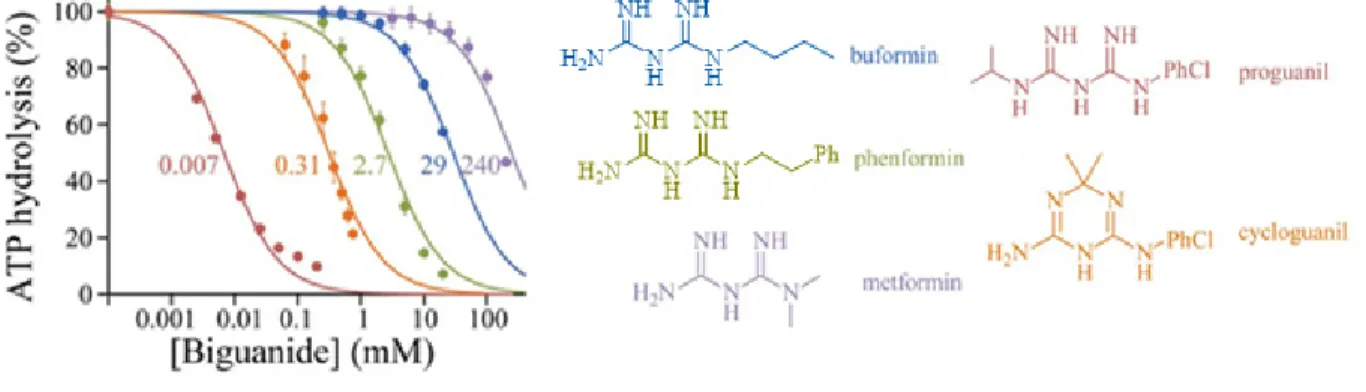
Recently, the effect of different biguanides on purified complex I has been investigated by Bridges et al.57 They demonstrated that high concentrations (in the millimolar range) of metformin can indirectly inhibit complex I activity by inhibiting ubiquinone reduction and independently, reactive oxygen species production. They also showed that metformin inhibited the mitochondrial ATP synthase activity.
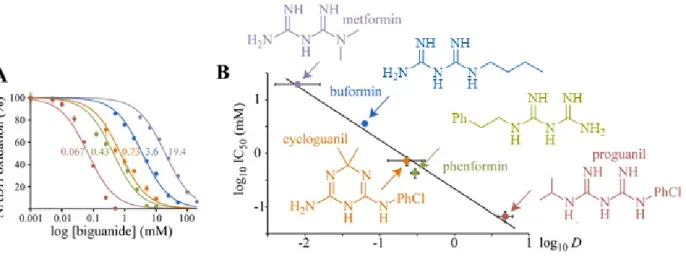
1.6.1. Effect of metformin and other biguanides on isolated complex I
Bridge et al. studied the effect of five pharmacologically relevant biguanides on the oxidative phosphorylation in mammalian mitochondria. All five biguanides inhibited complex I and the more hydrophobic biguanides were more effective inhibitors (Figure 1.7 A and B).57 However, a high concentration of metformin (19.4 ± 1.4 mM) was required to inhibit the NADH:
14
decylubiquinone oxidoreduction, showing that metformin is a weak inhibitor of isolated complex I.
Figure 1.7. Effects of biguanides on isolated bovine complex I.57
(A) Dependence of NADH oxidation on biguanide concentration, relative to a biguanide-free control. Colours are as in (B), and the half maximal inhibitory concentration (IC50) values (in mM) are noted. (B) Relationship between the inhibition (IC50) and octanol:PBS partition coefficient (D) of the biguanides.
In order to understand how biguanides can bind to the complex I, the effect of biguanides at different stages of NADH oxidoreduction were studied: NADH oxidation through the flavin mononucleotide, ubiquinone reduction and intramolecular electron transfer across the inner membrane.55 By several experiments, the authors demonstrated that biguanides do not inhibit complex I by inhibiting NADH oxidation nor by blocking intramolecular electron transfer chain. Instead, metformin’s rate-determining inhibition step was mechanistically related to ubiquinone reduction.
15
1.6.2. Effect of metformin and other biguanides on complex V
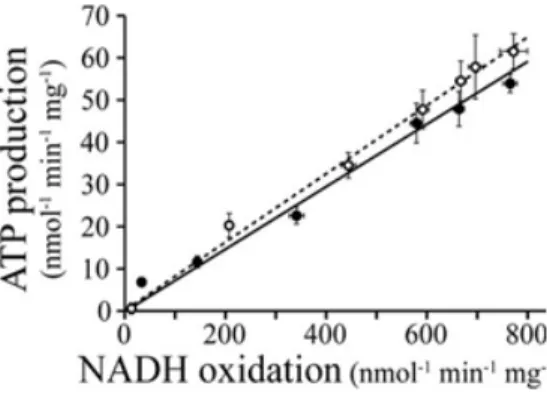
The effects of biguanides on complex V (F1F0-ATPase) were monitored following ATP hydrolysis and ATP synthesis. Formation of ADP (obtained from ATP hydrolysis) in submitocondrial particles (SMPs) was affected by metformin. All five biguanides inhibited ATP hydrolysis with similar efficiency correlating with hydrophobicity (Figure 1.8).57
Figure 1.8. Effect on biguanides on the inhibition of ATP hydrolysis57
The inhibition of NADH-driven ATP synthesis induced by metformin has also been compared with that of piericidin, a strong complex I inhibitor (Figure 1.9).57 The results were almost the same, indicating that the inhibition of ATP synthesis is a consequence of the inhibition of complex I. Biguanides were proposed to inhibit complex I at two different sites: one disturbing the reactivity of the flavin and the other inhibiting the catalytic site.
16
Figure 1.9. Relative inhibition of ATP production in SMPs in the presence of piericidin (open
circles) and metformin (filled circles).57
Although the target of metformin has been claimed to be complex I, the activity of complex I has only been studied indirectly in the presence of metformin. Taking together the results presented above, we decided to identify the putative target of metformin.
1.7. Our objectives
We hypothesized that metformin could have interact directly with one or several proteins in the mitochondria leading to inhibition of the cancer cell proliferation. Therefore, we conjugated metformin to biotin to probe for potential mitochondrial proteins that bound metformin. The biotin-(strept)avidin system has been well exploited for protein and nucleic acid detection and purification. Biotin may be conjugated to metformin and the resulting conjugate used for affinity chromatography to isolate proteins for identifying by mass spectrometry (MS). Iidentification of the exact protein or proteins responsible for binding to metformin should help to better understand its mechanism of action and may open the door for structural changes that would provide more potent inhibitor.
17 1.8. References
1. Shaw, R. J.; Lamia, K. A.; Vasquez, D.; Koo, S.-H.; Bardeesy, N.; DePinho, R. A.; Montminy, M.; Cantley, L. C., Science. 2005, 310, 1642-1646.
2. Bailey, C. J.; Day, C., Practical Diabetes 2004, 21, 115-117.
3. Mori, A.; Cohen, B. D.; Lowenthal, A. Japan Guanidino Compounds Research Association Meeting. Guanidines: Historical, biological, biochemical, and clinical aspects of the naturally occurring guanidino compounds; Plenum Press; New York, 1985.
4. Watanabe, C., J. Biol. Chem. 1918, 33, 253.
5. Hesse, E.; Taubmann, G., Naunyn Schmiedebergs Arch. Exp. Pathol. Pharmakol. 1929, 142, 290-308.
6. Sterne, J., Maroc Med. 1957, 36, 1295-1296.
7. Ungar, G.; Freedman, L.; Shapiro, S. L., Exp. Biol. Med. 1957, 95, 190-192. 8. Mehnert, H.; Seitz, W., Munch Med Wschr. 1958, 100, 1851-1856.
9. Schäfer, G., Diabetes Metab. 1982, 9, 148-163. 10. Group, U. P. D. S., Lancet. 1998, 352, 854-865.
11. (a )Adler, A. I.; Shaw, E. J.; Stokes, T.; Ruiz, F., Brith. Med. J. 2009, 338; (b )Nathan, D. M.; Buse, J. B.; Davidson, M. B.; Ferrannini, E.; Holman, R. R.; Sherwin, R.; Zinman, B., Clin Diabetes. 2009, 27, 4-16.
18
13. (a )Zhou, G.; Myers, R.; Li, Y.; Chen, Y.; Shen, X.; Fenyk-Melody, J.; Wu, M.; Ventre, J.; Doebber, T.; Fujii, N., J. Clin. Invest. 2001, 108, 1167-1174; (b)Krentz, A. J.; Bailey, C. J., Drugs. 2010, 65, 385-411.
14. Kirpichnikov, D.; McFarlane, S. I.; Sowers, J. R., Ann. Intern. Med. 2002, 137, 25-33. 15. Gunton, J. E.; Delhanty, P. J.; Takahashi, S.-I.; Baxter, R. C., J. Clin. Endocrinol. Metab. 2003, 88, 1323-1332.
16. Pollak, M., Nat. Rev. Cancer. 2008, 8, 915-928.
17. Fischer, Y.; Thomas, J.; Rösen, P.; Kammermeier, H., Endocrinology. 1995, 136, 412-420. 18. DORAN, E.; HALESTRAP, A. P., Biochem. J. 2000, 348, 607-614.
19. Miller, R. A.; Birnbaum, M. J., J. Clin. Invest. 2010, 120, 2267-2270.
20. (a )Foretz, M.; Ancellin, N.; Andreelli, F.; Saintillan, Y.; Grondin, P.; Kahn, A.; Thorens, B.; Vaulont, S.; Viollet, B., Diabetes. 2005, 54, 1331-1339; (b )Kawaguchi, T.; Osatomi, K.; Yamashita, H.; Kabashima, T.; Uyeda, K., J. Biol. Chem. 2002, 277, 3829-3835; (c )Leclerc, I.; Lenzner, C.; Gourdon, L.; Vaulont, S.; Kahn, A.; Viollet, B., Diabetes. 2001, 50, 1515-1521. 21. Buler, M.; Aatsinki, S.-M.; Izzi, V.; Hakkola, J., PLoS One. 2012, 7, e49863.
22. Caton, P. W.; Nayuni, N. K.; Kieswich, J.; Khan, N. Q.; Yaqoob, M. M.; Corder, R., J. Endocrinol. 2010, 205, 97-106.
23. Koob, G. F.; Bloom, F. E., Sci. 1988, 715-723.
24. He, L.; Sabet, A.; Djedjos, S.; Miller, R.; Sun, X.; Hussain, M. A.; Radovick, S.; Wondisford, F. E., Cell. 2009, 137, 635-646.
19
25. Viollet, B.; Guigas, B.; Garcia, N. S.; Leclerc, J.; Foretz, M.; Andreelli, F., Clin. Sci. 2012, 122, 253-270.
26. Malek, M.; Aghili, R.; Emami, Z.; Khamseh, M. E., ISRN Endocrinol. 2013, 636927. 27. Arcidiacono, B.; Iiritano, S.; Nocera, A.; Possidente, K.; Nevolo, M. T.; Ventura, V.; Foti, D.; Chiefari, E.; Brunetti, A., Experimental Diabetes Research. 2012, 789174.
28. Vigneri, P.; Frasca, F.; Sciacca, L.; Pandini, G.; Vigneri, R., Endocr. Relat. Cancer. 2009, 16, 1103-1123.
29. Rizos, C. V.; Elisaf, M. S., Eur. J. Pharmacol. 2013, 705, 96-108.
30. Evans, J. M.; Donnelly, L. A.; Emslie-Smith, A. M.; Alessi, D. R.; Morris, A. D., Brith. Med. J. 2005, 330, 1304-1305.
31. Libby, G.; Donnelly, L. A.; Donnan, P. T.; Alessi, D. R.; Morris, A. D.; Evans, J. M., Diabetes Care. 2009, 32, 1620-1625.
32. Li, D.; Yeung, S. C. J.; Hassan, M. M.; Konopleva, M.; Abbruzzese, J. L., Gastroenterology. 2009, 137, 482-488.
33. Calle, E. E.; Rodriguez, C.; Walker-Thurmond, K.; Thun, M. J., N. Engl. J. Med. 2003, 348, 1625-1638.
34. Davoodi, S. H.; Malek-Shahabi, T.; Malekshahi-Moghadam, A.; Shahbazi, R.; Esmaeili, S., Iran. J. Cancer. Prev. 2013, 6, 186-190.
35. Bracci, P. M., Mol. Carcinog. 2012, 51, 53-63. 36. Fain, J. N., Vitam. Horm. 2006, 74, 443-477.
20
37. Giovannucci, E.; Harlan, D. M.; Archer, M. C.; Bergenstal, R. M.; Gapstur, S. M.; Habel, L. A.; Pollak, M.; Regensteiner, J. G.; Yee, D., CA: Cancer. J. Clin. 2010, 60, 207-221.
38. Wilcox, G., Clin. Biochem. Rev. 2005, 26, 19-39.
39. Pernicova, I.; Korbonits, M., Nat. Rev. Endocrinol. 2014, 10, 143-156.
40. Moiseeva, O.; Deschênes‐Simard, X.; St‐Germain, E.; Igelmann, S.; Huot, G.; Cadar, A. E.; Bourdeau, V.; Pollak, M. N.; Ferbeyre, G., Aging Cell. 2013, 12, 489-498.
41. Shackelford, D. B.; Shaw, R. J., Nat. Rev. Cancer. 2009, 9, 563-575.
42. (a )Gwinn, D. M.; Shackelford, D. B.; Egan, D. F.; Mihaylova, M. M.; Mery, A.; Vasquez, D. S.; Turk, B. E.; Shaw, R. J., Mol. Cell. 2008, 30, 214-226; (b )Inoki, K.; Zhu, T.; Guan, K.-L., Cell. 2003, 115, 577-590.
43. Jones, R. G.; Plas, D. R.; Kubek, S.; Buzzai, M.; Mu, J.; Xu, Y.; Birnbaum, M. J.; Thompson, C. B., Mol. Cell. 2005, 18, 283-293.
44. (a )Sahra, I. B.; Laurent, K.; Giuliano, S.; Larbret, F.; Ponzio, G.; Gounon, P.; Le Marchand-Brustel, Y.; Giorgetti-Peraldi, S.; Cormont, M.; Bertolotto, C., Cancer. Res. 2010, 70, 2465-2475; (b )Hadad, S.; Hardie, D.; Appleyard, V.; Thompson, A., Clin. Transl. Oncol. 2014, 16, 746-752.
45. (a )Nelson, L. E.; Valentine, R. J.; Cacicedo, J. M.; Gauthier, M.-S.; Ido, Y.; Ruderman, N. B., Am. J. Physiol. Cell. Physiol. 2012, 303, C4-C13; (b) Malki, A.; Youssef, A., Oncol. Res. 2011, 19, 275-285.
46. Pulito, C.; Donzelli, S.; Muti, P.; Puzzo, L.; Strano, S.; Blandino, G., Ann. Transl. Med. 2014, 2, 18-34.
21
47. Ning, J.; Clemmons, D. R., Mol. Endocrinol. 2010, 24, 1218-1229.
48. Kalender, A.; Selvaraj, A.; Kim, S. Y.; Gulati, P.; Brûlé, S.; Viollet, B.; Kemp, B. E.; Bardeesy, N.; Dennis, P.; Schlager, J. J., Cell Metab. 2010, 11, 390-401.
49. Salani, B.; Marini, C.; Rio, A. D.; Ravera, S.; Massollo, M.; Orengo, A. M.; Amaro, A.; Passalacqua, M.; Maffioli, S.; Pfeffer, U., Sci. Rep. 2013, 3, 2070-2087.
50. Sahra, I. B.; Laurent, K.; Loubat, A.; Giorgetti-Peraldi, S.; Colosetti, P.; Auberger, P.; Tanti, J.-F.; Le Marchand-Brustel, Y.; Bost, F., Oncogene. 2008, 27, 3576-3586.
51. Algire, C.; Moiseeva, O.; Deschênes-Simard, X.; Amrein, L.; Petruccelli, L.; Birman, E.; Viollet, B.; Ferbeyre, G.; Pollak, M. N., Cancer Prev. Res. 2012, 5, 536-543.
52. Feng, Y.; Ke, C.; Tang, Q.; Dong, H.; Zheng, X.; Lin, W.; Ke, J.; Huang, J.; Yeung, S.-C.; Zhang, H., Cell Death Dis. 2014, 5, e1088.
53. Christodoulou, M. I.; Scorilas, A, Curr. Med. Chem. 2017, 24, 14-56.
54. Detaille, D.; Guigas, B.; Leverve, X.; Wiernsperger, N.; Devos, P., Biochem. Pharmacol. 2002, 63, 1259-1272.
55. Hirst, J., Annu. Rev. Biochem. 2013, 82, 551-575.
56. El-Mir, M.-Y.; Nogueira, V.; Fontaine, E.; Avéret, N.; Rigoulet, M.; Leverve, X., J. Biol. Chem. 2000, 275, 223-228.
22
Chapter 2
23 2.1. Introduction
There are several strategies that have been used to identify proteins targets of small molecules.1 The most well-known and widely used method employs biochemical isolation by affinity chromatography, in which an analogue of the small molecule is covalently attached to biotin. The biotinylated version of the compound may bind to strept(avidin)-agarose beads.2 As outlined in chapter 1, we hypothesized that a biotinylated biguanide (BFB), a metformin analog, can be used to identify proteins exhibiting binding affinity for metformin in a mitochondrial lysate.
In this chapter, we present different strategies envisioned for the synthesis of a biotin-conjugated biguanide and an ammonium salt control (Scheme 2.1) for the evaluation of non-specific binding in the affinity chromatography assays.
Scheme 2.1. Structures of the designed biotin-functionalized ammonium salt and biotinylated
24 2.2. Results and discussion
The designed biotin-conjugated biguanide contains three major parts: the biotin unit that strongly binds to the (strept)avidin,3 the biguanide group to be recognized by proteins with binding affinity for metformin and an appropriate linker.
2.2.1. Synthetic protocol A
The first strategy that we envisioned for the synthesis of a biotin conjugated biguanide was based on the most common way to synthesize substituted biguanides, the reaction of dicyandiamide
(DCD) with a primary ammonium salt. This method (Scheme 2.2) starts with the acylation of amine
2.1 with biotin-NHS 2.2. After removal of the Boc group, the biguanide was proposed in the last
25 S NH HN O H H O O N O O N H O O OH S NH HN O H H S NH HN O H H O O H N H2N NH2 H2N O O O O O H N Boc N H O S NH HN O H H NH3 N H O S NH HN O H H H N HN NH2 NH NH NHS, EDC DMF 2.1 TEA, DMF 1. Et2O.HCl MeOH 1. DCD 2.4 2.3 2.5 2.1 Cl TEA, MeOH 65% 67% 70% 100% various attempts 2.2
Scheme 2.2. Proposed synthetic protocol A
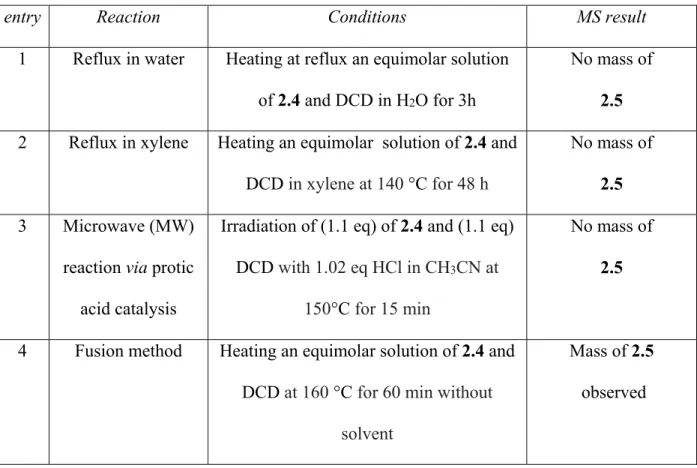
First, we have successfully synthesised amine 2.1 by the reaction of the di-tert-butyl dicarbonate with an excess of the 1,6-diaminohexane in 10% TEA:MeOH.4 In the next step, we employed NHS and EDC to activate biotin.5 Biotin-NHS reacted with the primary amine group of 2.1 to form amide 2.3. Hydrochloride salt 2.4 was obtained by deprotection of the Boc group from 2.3. The final step entailed reaction of DCD and 2.4. Unfortunately, various conditions (presented Table 2.1) were tried, but they did not provide 2.5. Under fusion conditions, a trace of biotinylated biguanide 2.5 was observed, along with many by-products.
26
Table 2.1. Attempts to synthesize BFB 2.5 using method type A
entry Reaction Conditions MS result
1 Reflux in water Heating at reflux an equimolar solution of 2.4 and DCD in H2O for 3h
No mass of 2.5 2 Reflux in xylene Heating an equimolar solution of 2.4 and
DCD in xylene at 140 °C for 48 h
No mass of 2.5 3 Microwave (MW)
reaction via protic acid catalysis
Irradiation of (1.1 eq) of 2.4 and (1.1 eq) DCD with 1.02 eq HCl in CH3CN at
150°C for 15 min
No mass of 2.5
4 Fusion method Heating an equimolar solution of 2.4 and DCD at 160 °C for 60 min without
solvent
Mass of 2.5 observed
The fusion method for the synthesis of biguanide was reported in 1892 by Bamberger and Dieckmann.6 Commonly, the reaction is conducted between equimolar amounts of the primary
amine hydrochloride salt and dicyandiamide at a very high temperature (160-180 °C) without solvent. The mixture of the dicyandiamide (42 mg, 0.5 mmoles) and hydrochloride salt 2.4 (188 mg, 0.5 mmoles) was heated up to 160 °C for 60 min. The melted reaction mixture solidified and cooling to room temperature. The desired mass of compound 2.5 was observed in a complex mixture of by-products. Different chromatography methods and preparative LC-MS methods were tried, but compound 2.5 was never obtained in sufficient purity.
The LC-MS analysis of the crude product indicated a low yield of 2.5 contaminated with starting material 2.4 which had a similar retention time. Therefore, we decided to optimize the
27
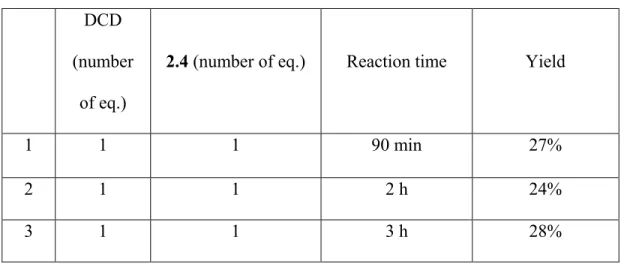
yield of this step by increasing the reaction time (Table 2.2), as well as by varying the ratio of the starting materials (Table 2.3).
Table 2.2. Effect of the reaction time on the formation of 2.5
DCD (number
of eq.)
2.4 (number of eq.) Reaction time Yield
1 1 1 90 min 27%
2 1 1 2 h 24%
3 1 1 3 h 28%
Table 2.3. Effect of the ratio of the DCD on the yield of 2.5
DCD (number
of eq.)
2.4 (number of eq.)
Reaction time Yield of 2.5 based on LCMS analysis
1 3 1 90 min 34%
2 6 1 90 min 36%
3 8 1 90 min 50%
Increasing the reaction time did not change the yield of the reaction. Increasing the number of equivalents of DCD increased the yield of 2.5 with less by-products (Figure 2.1). Starting molecule 2.4 was not completely consumed in the reaction, even when 8 equivalents of DCD were used. The content of 2.5 was estimated in the crude reaction mixture by LCMS (Acq method, LC_20_95_15min_ACN, column, polar RP 30X2.00mm, tr2.5 = 6 min, tr2.4 = 5.4 min).
28
Figure 2.1. Screening the LCMS of the crude sample, obtained from the fusion method by
increasing the ratio of DCD
Different separation methods were employed to purify 2.5 (Table 2.4), however, none gave 2.5 with an acceptable purity. Instead of spending additional time trying to improve the purification, we decided to modify our synthetic strategy.
29
Table 2.4. Attempts to purify the BFB 2.5 obtained from the fusion method
Purification method
Condition
1 Extraction EtOAc/H2O (1:1)
2 Silica column From 2 % to 20% of MeOH in DCM 3 Silica preparative
plate 20%MeOH, 79%DCM, and 1% NH4OH 4 Reverse column
(C18)(cartridge) From 100% to 20 % of H2O in ACN
2.2.2. Synthetic protocol B
Following our fruitless results with the previous method, a new synthetic strategy was envisaged for the synthesis of 2.5 (Scheme 2.3). The method starts with the synthesis of a biguanide-functionalized linker 2.8, for conjugated with biotin-NHS in an esterification reaction. One advantage of this method compared to the previous one is its lower cost, because biotin, the most expensive material, is used in the last step of the procedure. In addition, this route has one step less than the previous one. Unfortunately, this procedure was also abandoned because we were not able to properly purify biguanide 2.8.
30
Scheme 2.3. Proposed synthetic method B
In the first step of this synthesis, commercial aminohexanol and tert-butyldimethylsilyl chloride were reacted in equimolar amounts using imidazole in DMF.7 For the formation of the biguanide, several methods were tried (Table 2.5). Based on LC-MS analysis, too many by-products and very low yields were obtained.
31
Table 2.5. Attempts to synthesize biguanide 2.8
Reaction method Conditions Results
1 Fusion method Heating an equimolar (1 eq) of 2.7 and DCD at 160 °C for 60 min without
solvent
Not successful
2 MW Irradiation via HCl catalysis
MW irradiation of an equimolar (1.1 eq) of 2.7 and DCD with 1.02 eq of HCl in CH3CN at 150 °C for 15 min Not successful 3 MW Irradiation via TMSCl catalysis
MW irradiation of an equimolar (1.1 eq) of 2.7 and DCD with 1.02 eq of TMSCl
in CH3CN at 150 °C for 15 min
Not successful
4 Reflux, with FeCl3 catalyst
Heating at reflux an equimolar (1 eq) of 2.7, DCD (1 eq) and FeCl3 (1 eq) in
dioxane for 90 min
Followed by adding 3 eq. of HCl conc.
Expected mass of the 2.8 observed
In 1898, Suyama reported an effective method for the preparation of substituted biguanides in the presence of FeCl3 or ZnCl2 under mild conditions (Scheme 2.4).8
32
Scheme 2.4. Synthesis of biguanide compounds using FeCl3 as catalysis8
A 1:1:1 mixture of 2.7 (217 mg, 1mmol): DCD (84 mg, 1mmol) and FeCl3 (162 mg, 1mmol) in dioxane was maintained under reflux for 90 min. Then the reaction was cooled to room temperature and 3 eq. of concentrated HCl were added to precipitate the biguanide salt. Addition of HCl resulted in the formation of an oily suspension of 2.8 containing many other by-products. A different molar ratio (1:1:3) was examined in DCM and THF, but also failed to give product 2.8. At this point, we decided, one more time to change the synthetic strategy.
2.2.3. Synthetic protocol C
The successful synthesis of 2.5 was accomplished in five steps using the synthetic route presented in Scheme 2.5, featuring a combination of the two methods presented before.
33
34
Synthesis of 2.1 and biotin-NHS 2.2 have been previously described.4-5 The functionalization of the linker 2.1 with DCD was realized using FeCl3 as catalyst. A semisolid precipitate was obtained using an equimolar reaction mixture of amine 2.1 (109 mg, 0.5 mmol), dicyandiamide (42 mg, 0.5 mmol) and FeCl3 (81 mg, 0.5mmol) in THF. The quench of the reaction was done through the addition of 3 equiv. of HCl conc., followed by the addition of a dry solution of HClEt2O (2 M).
In the last step, functionalized biguanide 2.6 and biotin-NHS 2.2 are coupled via an amide bond. The reaction was conducted by adding the base (TEA) to the solution of the reactants in DMF. This reaction was best performed on a 0.5 mmol scale. We investigated the potential application of this method in a larger scale, but the product was cleaner on the smaller scale.
2.3. Purification of 2.5 by preparative HPLC
Conjugate 2.5 from the latter synthetic procedure was purified by preparative HPLC. The pairs of large and small Luna 5 PFP(2) 100Å analytical columns, water pumps model 2998 and 3100 mass detector were employed. First, a method was developed using an analytical column (LC_0_95_15min_ACN, column Luna 5 PFP(2) 100A, 160x3.0 mm, trBFB = 13.08 min). Then a preparative LC-MS protocol was used to purify 50 mg of 2.5, which was dissolved in 2 ml of MeOH and passed through the filter to obtain an homogeneous solution. In each injection, 100 µl are eluted through the column (LC_0_95_15min_ACN, column Luna 5 PFP(2) 100Å, 150x21.20 mm). Biotin-conjugated biguanide 2.5 was detected and collected between 17 and 19 min. After 20 injections, the collected fractions were combined and concentrated to give the pure final product as a white solid.
35 2.4. Experimental
All organic compounds were purchased from Aldrich Chemicals and Oakwood Chemical in their highest available purity and were used without further purification. Analytical and HPLC-grade solvents for workup and purification procedures, and HPLC analysis were purchased from commercial suppliers and used as received. Anhydrous solvents were obtained by filtration through drying columns with a Glass Contour system (Irvine, CA). Silica gel chromatography was performed by using 230–400 mesh silica gel (Silicycle). The particle size of the aluminum oxide was between 70-290 mesh. 1H NMR and 13C NMR spectra were recorded with a Bruker spectrometer at 400 or 500 MHz. Coupling constant J values were measured in Hertz (Hz) and chemical shift values in parts per million (ppm).1H NMR spectra were recorded in MeOD (3.31, 4.78 ppm) or DMSO-d6 (2.50 ppm). 13C NMR spectra were recorded in MeOD (49.15 ppm) or DMSO-d6 (39.52 ppm). Centrifugation was performed with an Eppendorf 5804 instrument. Exact mass measurements were performed on a LC-MSD instrument in electrospray ionization (ESI-pos) mode at the Centre régional de spectrométrie de masse de l’Université de Montréal.
2.4.1. 6-(tert-Butoxycarbonylamino)hexylamine (2.1)
A solution of di-tert-butyl dicarbonate (7.27 g, 0.033 moles) in MeOH (20ml) was added to a solution of 1, 6-diaminohexane (11.6 g, 0.1 moles) in 10% TEA:MeOH (100 mL). The mixture was heated at reflux for 2 h and stirred at room temperature overnight. The reaction was monitored by TLC (4% NH4OH/MeOH). The volatiles were removed in vacuo. The residue was dissolved in CH2Cl2 and washed with a solution of 10% aqueous Na2CO3, dried over anhydrous sodium sulfate, filtered and concentrated under reduced pressure. The oily residue was purified by column
36
chromatography on silica gel (1:10:89 NH4OH:MeOH:CHCl3) to give 6-(tert-butoxycarbonylamino)hexylamine 2.1 as light yellow oil.
MS (ESI-pos) m/z: Calcd for C11H25N2O2+[M+H]+: 217.1871, Found. 217.1940; LC-MS purity >99.5(Acq method, LC_20_95_15min_MeOH, column, Atlantis C18 3.9x100mm, 3µm, tr= 6.54min). 1H NMR (500 MHz, MeOD) δ: 3.04 (t, 2H, J = 8.7 Hz), 2.66 (t, 2H, J = 9 Hz), 1.49 (m, 4H), 1.45 (s, 9H), 1.36 (m, 4H). 13C NMR (500 MHz, MeOD) δ 157.1, 78.3, 40.9, 39.8, 31.96, 29.50, 27.37, 26.23, 26.20. 2.4.2. (2,5-Dioxopyrrolidin-1-yl-5-((3aS,4S,6aR)-2-oxohexahydro-1H-thieno[3,4-d]imidazol-4-yl)pentanoate (2.2)
Biotin (244 mg, 1 mmoles), EDC (228 mg, 1.195 mmoles) and NHS (137 mg, 1.195 mmoles) were dissolved in DMF (50 mL) in a 100 mL round-bottomed flask equipped with a magnetic stirrer. The reaction mixture was stirred overnight at room temperature. The volatiles were removed in vacuo and the residue were triturated with EtOH:AcOH:H2O (95:1:4). The biotin-NHS 2.2 (230 mg, 67% yield) was obtained as a white solid that was used in the next step without further purification.
37 1H NMR (400 MHz, DMSO) δ: 6.41 (s, 1H), 6.36 (s, 1H), 4.33-4.29 (m, 1H), 4.14-4.17 (m, 1H), 3.09-3.12 (m, 1H), 2.83-2.86 (m, 3H), 2.67 (t, 2H, J = 7.2 Hz), 2.58 (d, 1H, J = 12.4), 1.55-1.67 (m, 4H), 1.42-1.46 (m, 4H). 13C NMR (400 MHz, DMSO) δ 170.7, 169.3, 163.1, 61.4, 59.6, 55.6, 36.24, 30.4, 28.2, 28.0, 25.8, 24.7. 2.4.3. 6-((((Amino(iminio)methyl)amino)(iminio)methyl)amino)hexan-1-aminium (2.6)
A mixture of amine 2.1 (109 mg, 0.5 mmoles), dicyandiamide (42 mg, 0.5 mmoles) and FeCl3 (81 mg, 0.5 mmoles) was heated at reflux in THF (5ml) for 90 min, The reaction was cooled to room temperature and treated with 3 equivalents of concentrated HCl to form a precipitate that was filtered and washed 3 times with THF. The solid was dissolved in 2 ml of MeOH, treated with 6 ml of a dry solution of 2 mM HCl in Et2O, and stirred at room temperature for 2 h. The volatiles were removed in vacuo. The residue was partitioned between EtOAc and H2O (1:1). The aqueous phase was separated and freeze-dried to give yellow solid.
MS (ESI+) m/z: Calcd for C8H21N6+ [M+H] +: 201.18, Found 201.21.
1H NMR (500 MHz, MeOD) δ 3.37 (s, 2H), 2.96 (s, 2H), 1.73 (s, 4H), 1.49 (s, 4H). 13C NMR (125 MHz, MeOD) δ 155.1, 152.5, 42.7, 39.2, 27.0, 25.8, 25.7, 25.6.
38
2.4.4. Amino((iminio((6-(5-((3aS,4S,6aR)-2-oxohexahydro-1H-thieno[3,4-d]imidazol-4-yl) pentanamido)hexyl)amino)methyl)amino)methaniminium (2.5)
A solution containing 2.4 (378 mg, 1 mmole) and DCD (84 mg, 1mmole) were dissolved in DMF (10 ml), and treated with triethyl amine (0.14 ml, 1.4 mmoles). The resulting mixture was stirred overnight under N2. After removal of the volatiles in vacuo, the solid was washed three times with 3x5 ml acetone. The solid was purified by flash column chromatography on neutral aluminum oxide (DCM:MeOH, from 2% to 15% MeOH, followed by H2O wash). The total volume of H2O was reduced to 1-2 ml. Precipitation from the aqueous phase with an excess of acetone gave 2.5 white needles (245 mg, 0.5 mmol, 50 %). The needles were isolated by centrifugation (10 min, speed 4230 rpm or 1000 rcf) and freeze-dried.
MS (ESI+) m/z: Calcd for C18H35N8O2S+ [M+H]+: 427.26, Found 427.2.
LC-MS purity >99.5(Acq method, LC_0_95_22min_ACN, column Luna 5µ PFP(2) 150x3.00mm, 100 Å, tr = 11.14 min).
1H NMR (500 MHz, MeOD) δ 4.53-4.50 (m, 1H), 4.34-4.31 (m, 1H), 3.23-3.18 (m, 5H), 2.95 (dd, 1H, J = 13 Hz, J = 5 Hz), 2.73 (d, 1H, J = 13 Hz), 2.22 (t, 2H, J = 7.2 Hz), 1.46-1.79 (m, 14H); 13C NMR (500 MHz, MeOD) δ 174.7, 164.7, 159.5, 62.0, 60.2, 55.6, 41.1, 39.7, 38.7, 35.4, 28.9, 28.4, 28.1, 26.1, 26.0, 25.6.
39
2.4.5. tert-Butyl(6-(5-((3aS,4S,6aR)-2-oxohexahydro-1H-thieno[3,4-d]imidazol-4-yl)pentan amido)hexyl)carbamate (2.3)
Biotin-NHS (2.2, 341 mg, 1 mmoles) and 6-(tert-butoxycarbonylamino)hexylamine (2.1, 218 mg, 1 mmol) were dissolved in DMF (50 mL) and stirred for 24 h at room temperature. After disappearance of the starting materials and appearance of a new product on the TLC plate was observed. The volatiles were removed under reduced pressure and the residue was purified by silica gel column chromatography (0 to 8% MeOH in CH2Cl2) to give 2.3 as a white solid (310 mg, 0.7 mmol, 70%).
MS (ESI+) m/z: Calcd for C21H39N4O4S+ [M+H]+: 443.2614; Found 443.2714.
LC-MS purity >99.5(Acq method, LC_40_95_10min_MeOH, column, XSelect C18 4.6x100mm, tr = 10.087min). 1H NMR (500 MHz, MeOD) δ 4.52-4.50 (m, 1H), 4.33-4.31 (m, 1H), 3.20-3.24 (m, 1H), 3.16-3.19 (m, 2H), 3.04 (t, 2H, J = 7 Hz), 2.95 (dd, 1H, J = 12.5 Hz, J = 5 Hz), 2.72 (d, 1H, J = 13 Hz), 2.21 (t, 2H, J = 7.3 Hz), 1.75-1.78 (m, 4H), 1.55-1.67 (m, 6H), 1.47 (s, 9H), 1.36 (m, 4H); 13C NMR (500 MHz, MeOD) δ 174.5, 164.7, 157.1, 78.3, 61.9, 60.2, 55.6, 39.8, 39.6, 38.8, 35.4, 29.5, 28.9, 28.3, 28.1, 27.4, 26.2, 26.1, 25.5.
40
2.4.6. 6-(5-((3aS,4S,6aR)-2-Oxohexahydro-1H-thieno[3,4-d]imidazol-4yl)pentanamido)hexan-1-ammonium chloride (2.4)
Carbamate 2.3 (365 mg, 1 mmol) in MeOH (40 mL) was treated with a solution of HCl gas in dry Et2O (5 ml of a 2 mM solution) and stirred at room temperature for 3 h. The volatiles were removed in vacuo to give an oily residue that was freeze-dried to give N–(6-aminohexyl)-5-((3aS,4S,6aR)-2-oxohexahydro-1H-thieno[3,4-d]imidazol-4-yl)pentanamide (378 mg, 1 mmole, 100 %) as a white solid without further purification.
HRMS (ESI+) m/z: Calcd for C16H31N4O2S+ [M+H]+: 343.2162, Found 343.2230.
LC-MS purity >99.5(Acq method, LC_0_95_15min_MeOH, column, XSelect C18 4.6x100mm, 5µm, tr = 8.05min). 1H NMR (500 MHz, MeOD) δ 4.62-4.65 (m, 1H), 4.43-4.45 (m, 1H), 3.27-3.31 (m, 1H), 3.23 (t, 2H, J = 7 Hz), 3.00 (dd, 1H, J =13 Hz, J = 5 Hz), 2.94 (t, 2H, J = 7.8 Hz), 2.78 (d, 2H, J = 13 Hz), 2.28 (t, 2H, J = 7.2 Hz), 1.69-1.79 (m, 8H), 1.47-1.57 (m, 6H). 13C NMR (500 MHz, MeOD) δ 175.0, 164.4, 62.7, 61.1, 55.4, 39.3, 39.2, 39.0, 35.0, 28.6, 28.3, 28.2, 27.0, 25.9, 25.6, 25.5.
41 2.5. Conclusion
After having tried different procedures, we were finally able to develop a synthetic method and a purification step to synthesize pure biotin-conjugated biguanide. Biotin conjugated biguanide and its quaternary ammonium analog were used to identify mitochondrial proteins having binding affinity to metformin. These results are presented in the next chapter.
42 2.6. References
1. Schenone, M.; Dančík, V.; Wagner, B. K.; Clemons, P. A., Nat. Chem. Biol. 2013, 9, 232-240.
2. Nguyen, C.; Teo, J.-L.; Matsuda, A.; Eguchi, M.; Chi, E. Y.; Henderson, W. R.; Kahn, M., Proc. Natl. Acad. Sci. 2003, 100, 1169-1173.
3. Low, W. K.; Dang, Y.; Schneider‐Poetsch, T.; Shi, Z.; Choi, N. S.; Rzasa, R. M.; Shea, H. A.; Li, S.; Park, K.; Ma, G., Methods enzymol. 2007, 431, 303-324.
4. Gardner, R. A.; Ghobrial, G.; Naser, S. A.; Phanstiel IV, O., J. Med. Chem. 2004, 47, 4933-4940.
5. Kimura, Y.; Ito, S.; Shimizu, Y.; Kanai, M., Org. Lett. 2013, 15, 4130-4133. 6. Bamberger, E.; Dieckmann, W., Eur. J. Inorg. Chem. 1892, 25, 543-546.
7. Nederberg, F.; Appel, E.; Tan, J. P.; Kim, S. H.; Fukushima, K.; Sly, J.; Miller, R. D.; Waymouth, R. M.; Yang, Y. Y.; Hedrick, J. L., Biomacromolecules. 2009, 10, 1460-1472.
43
Chapter 3
Identification of the metformin’s target by
44 3.1. Introduction
As outlined previously, mitochondrial Complex I has been proposed to be the target of metformin, responsible for cancer inhibition in T2D patients. However, there is no proof of direct interaction between metformin and any specific subunit from the Complex I or other proteins involved in the mitochondrial respiratory chain.
Here, after having validated that the biotinylated biguanide 2.5 was active at the same level as metformin, we performed a pull-down experiment with this biotinylated biguanide 2.5 using amine 2.4 as control in cancerous KP4 cells, with streptavidin Dynabeads, in order to identify the proteins that show specific interactions with metformin. The results presented in this chapter have significant implications in the understanding of the mechanism of action of metformin and the inhibition of cancer cell proliferation.
Experiments and results presented below were performed in collaboration with Marie-Camille Rowell from Professor Ferbeyre’s group (Department of Biochemistry and Molecular Medicine, University of Montreal).
3.1.1. Biotin-Strept(avidin) System
D-Biotin, vitamin H, is present in all living cells and is important in several biological processes (Figure 3.1).1 It is abundant in certain plant and animal tissues, such as egg yolk, brain, liver and blood. Moreover, biotin can be conjugated with many proteins and small molecules without changing its binding properties.1 The natural proteins that bind biotin are avidin and streptavidin.
45
Figure 3.1. Structure of biotin
Avidin is a 67 KDa glycoprotein that contains four equal subunits of 128 amino acids. Streptavidin has four subunits.2 The affinity constant of biotin-strept(avidin) couple is 1015 M-1 which represents the strongest non covalent interaction known to date in nature.2 Moreover, biotin-avidin and biotin-streptbiotin-avidin systems are extremely stable even under harsh reaction conditions.3 The biotin–streptavidin complex is more often employed than the biotin-avidin system because of its lower nonspecific binding.3Biotin fits tightly inside of the streptavidin active site (Figure 3.2).4
However, the biotin terminal carboxylate is located at the exterior of the protein, which makes functionalization possible, without affecting binding affinity between streptavidin and the biotinylated molecules or proteins.3 The biotinylation of small molecules and proteins has found application in the identification of different protein targets and the immobilization of proteins at surfaces.3
46
3.1.2. Affinity chromatography method for the identification of proteins interacting with metformin
Among the large number of methods that can be used for the identification of proteins that specifically bind a bioactive molecule5, affinity chromatography followed by mass spectrometry is widely used.6 As shown in Figure 3.3, a biotinylated ligand is first incubated with proteins form cell lysate to capture those that interact with the ligand. These proteins are then isolated from the lysate using an avidin or streptavidin-immobilized column, eluted by disruption of their interaction with the biotinylated ligand and separated by sodium dodecyl polyacrylamide gel electrophoresis (SDS-PAGE). Finally the isolated proteins are identified by mass spectrometry.7
In principle, this method is applicable to any small molecule, assuming biological activity is not disrupted by biotinylation. Ligands have been identified for many proteins, such as receptors, enzymes and ion channels.8 The experimental details of this method are influenced by the binding properties of the biotinylated ligand and its mode of interaction with the proteins.8 In many cases, nothing may be known about the interaction mode, such that different experimental procedures must be tried to optimize the proteins affinity and elution. The elution methods may be summarized as the following (shown in Figure 3.3):
(I) Elution from the column with a SDS buffer. The purified sample contains in this case specific and nonspecific proteins
(II) Competition with excess amounts of free ligand (III) Classify with an inactive molecule A
47
Figure 3.3. Identification of the protein target of a bioactive small molecule using affinity
chromatography .6
The order of elution from the column depends on the strength of interaction between the ligand and the protein. High binding affinity ligands exhibit dissociation constants (KD) usually ranging from 10-7 to 10-15 M.6 Another important factor is the quantity of the target protein in the lysate. A high concentration of target protein accelerates the formation of the ligand-target protein complex and results consequently in higher yields of isolation by affinity chromatography.5a A high concentration of free ligand has generally a negative effect on separation by affinity chromatography. In the presence of an excess amount of ligand, the target proteins cannot bind to the resin and are not isolated, even if they possess a specific interaction with the ligand (Figure 3.3 (II)).
A particular problem often observed with affinity chromatography is false positives which are nonspecific binding proteins. In fact, nonspecific binding is the major problem of this method. Non-specific proteins are hard to remove from the column, even after several washes with different