HAL Id: pastel-00593939
https://pastel.archives-ouvertes.fr/pastel-00593939
Submitted on 18 May 2011
HAL is a multi-disciplinary open access
archive for the deposit and dissemination of
sci-entific research documents, whether they are
pub-lished or not. The documents may come from
teaching and research institutions in France or
abroad, or from public or private research centers.
L’archive ouverte pluridisciplinaire HAL, est
destinée au dépôt et à la diffusion de documents
scientifiques de niveau recherche, publiés ou non,
émanant des établissements d’enseignement et de
recherche français ou étrangers, des laboratoires
publics ou privés.
of Triple Negative Breast Cancers
Guillem Rigaill
To cite this version:
Guillem Rigaill. Statistical and algorithmic developments for the analysis of Triple Negative Breast
Cancers. Applications [stat.AP]. AgroParisTech, 2010. English. �NNT : 2010AGPT0066�.
�pastel-00593939�
N°: 2009 ENAM XXXX
AgroParisTech
UMR 518 AgroParisTech / INRA 16, rue Claude Bernard 75231 Paris CEDEX 05 présentée et soutenue publiquement par
Guillem Rigaill
17 / 11 / 2010
Développements statistiques et algorithmiques
pour l'analyse des cancers du sein de type triple négatif
Doctorat ParisTech
T H È S E
pour obtenir le grade de docteur délivré par
L’Institut des Sciences et Industries
du Vivant et de l’Environnement
(AgroParisTech)
Directeur de thèse : Stéphane Robin
Co-encadrement de la thèse : Thierry Dubois et Emmanuel Barillot
Jury
MD/Ph.D. Gordon MILLS, Professeur, MD Anderson Cancer Center Rapporteur
Ph.D. Nancy ZHANG, Professeur Assisant, Université de Stanford Rapporteur
Ph.D. Anestis ANOTONIADIS, Professeur, Université Joseph Fourier Examinateur
Ph.D. Thomas SCHIEX, DR, INRA Examinateur
Ph.D. Lodewyk WESSELS, Chef d'équipe, The Netherlands Cancer Institute Examinateur
Ph.D. Stéphane ROBIN, DR, INRA Directeur
Ph.D. Emmanuel BARILLOT, DU, Institut Curie Co-directeur
AgroParisTech
UMR 518 AgroParisTech / INRA 16, rue Claude Bernard 75231 Paris CEDEX 05 présentée et soutenue publiquement par
Guillem Rigaill
17 / 11 / 2010
Statistical and algorithmic developments
for the analysis of Triple Negative Breast Cancers
Doctorat ParisTech
T H È S E
pour obtenir le grade de docteur délivré par
L’Institut des Sciences et Industries
du Vivant et de l’Environnement
(AgroParisTech)
Ph.D. Advisor : Stéphane Robin
Ph.D. Co-advisors : Thierry Dubois et Emmanuel Barillot
Jury
MD/Ph.D. Gordon MILLS, Professor, MD Anderson Cancer Center Reviewer
Ph.D. Nancy ZHANG, Assistant Professor, Stanford university Reviewer
Ph.D. Anestis ANOTONIADIS, Professor, Université Joseph Fourier Examiner
Ph.D. Thomas SCHIEX, DR, INRA Examiner
Ph.D. Lodewyk WESSELS, Group Leader, The Netherlands Cancer Institute Examiner
Ph.D. Stéphane ROBIN, DR, INRA Ph.D. Advisor
Ph.D. Emmanuel BARILLOT, DU, Institut Curie Ph.D. Co-advisor
D´eveloppements statistiques et algorithmiques pour l’analyse
des cancers du sein de type triple n´egatif
R´esum´e
Dans le monde, le cancer du sein est le cancer le plus fr´equent de la femme. Plusieurs types de cancer du sein ont ´et´e mis en ´evidence. Les carcinomes infiltrants triple n´egatif (TNBC) sont l’un de ces types. Les TNBC sont parmi les plus agressifs cancers du sein et sont associ´es `a un mauvais pronostique. Il n’y a pas encore de traitement d´edi´e pour ces cancers. Cette th`ese avait pour but d’identifier des g`enes et des voies de signalisation d´e-r´egul´es dans les cancers de types TNBC en s’appuyant sur les profils transcriptomiques et g´enomiques de tumeurs TNBC bien caract´eris´ees, obtenues par la technique des biopuces.
Mon travail comporte deux volets. D’abord, j’ai d´evelopp´e des m´ethodes pour l’analyse des donn´ees g´enomiques. J’ai propos´e une m´ethode (ITALICS) pour la normalisation des donn´ees Affymetrix SNP 100K et 500K. J’ai travaill´e sur la segmentation des profils g´enomiques. J’ai d´evelopp´e de nouveaux outils statistiques pour ´etudier la stabilit´e de la segmentation et j’ai obtenu des formules exactes pour des crit`eres de s´election de mod`ele. Enfin, j’ai propos´e un algorithme de programmation dynamique rapide qui retrouve la meilleure segmentation au sens de la norme euclidienne.
Dans un second temps, j’ai analys´e les donn´ees omiques du projet. J’ai con¸cu le plan d’exp´erience. J’ai analys´e les donn´ees transcriptomiques avec des m´ethodes d´ej`a disponibles. J’ai compar´e les classifi-cations transcriptomique et immunohistochimique des TNBC. L’analyse des donn´ees transcriptomiques m’a permis d’identifier des g`enes et des voies de signalisation d´e-r´egul´es dans les TNBC. Enfin, j’ai analys´e les donn´ees g´enomiques avec les outils que j’ai d´evelopp´es.
Mots-cl´es Cancer du sein, Triple Negatif, biostatiques, profil transcriptomique, profil g´enomique Laboratoire UMR 518 AgroParisTech / INRA, AgroParisTech 16, rue Claude Bernard 75231 Paris CEDEX 05 FRANCE
Triple Negative Breast Cancers
Abstract
Throughout the world and among the different types of cancer, breast cancer is one of the most prevalent ones. It can be subdivided in several types among which the triple negative invasive ductal breast carcinoma (TNBC). TNBC is one of the most aggressive types of breast cancer: it is associated to a poor prognosis and there is still no targeted therapy for this type of tumor. In this context, we aim to discover deregulated genes and signaling pathways in human TNBC using high-throughput omic data of well-characterized breast tumors to identify potential therapeutic targets.
My work can be divided in two main parts. First, I developed methods for the analysis of genomic data: I proposed a method (ITALICS) for the normalization of Affymetrix SNP 100K and 500K arrays, worked on the segmentation of DNA copy number profiles, proposed new algorithms and new statistical tools to assess the stability of segmentation and derive exact formulation of several model selection criteria and proposed an improved and faster dynamic programming algorithm that recovers the best segmentation exactly with respect to the quadratic loss.
Next, I worked on the analysis of the omic data. The first step of my analysis was to plan the experimental design of the omic experiments. I then analyzed the transcriptomic data using already developed and available tools. I sought to better characterize the distinctness of TNBC at the tran-scriptomic level and its overlap with immunohistochemistry data. I worked at the gene and pathway level to identify genes and pathways of interest. Finally, I analyzed the genomic data using the tools and methods that I have developed.
Keywords Breast cancer, Triple Negative, Gene expression profiling, DNA copy number profiling Laboratory UMR 518 AgroParisTech / INRA, AgroParisTech 16, rue Claude Bernard 75231 Paris CEDEX 05 FRANCE
Remerciements
I would like to thanks Nancy Zhang and Gordon Mills for accepting to review my Ph.D. manuscript as well as Lodewyk Wessels, Anestis Antoniadis and Thomas Schiex for accepting to examine my Ph.D. defense.
Je remercie ensuite mon directeur de th`ese, St´ephane Robin, et mes deux co-directeurs : Thierry Dubois et Emmanuel Barillot. Je les remercie pour leur confiance, leur franchise, leur aide, leurs conseils et pour m’avoir fait d´ecouvrir diverses facettes de la science : les statistiques, la biologie et la bioinformatique.
Je tiens ´egalement `a remercier les trois membres de mon comit´e de th`ese : Christophe Ambroise, Olivier Delattre et Alain Viari pour le temps qu’ils m’ont accord´e et leurs conseils.
Je tiens aussi `a remercier les habitu´es des r´eunions kinomes : Emilie, Gordon et Philippe de m’avoir ´ecout´e et conseill´e, ainsi que les habitu´es des comit´es techniques Curie-Servier pour leurs conseils.
Je remercie Sergio Roman Roman de m’avoir accueilli dans le d´epartement de recherche transla-tionnelle de l’institut Curie.
Je remercie Dominique, Jennifer, Marie, Carole, Sophie et Odile de m’avoir guid´e dans les m´eandres administratifs.
Je remercie les trois laboratoires o`u j’ai travaill´e durant ces trois ann´ees - l’´equipe MIA 518, le laboratoire de signalisation et l’U900 - et surtout toutes les personnes qui y travaillent ou qui y ont travaill´e ces derni`eres ann´ees. L’entourage technique et scientifique, ainsi que les repas chaleureux et les pauses conviviales ont eu (et garderont) une grande importance pour moi. Je remercie en particulier les personnes dont j’ai partag´e le bureau, `a St Louis : le bureau signalisation (qui d´evoile derri`ere sa porte l’identit´e du p`ere No¨el) puis le bureau info, `a l’U900 : le bureau biostat (o`u R et les M & M’s sont rois) et tous les autres pour m’avoir accueilli quand il n’y avait plus de place et enfin `a l’agro : le bureau tout au fond du couloir qui s’est ensuite d´eplac´e au premier ´etage (bureau embelli par deux superbes ´echarpes de champions de France, l’une rouge, l’autre bleu). Je remercie toutes les autres personnes avec qui j’ai eu l’occasion de travailler durant ces trois ans. Ce fut un plaisir de travailler et d’apprendre avec eux.
Je remercie toutes les personnes qui ont relu et m’ont aid´e `a r´ediger ce manuscrit : St´ephane, Thierry, Emmanuel, Anne, Gordon, Marie-Laure, Emilie, Alban, Patrick et Chlo´e, ainsi que tous ceux qui m’ont aid´e `a pr´eparer ma soutenance, qui y ont assist´e et/ou qui sont venus au pot de th`ese qui a suivi.
Je remercie une certaine promo du master de bioinfo de Rouen, les jeunes statisticiens amateurs de jeux de soci´et´e, quelques Bordelais venus du Nord, quelques Lyonnais anciennement Ni¸cois et quelques Spinoliens.
Un grand merci `a tous ceux que je ne mentionne pas ici, faute de place. Ils me le pardonneront j’esp`ere . . .
Enfin, je remercie ma m`ere, mon p`ere, mon fr`ere, mon oncle et une certaine lectrice attentive et patiente pour tout le reste, jamais mes mots ne sauront exprimer ma gratitude. Je vous d´edie cette th`ese.
R´esum´e substantiel
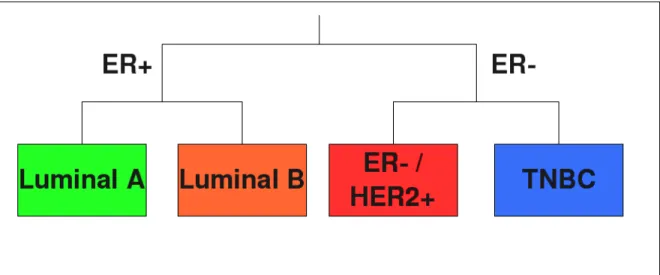
Le cancer du sein est l’un des cancers les plus r´epandus qui soit dans le monde occidental, 1 femme sur 8 se voit un jour diagnostiqu´ee d’un cancer du sein. Cette maladie est aussi tr`es h´et´erog`ene. Elle peut ˆetre divis´ee entre : les tumeurs qui expriment les r´ecepteurs aux œstrog`enes (ER+ : estrogen receptor positive) et celles qui n’expriment pas ces r´ecepteurs (ER-, voir figure 1). Les tumeurs ER+ comprennent les tumeurs Luminal A et Luminal B. Les tumeurs comprennent les tumeurs ER-/ HER2+ qui surexpriment le r´ecepteur du facteur de croissance ´epidermique humain 2 (r´ecepteur HER2), ainsi que les tumeurs triple n´egatives (TNBC) qui sont ´egalement n´egatives pour les r´ecepteurs `a la progest´erone (PR) et ne surexpriment pas le g`ene de HER2. Les tumeurs TNBC ont un taux important de pertes et de gains chromosomiques mais pr´esentent moins d’amplifications d’ADN que les autres sous-types de cancer du sein. Les tumeurs TNBC souffrent d’un tr`es mauvais pronostic. Des th´erapies cibl´ees, innovantes et prometteuses sont actuellement en train d’ˆetre ´etudi´ees. Un exemple est l’inhibition de la polym´erase poly ADP-ribose (PARP). Malheureusement, il n’y a pas encore de th´erapies cibl´ees pour les TNBC qui soient utilis´ees en routine comme il en existe pour les tumeurs surexprimant HER2 (des anticorps monoclonaux anti-HER2) et pour les tumeurs Luminal (th´erapie endocrine). A travers le monde, de nombreuses ´equipes scientifiques compos´ees `a la fois de cliniciens et de biologistes cherchent `a mieux comprendre les aspects cliniques et la biologie des TNBC dans le but d’appliquer leurs r´esultats en clinique et de proposer des th´erapies innovantes et sur mesure.
Mon projet de th`ese faisait partie d’une collaboration entre l’Institut Curie et le groupe pharma-ceutique Servier. Le but de cette collaboration est de d´ecouvrir des g`enes et des voies de signalisation d´er´egul´es dans les TNBC humains, afin d’identifier de nouvelles cibles th´erapeutiques (r´esum´e sur la figure 2).
7
Fig. 1 – Classification des cancers du sein entre les tumeurs qui expriment les r´ecepteurs aux œstrog`enes (ER+) et celles qui ne les expriment pas ces r´ecepteurs (ER-). Les tumeurs ER+ contiennent les tumeurs Luminal A et Luminal B. Les tumeurs ER- comprennent les tumeurs ER- / HER2+ et TNBC.
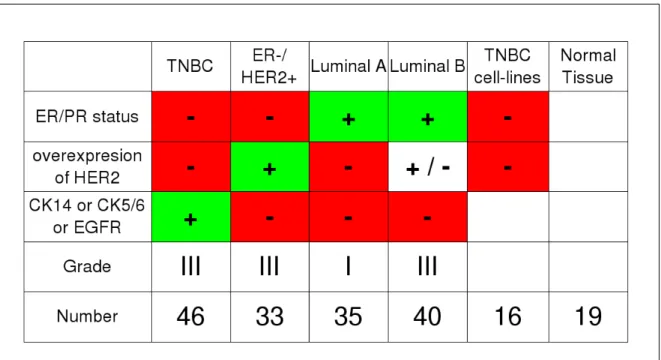
Fig. 2 – Des tumeurs de type Luminal A, Luminal B, ER- / HER2+ et TNBC ont ´et´e choisies et caract´eris´ees par une pathologiste (Anne Vincent Salomon, MD/Ph.D.) de l’Institut Curie (IC) par immunohistochimie (IHC). Des lign´ees cellulaires de TNBC et des tissus mammaires sains ont ´egalement ´et´e collect´es. Des profils de biopuces transcriptomiques, g´enomiques, microARN et prot´eomiques ont ´et´e g´en´er´es par le d´epartement de transfert de l’Institut Curie. Cette importante quantit´e de donn´ees a ´et´e analys´ee par l’´equipe de bioin-formatique de l’Institut Curie et l’´equipe de biostatistiques de l’AgroParisTech (Agro) `a l’aide d’outils de biostatistiques et de biologie des syst`emes. Ces analyses ont g´en´er´e des listes de cibles potentielles. Certaines de ces cibles ont d´ej`a ´et´e caract´eris´ees et leurs fonctions valid´ees dans des lign´ees cellulaires par une ´equipe de biologistes du d´epartement de transfert de l’Institut Curie. Dans ce projet, j’ai ´et´e responsable de l’analyse biostatistique des donn´ees omiques repr´esent´ees en rouge.
9 Mon travail peut ˆetre divis´e en deux parties. J’ai d´evelopp´e des m´ethodes statistiques et des algo-rithmes pour analyser les donn´ees g´enomiques et j’ai en parall`ele analys´e les donn´ees transcriptomiques avec des m´ethodes biostatistiques et bioinformatiques d´ej`a disponibles.
Analyse des donn´ees g´enomiques J’ai travaill´e sur la normalisation de profils de nombre de copies d’ADN et j’ai propos´e une m´ethode (appel´ee ITALICS) pour la normalisation des puces Affymetrix SNP 100K et 500K (Rigaill et al. (2008)). Nous avons montr´e qu’ITALICS ´etait plus performant que les autres m´ethodes existantes `a l’´epoque de notre ´etude en termes de rapport signal sur bruit et qu’il permet une meilleure classification entre les nouvelles tumeurs primaires et les r´ecurrences de tumeurs dans un jeu de donn´ees de cancers du sein (Bollet et al. (2008), en collaboration avec Marc Bollet, MD/Ph.D.).
J’ai ´egalement travaill´e sur la segmentation de profils de nombre de copies d’ADN. Avec Emilie Lebarbier (Ph.D.) et St´ephane Robin (Ph.D.), j’ai propos´e de nouveaux algorithmes et de nouveaux outils statistiques pour d´eterminer la stabilit´e des segmentations et la formulation exacte de plusieurs crit`eres de s´election de mod`eles (Rigaill et al. (2010), ce travaill a ´et´e s´el´ectionn´e pour les actes de la conf´erence COMPSTAT 2010). J’ai aussi con¸cu et impl´ement´e un algorithme de programmation dynamique plus rapide que les pr´ec´edents qui permet de trouver la meilleure segmentation au sens de la norme Euclidienne (Rigaill (2010), ce travail a ´et´e soumis dans un journal d’algorithmique et de math´ematiques appliqu´ees).
J’ai appliqu´e ces diff´erents outils statistiques et algorithmiques aux donn´ees g´enomiques de cancers du sein Curie-Servier. Cela m’a permis en particulier d’identifier la perte de PTEN dans plus de 50% des tumeurs TNBC en collaboration avec B´ereng`ere Marty (Marty et al. (2008)). Plusieurs autres r´egions du g´enome ont ainsi ´et´e identifi´ees. J’ai ensuite extrait (de la base de donn´ees Ensembl) les g`enes de ces r´egions pour fournir une liste de g`enes candidats.
Analyse des donn´ees transcriptomiques Ensuite, j’ai travaill´e sur l’analyse des donn´ees Curie-Servier transcriptomiques. La premi`ere ´etape de cette analyse a ´et´e de concevoir le plan d’exp´erience. Une ´etape presque ´evidente et pourtant souvent n´eglig´ee. Sans surprise, la r´ealisation de ce plan d’exp´erience a permis de rendre l’exp´erience plus robuste et d’am´eliorer notre capacit´e `a d´etecter les « v´eritables » diff´erences entre les tumeurs TNBC et les autres types de tumeurs.
Apr`es cela, j’ai analys´e les donn´ees transcriptomiques `a l’aide d’outils biostatistiques et bioinfor-matiques d´ej`a disponibles. Le but ´etait de mieux caract´eriser les particularit´es transcriptomiques des TNBC et leur recoupement avec les donn´ees immunohistochimiques (IHC) (Rigaill et al. (2011), en pr´eparation en collaboration avec Anne Vincent Salomon, MD/Ph.D). J’ai r´ealis´e l’analyse statistique des profils transcriptomiques tumoraux `a l’´echelle du g`ene et `a celle de la voie de signalisation, afin d’identifier des g`enes et des voies de signalisation candidats. Le rˆole de certains de ces candidats dans le d´eveloppement tumoral a pu ˆetre confirm´e in vitro ; en particulier dans le cas des tumeurs TNBC le rˆole des formines li´ees aux diaphanes (DRF, Liz´arraga et al. (2009)) en collaboration avec l’´equipe de Philippe Chavrier (Ph.D.) et l’implication des voies du stress oxidatif dans les tumeurs du sein ER- / HER2+ (Toullec et al. (2010)) en collaboration avec l’´equipe de Fatima Mechta Grigoriou (Ph.D.).
L’analyse des donn´ees omiques `a haut-d´ebit est au croisement de la biologie, des sciences cliniques, de la biotechnologie, des statistiques et de l’informatique. Afin d’appr´ehender ces diff´erents aspects, cette th`ese a ´et´e r´ealis´ee entre 3 laboratoires : un laboratoire de biologie travaillant sur les TNBC et dirig´e par Thierry Dubois (Ph.D.), un laboratoire de bioinformatique travaillant sur les donn´ees li´ees au cancer et dirig´e par Emmanuel Barillot (Ph.D.) et un laboratoire de statistique travaillant sur les donn´ees biologiques `a haute densit´e et dirig´e par St´ephane Robin (Ph.D.). De plus, `a travers cette th`ese, j’ai collabor´e avec plusieurs autres groupes de biologistes, de cliniciens et de scientifiques du groupe pharmaceutique Servier.
Id´ealement, les biostatistiques cherchent `a r´epondre `a des questions d’int´erˆet biologique et/ou cli-nique, `a l’aide de techniques statistiques robustes et d’algorithmes efficaces. En r´ealit´e, il est extrˆemement difficile, voire impossible, d’accomplir tout cela en mˆeme temps, sans doute `a cause de la com-plexit´e intrins`eque de la biologie. Ainsi, il est important d’accepter certaines simplifications biolo-giques n´ecessaires, certaines limitations statistiques et certains imperfections algorithmiques. Prendre en compte toutes ces incertitudes permet de mieux analyser et mieux comprendre les r´esultats bioin-formatiques et biostatistiques. Une bonne fa¸con d’atteindre un ´equilibre entre tous ces ´el´ements est le concept de mod`ele biostatistique. Un mod`ele biostatistique est con¸cu pour r´epondre `a une question biologique sp´ecifique. On peut le percevoir comme une collection de r`egles math´ematiques qui sont
11 id´ealement justifi´ees et compr´ehensibles biologiquement, prennent en compte les al´eas pour permettre leur ´etude statistique, et enfin justifient les algorithmes (et si n´ecessaire les m´ethodes heuristiques) utilis´ees. Tout au long de ma th`ese, j’ai essay´e d’utiliser ce concept de mod`ele aussi souvent que possible afin de permettre une meilleure int´egration des diff´erents aspects (biologique, statistique et informatique) et finalement r´epondre aux questions biologiques ou cliniques de d´epart.
Conclusion
Cette th`ese fait partie d’un projet plus large qui tente d’identifier de nouvelles cibles th´erapeutiques pour les cancers du sein. Je me suis concentr´e sur l’analyse des donn´ees g´enomiques et transcripto-miques. J’ai con¸cu les plans d’exp´erience, j’ai ensuite analys´e les donn´ees transcriptomiques avec des m´ethodes d´ej`a disponibles et enfin j’ai propos´e de nouveaux outils biostatistiques et des algorithmes efficace pour l’analyse des donn´ees g´enomiques. Mes analyses ont conduit `a des listes de g`enes et de voies de signalisation candidats. Le rˆole de certains de ces candidats dans le d´eveloppement tumoral a pu ˆetre confirm´e in vitro.
Au-del`a du cadre de cette th`ese, en tant que partie int´egrante d’un projet plus large, l’analyse omique va se poursuivre. En particulier, les donn´ees micro ARN et prot´eomiques n’ont pas encore ´et´e analys´ees (voir la figure 2). De plus, il sera important d’int´egrer les informations apport´ees par ces diff´erentes sources (ADN, ARN, microARN et prot´eines) pour chaque ´echantillon afin de mieux comprendre la pathologie mol´eculaire des TNBC, dans l’espoir d’identifier ainsi de nouvelles cibles th´erapeutiques.
Contents
I Introduction
17
1 Overview 19
1.1 Introduction . . . 19
1.2 Methods for the analysis of DNA copy number profiles . . . 23
1.3 Biostatistical analysis of the transcriptomic Curie-Servier dataset . . . 24
1.4 Conclusion . . . 27
2 A small introduction to Triple Negative Breast Cancers 29 2.1 Breast cancers . . . 29
2.2 Triple Negative and Basal-like breast cancers . . . 34
2.3 Breast tumors of the Curie-Servier cohort . . . 35
II Genomic Analysis
37
3 Chromosome aberrations 39 3.1 Some technologies to study genomic rearrangements . . . 423.2 DNA copy number profiles of SNP and CGH arrays . . . 43
3.3 An overview of CGH data analysis . . . 45
4 Normalization of DNA copy number profiles 47 4.1 Short overview of microarray normalization . . . 48
4.2 Specificities of tumor DNA copy number profile normalization . . . 50
4.3 Normalization of Affymetrix Genechip 50K and 250K SNP arrays . . . 51
4.4 Paper: ITALICS . . . 54
5 Segmentation of DNA copy number profiles 63 5.1 A piecewise constant model for the analysis of DNA copy number profiles . . . 65
5.2 The CGHseg methodology . . . 66
5.3 Assessing the quality of a given segmentation . . . 69
5.4 Paper: Exploration of the segmentation space . . . 71
5.5 Optimal computational scheme for large DNA copy number profiles . . . 89
5.6 Paper: Pruned dynamic programming for segmentation . . . 93
6 Analysis of the Curie-Servier Genomic dataset 107 6.1 Genomic alterations in breast cancers and in TNBC . . . 107
6.2 Analysis of the genomic Curie-Servier dataset . . . 110
III Transcriptomic Analysis
119
7 Introduction 121 8 Experimental Design 125 8.1 A small introduction to experimental design . . . 1258.2 Design of the transcriptomic experiment . . . 128
9 Pre-processing 139 9.1 Probe annotation . . . 139
9.2 Normalization . . . 141
10 Exploratory Analysis 145 10.1 Validation of the pre-processing step . . . 145
CONTENTS 15
11 Comparison of TNBC with other tumor types 155
11.1 Gene by gene differential analysis . . . 155
11.1.1 Statistical testing . . . 155
11.1.2 Other filters . . . 157
11.1.3 Paper: Frequent PTEN genomic alterations . . . 163
11.1.4 Paper: Formins regulate tumor cell invasion . . . 181
11.2 Pathway by pathway differential analysis . . . 191
11.2.1 Paper: Reactive oxygen species (ROS) control myofibroblast and metastases . . 194
11.2.2 An overview of the Wnt pathway in breast cancers . . . 217
11.2.3 Transcriptomic statistical analysis of the Wnt pathway . . . 219
IV Conclusion
229
A A few more papers 235 A.1 DNA Breakpoints to Define True Recurrences Among Ipsilateral Breast Cancers . . . . 235Part I
Introduction
Chapter 1
Overview
1.1 Introduction
Breast cancer is one of the most prevalent types of cancers and 1 woman out of 8 is diagnosed with breast cancer at some time in her life in the western world. Breast cancer is a very heterogeneous disease and can be divided into estrogen receptor (ER) positive and ER negative tumors (see Figure 1.1). ER positive tumors comprise Luminal A and Luminal B tumors. ER negative tumors include ER- / HER2+ tumors, which overexpress the Human Epidermal growth factor Receptor 2 (HER2) gene, and Triple negative (TNBC) tumors, that are ER negative, progesterone receptor (PR) negative and do not overexpress HER2. TNBC have a very high rate of chromosomal loss and gain, harbor less DNA amplifications than other breast cancer subtypes and have a very poor prognosis. Innovative and promising targeted therapies are currently explored for TNBC, such as poly ADP-ribose polymerase (PARP) inhibition, but there is still no targeted therapy for TNBC in routine clinical practice as there is for both HER2+ tumors (HER2 monoclonal antibodies) and for Luminal tumors (endocrine therapy). Many scientific teams throughout the world, both of clinicians and biologists, are working to understand better the clinical aspects and the biology of TNBC and would like to apply their research to clinical prospects and to suggest innovative and tailored, therapy.
The project I have been involved in is a collaboration between the Institut Curie (IC) and the 19
Figure 1.1: Classification of breast cancers between estrogen receptor (ER) positive and ER negative tumors. ER positive tumors comprise Luminal A and Luminal B tumors. ER negative tumors include ER- / HER2+ tumors and TNBC tumors
Servier pharmaceutical group. The goal of the project was to discover deregulated genes and signaling pathways in human TNBC to identify new therapeutic targets. This project is summarized in Figure 1.2.
My work can be subdivided in two main parts. First, I developed methods for the analysis of genomic data. I worked on the normalization of DNA copy number profiles and I proposed a method (ITALICS) for the normalization of Affymetrix SNP 100K and 250K arrays. I also worked on the segmentation of DNA copy number profiles. With Emilie Lebarbier (Ph.D.) and St´ephane Robin (Ph.D.), I proposed new algorithms and new statistical tools to assess the stability of segmentation and derive exact formulation of several model selection criteria. I developed and implemented an improved and faster dynamic programming algorithm that recovers the best segmentation with respect to the Euclidean norm. I applied these tools to the analysis of the Curie-Servier dataset.
Next, I worked on the analysis of the Curie-Servier transcriptomic data. The first step of my analysis was to plan the experimental design of the transcriptomic, genomic and miRNA experiments. It is a very standard problem yet it is often overlooked and unsurprisingly it resulted in an improved power to detect true differences between TNBC and other sample types and a more robust design. I
1.1. INTRODUCTION 21
Figure 1.2: Both breast tumors of Luminal A, Luminal B, ER- / HER2+ and TNBC subtypes were selected and characterized by a pathologist from the IC using immunohistochemistry (IHC, Anne Vincent Salomon, MD/Ph.D.). TNBC cell lines and normal breast tissues were also collected. Transcriptomic, genomic, miRNA and proteomic microarray profiles were generated at the translational department of the IC. This huge amount of data has been analyzed in the IC bioinformatics team and the biostatistics team of Agroparistech (Agro) using biostatistical and system biology tools. This analysis has generated lists of potential targets. Some of these potential targets have already been further characterized and functionally validated in cell lines by a team of biologists at the translational department of the IC. In this project, I have been in charge of the biostatistical analysis of the omic data represented in red.
then analyzed the transcriptomic data using already available biostatistical and bioinformatical tools. I sought to characterize better the distinctness of TNBC at the transcriptomic level and its overlap with the immunohistochemistry (IHC) data. I worked at the gene and pathway level to identify genes or pathways that are deregulated in TNBC and propose lists of genes and lists of pathways of interest.
The analysis of high-throughput omics data is at the crossroad between biology, clinic, biotechnol-ogy, statistics and computer science. To achieve a balance between these different aspects, this thesis has been realized through a close collaboration between three main laboratories: a laboratory of biolo-gists working on TNBC headed by Thierry Dubois (Ph.D.), a laboratory of bioinformaticians working on cancer data headed by Emmanuel Barillot (Ph.D.) and a laboratory of statisticians working on high-throughput biological data headed by St´ephane Robin (Ph.D.). Moreover throughout the thesis I have collaborated with several other groups of both biologists and clinicians and with scientists from the pharmaceutical group Servier.
Ideally biostatistics aim at answering biologically and/or clinically relevant questions, using well grounded statistical techniques and efficient computational schemes or algorithms. Probably due to the intrinsic complexity of biology it is extremely difficult, perhaps impossible, to achieve all these goals simultaneously, thus it is important to acknowledge the necessary biological simplifications, statistical limitations and algorithmic mishaps and account for all these uncertainties to better analyze and understand bioinformatical and biostatistical results. A good way to achieve this balance is the concept of a biostatistical model. A biostatistical model is made to answer a specific biological question. It can be viewed as a collection of mathematical rules that ideally should be biologically understandable and justified, account for randomness and enable its statistical study, and finally justify algorithmic computations and if necessary heuristics methods. Throughout the thesis I have tried to use this concept of a model as often as possible to enable a better understanding between biology, statistics and computer science and in the end answer the initial biological or clinical questions.
1.2. METHODS FOR THE ANALYSIS OF DNA COPY NUMBER PROFILES 23
1.2 Methods for the analysis of DNA copy number profiles
TNBC have a very high rate of chromosomal gain and loss. These genomic alterations can be measured using various technologies such as CGH and SNP arrays and next-generation sequencing. The correct detection of these numerous alterations is important as we hope to identify tumor suppressor genes in frequently lost regions and oncogenes in frequently gained regions. The biostatistical analysis and biological interpretation of this kind of data is difficult for several reasons.
As for all microarray technologies, measurements are influenced by various non-relevant factors (for example the probes GC-content) and there is a need for efficient normalization methods. In collaboration with Philippe Hup´e (Ph.D.), I worked on the normalization of Affymetrix SNP arrays and proposed a new method: ITALICS (Rigaill et al. (2008, 2007)). We have shown, at the time of the study, that ITALICS outperforms existing methods in terms of signal to noise ratio and enable a better classification of true recurrence and primary on a breast cancer data set (Bollet et al. (2008)). Moreover, for TNBC due to the many genomic rearrangements, recovering the ploidy of tumors is an important and difficult issue that we took into account in collaboration with Tatiana Popova (Ph.D., Popova et al. (2009)) from the group of Marc-Henri Stern (MD/Ph.D., IC).
Both CGH and SNP profiles are modeled as a succession of regions sharing the same copy num-ber or LOH status. These regions are delimited by change-points or breakpoints corresponding to chromosome rearrangements. These profiles are usually analyzed using multiple change-points and segmentation methods. Most segmentation methods return a single segmentation, characterized by a set of breakpoints. Their qualities are rarely questioned. However, for an n-point profile there are 2n−1
possible segmentations, thus picking one segmentation out of so many is obviously a difficult task. To make a valid biological interpretation we would like to be sure that the best segmentation is by far the best fit to the data. If it is not the case we would like to check that the second best, third best and more generally other good segmentations do not have a completely different set of change-points. I have been working on this problem with Emilie Lebarbier (Ph.D.) and St´ephane Robin (Ph.D.) and proposed new algorithms and statistical tools (Rigaill et al. (2010c,d)) to assess and take into account the uncertainty of change-point estimation. From these algorithms and statistical tools we derive
exact formulation of model selection criteria (to select the number of breakpoints) that used to be asymptotically approximated.
The Affymetrix SNP 6.0 technology scans around 2.106million positions along the human genome
and thus around 2.105probes per chromosome. For these very dense and large profiles even recovering
the most likely segmentation is a very difficult task and the fastest algorithm had a runtime quadratic in the size of the data and it took several days to analyze one SNP 6.0 profile. Thus most methods rely on heuristics to reduce the computation time. However, this is done at the price of some errors as heuristics do not recover the best segmentation but rather a good candidate segmentation. This is clearly a problem for biological interpretation as we cannot guarantee that there is not a better way to segment the data. I proposed a new algorithm that recovers the best segmentation in an almost linear runtime and it takes a few minutes only to analyze an SNP 6.0 profile (Rigaill (2010a,b)).
All these statistical and algorithmic developments were applied to the Curie-Servier breast cancer genomic data and allowed us to identify in particular the loss of PTEN (Marty et al. (2008)) in more than 50% of TNBC tumors. Several other regions of the genome were identified and resulted in a list of candidate genes.
1.3 Biostatistical analysis of the transcriptomic Curie-Servier
dataset
Experimental design
From my experience and the experience of others, the most critical step by far in any data analysis is the experiment itself and a bad experiment will always lead to bad analyses and poor results. The goal of experimental design is to ensure that the way the experiment is conducted will actually enable us to answer the main biological question. Omic experiments, as others, must therefore be carefully planned to take into account various, identified and unsuspected, non-relevant factors. From a statistical perspective, it is possible without any data but with some biostatistical model in mind to compare two experimental designs and assess their respective power to detect some biological pattern
1.3. BIOSTATISTICAL ANALYSIS OF THE TRANSCRIPTOMIC CURIE-SERVIER DATASET25 of interest.
The biostatistical model I designed for the project is relatively simple, yet it helped us to clarify commonly made assumptions. First we expect that samples of the same histological type will have similar mRNA measurements. Unfortunately, on the day of the experiment, the temperature during the experiment and many other non-relevant factors influence these measurements. However, hopefully, these non-relevant effects are relatively independent of the biological signal and they can be corrected with a good experimental design. The main biological question of the transcriptomic experiments was what are the mRNA differences between TNBC and normal samples but we were also interested in detecting differences between TNBC and other tumor types.
Keeping all this in mind I constructed experimental designs to answer these questions. The objective was to maximize our ability to detect true differences between TNBC and other histological types. The main issue is that the set of possible designs is large even for computers. For the transcriptomic, genomic and miRNA experiments, I explored either exhaustively when it was possible or stochastically the set of all possible designs to choose one with a powerful ability to detect differences between TNBC and other sample types. Moreover, I randomized samples of the same type to account for unsuspected non-relevant factors.
Transcriptomic data analysis
One of the main problems when analyzing TNBC is that they are a very distinct subgroup of tumors and harbor many genetic, genomic and transcriptomic alterations. Therefore, it is easy to find genes or/and pathways that are differentially expressed in TNBC. For example, from our transcriptomic data I found that almost half of the analyzed genes were differentially expressed in TNBC compared to normal samples. However, the goal is to find driver alterations or key events in the TNBC tumorigenesis and it seems biologically reasonable to think that most differences between TNBC and other sample types are passenger alterations and will not necessarily lead to potential therapeutic targets.
Thus, in collaboration with Anne Vincent Salomon (MD/Ph.D., pathologist), we sought to charac-terize better the distinctness of TNBC at the transcriptomic level and understand the transcriptomic
classification of our tumors using unsupervised classification methods. In particular, I compared the transcriptomic-based classification with the IHC-based classification and found that they were in rel-atively good concordance (less than 15% discordance). Moreover, I assessed the influence of the set of genes used for the transcriptomic classification. Interestingly, the transcriptomic classification and in particular the TNBC cluster seems relatively independent of the set of genes used for the classification (Rigaill et al. (2010b), in preparation). This independence also suggests that identifying a small robust set of genes characteristic of the TNBC is intrinsically difficult.
Once we had acknowledged the specificity of TNBC, we decided to refine our search for genes of interest using biological or clinical information. First, I focused on specific sets of drugable genes such as kinases, and in a collaboration with the team of Philippe Chavrier (Ph.D.), on the Diaphanous-Related Formins (Liz´arraga et al. (2009)). This mechanically increased our statistical power to detect differences in these sets of genes and thus our chances of detecting interesting transcriptomic modifi-cations. I also used pathway/genesets analysis using the globaltest software and the KEGG and GO databases. However, at the pathway level the distinctness of TNBC is even more of a critical issue because in a list containing a lot of differentially expressed genes it is extremely easy to find a gene-set with many deregulated genes. Thus, I focused on some highly significant pathways of biological interest to characterize and understand better their expression pattern. These in-depth analyses of smaller sets of genes also mechanically increased our statistical power and allowed us to identify some key transcriptomic patterns and/or regulation events, more specifically in the Wnt pathway (Rigaill et al. (2010a), in preparation) and in oxidative stress pathways (Toullec et al. (2010)) in collaboration with the team of Fatima Mechta Grigoriou (Ph.D.).
These analyses generated different lists of genes. These genes of interest were validated on other publicly available transcriptomic datasets and some have been experimentally validated using TNBC cell lines (using for example clonogenic, survival and apoptosis assays).
1.4. CONCLUSION 27
1.4 Conclusion
This thesis is part of a larger project aiming at identifying new therapeutic targets for TNBC. I focused on the analysis of transcriptomic and genomic data. I designed the experiments, used already available methods for the transcriptomic data and proposed new biostatistical methods and algorithms for the genomic data. These analyses resulted in lists of genes or pathways that are deregulated in TNBC, some of which have been further validated in vitro.
As part of a larger project the omic analysis will continue after this thesis. In particular the miRNA and proteomic data have not yet been analyzed and obviously all these different sources of information (DNA, RNA, miRNA, proteins) generated for each sample will have to be integrated to understand better the molecular pathology of TNBC and hopefully this will lead to the identification of new therapeutic targets.
Chapter 2
A small introduction to Triple
Negative Breast Cancers
This section is a short introduction to the biology of breast cancer and more specifically of TNBC (Triple Negative Breast Cancers).
2.1 Breast cancers
Epidemiology and risk factors of breast cancers
Throughout the world, breast cancer is the most prevalent type of cancer among women and there are approximately 1.1 million new cases of breast cancer every year. Breast cancer is also the leading cause of cancer deaths in women with 410 000 deaths every year (Vincent-Salomon (2008)). The incidence of breast cancers has regularly increased. In the USA and Europe, this is partly due to the setting up of mammography screenings. Breast cancer survival rates are around 73% in occidental countries and 57% in under-developed countries. The prevalence and incidence of breast cancers greatly differ from one country to another one. Developed countries tend to have higher incidences (Parkin (2004)). Yet, socio-economical factors are not the only ones that should be taken into account. For example, Japan has a very low incidence of breast cancer. Apart from socio-economical factors, biological factors
such as genetic background and environmental factors are important to explain this variation between countries.
Indeed, some genetic factors have been known to be related to breast cancers: the Collabora-tive Group on Hormonal Factors in Breast Cancer (2001) reported that the relaCollabora-tive risk of breast cancer significantly increases with the number of first degree relatives that have been affected. Sev-eral genetic factors have been clearly identified. They are discriminated between the following groups (Mavaddat et al., 2010):
• High penetrance mutations. In this case a single allele conferring a high risk is responsible for the disease. Typical examples are mutations occurring in BRCA1 and BRCA2 genes.
• Moderate penetrance mutations. They regroup uncommon variants associated to moderate risk increase. CHEK2 and ATM are two examples.
• Low penetrance variants. They encompass variants associated to a very small risk. Yet, it is likely that most of the unexplained fraction of familial risk could be explained by these low penetrance variants assuming they are sufficiently numerous.
To conclude on genetic factors, only a minority of familial risk factors are explained by known genetic variants. It is hoped that large sequencing projects and high-density SNP arrays will enable us to discover new variants.
Various environmental factors have been correlated to the development of breast cancer and they might account for 75% of all cases of breast cancer (Ellsworth et al., 2004). Instability in genes that maintain genomic integrity, as well as exogenous chemicals and environmental pollutants are involved. For example, long estrogen exposure (e.g. caused by early puberty, late menopause or hormonal replacement therapy) increases the risk of breast cancer through increased cell proliferation and/or DNA destabilization through depurination (Yager and Davidson, 2006).
Heterogeneity of breast cancers
An important feature of breast cancers is their heterogeneity. This heterogeneity can be seen at many levels. First, breast cancers can be segregated in subgroups according to their histological grade. The
2.1. BREAST CANCERS 31
ductal medullary micropapillary
tubular mucinous lobular
Figure 2.1: Morphological heterogeneity of breast tumors. Six histological sections of six invasive breast cancers stained with Hematoxilin Eosin Saffron (HES) representing six of the histological types defined by the WHO (Tavassoli et al., 2003). Images provided by Anne Vincent-Salomon (MD/Ph.D., Institut Curie).
histological grade takes into account both tumor differentiation and proliferation and it is a validated prognostic factor to determine breast cancer therapy. For example, it is used in the Nottingham prognostic index (Galea et al., 1992; Blamey et al., 2007). Breast cancers can also be classified according to their histological type. These types correspond to specific morphological and cytological patterns (see Figure 2.1). The most common of these types is the Invasive Ductal Carcinomas of No Special Type (IDC-NST). These IDC-NST represent approximately 75% of all breast cancers and correspond to cancers that do not exhibit any characteristic of the special histological types (Weigelt et al., 2010b). Overall, the WHO (World Health Organization) defined at least 17 different histological types of breast cancer (Tavassoli et al., 2003).
The heterogeneity of breast cancers can be further decomposed using immunohistochemical fea-tures. For example, breast cancers are subdivided according to the estrogen receptor (ER) status
and/or the Human Epidermal growth factor Receptor 2 (HER2) status.
IDC-NST breast tumors can also be classified according to their transcription profile (Perou et al., 2000; Sørlie et al., 2001a; Sørlie, 2003; Chin et al., 2006). This classification is called the molecular classification (see Figure 2.2). Hierarchical clustering of breast cancer transcription profiles segregates ER+ from ER- tumors. The ER+ class is further subdivided in Luminal A and B. Luminal A tumors have high levels of expression of ER-activated genes and low proliferation signature. Luminal B cancers usually have a higher histological grade and proliferation rates, and a worse prognosis. Some Luminal B tumors overexpress the HER2 gene and thus are ER+ / HER2+. The ER- group is subdivided in like, ER- / HER2+ and Basal-like (ER- and absence of HER2 overexpression). The Normal-like group might be an artifact due to normal tissue contamination (Parker et al. (2009); Peppercorn et al. (2008)). ER- / HER2+ tumors over-express the HER2 gene. Basal-like tumors usually have a high histological grade, high mitotic index, central necrosis and pushing borders. The molecular analyses of breast cancers has revealed and brought to the forefront various types of breast cancers and provide new insights on the biology of breast cancers. Nevertheless, as we will see (in section 10.2), the stability, reproducibility and clinical use of this classification have been questioned. In the last years, other ER- groups have been identified: the apocrine (Farmer et al., 2005; Doane et al., 2006), interferon (Hu et al., 2006) and claudin-low groups (Herschkowitz et al., 2007; Hennessy et al., 2009).
To conclude, all these various classifications (molecular, histological...) suggest that breast cancer is, in fact, a collection of different diseases affecting the same organ. This heterogeneity of breast cancer raises one obvious question: what is at the origin of these different types? This is a debated question. One hypothesis is that molecular groups of breast cancer correspond to different cell types originally becoming cancerous (Polyak, 2007; Vargo-Gogola and Rosen, 2007). More specifically, the cells from which the tumor originates could either be breast stem cell (Stingl, 2009) or their progenies, which would be the cause of the heterogeneity. Breast stem cells have the ability to renew themselves through mitotic division and differentiate into any specialized breast cell type.
2.1. BREAST CANCERS 33
Figure 2.2: Molecular classification of breast cancer from mRNA expression profiles - Gene expression patterns of 85 experimental samples representing 78 carcinomas, 3 benign tumors, and 4 normal tissues, analyzed by hierarchical clustering using the 476 cDNA intrinsic clone set. (A) The tumor specimens were divided into 6 subtypes based on differences in gene expression. The cluster dendrogram showing the 6 tumor subtypes are colored as: luminal subtype A, dark blue; luminal subtype B, yellow; luminal subtype C, light blue; Normal-like, green; Basal-like, red; ERBB2+, pink. (B) The full cluster diagram scaled down. The colored bars on the right represent the inserts presented in C-G. (C) ERBB2 amplicon cluster. (D) Novel unknown cluster. (E) Basal epithelial cell-enriched cluster. (F) Normal-like cluster. (G) Luminal epithelial gene cluster containing ER. (images and legend from Sørlie et al. (2001b)).
2.2 Triple Negative and Basal-like breast cancers
Triple Negative Breast Cancers (TNBC) are immunohistochemically characterized by the absence of ER and progesterone receptors (PR) and the lack of HER2 overexpression. Due to its aggressiveness, poor prognosis and lack of targeted therapy, these particular tumors are the focus of many research studies. Although the match is not perfect, there is a good correspondence between TNBC and basal-like tumors. Basal-basal-like tumors were identified based on the hierarchical clustering of IDC-NST gene expression profiles while TNBC can be either IDC-NST or one of the special histological types. Overall, the exact definition of Basal-like tumors in comparison to TNBC and the use of the term “basal” is still subject to debate (Gusterson et al., 2005; Gusterson, 2009; Moinfar, 2008). Indeed, no consensus has been reached to identify this group using immunohistochemistry (Rakha et al., 2008; Reis-Filho and Tutt, 2008). In the Curie-Servier dataset, Basal-like tumors were identified as ER-, PR-, lack of HER2 overexpression IDC-NST tumors that express either cytokeratin 5/6 and/or cytokeratin 14 and/or Epidermial Growth Factor Receptor (EGFR). In the following, I will use both “TNBC” and “Basal-like” names, even though they are not strictly equivalent, to describe IDC-NST breast tumors that have a basal or TNBC related pattern.
Overall TNBC have high histological grades with a high mitotic index and they frequently harbor central tumor necrosis. These tumors are characterized by an impaired DNA repair process and harbor complex genomic rearrangements and more gains and losses than the luminal subtypes (Chin et al., 2006; Vincent-Salomon et al., 2007). It has also been shown that 85 % of the tumors of patients with BRCA1 mutations have a TNBC immunophenotype (Foulkes et al., 2003). Moreover, TNBC are associated to high levels of various proliferation genes such as Ki-67, and very frequent p-53 mutation (Mani´e et al., 2009).
From a clinical point of view, TNBC are relatively chemo-sensitive. Indeed, these tumors show more pathological complete response to neoadjuvant chemotherapy than other types of tumor (Rouzier et al., 2005). Showing pathological complete response means that the tumor is no longer detectable. The poor overall survival rate of patients with TNBC is explained by the fact that among those patients that do not show a complete response, there is a very high number of relapses (Podo et al.
2.3. BREAST TUMORS OF THE CURIE-SERVIER COHORT 35 (2010) and references therein). Alternative approaches to chemotherapy are currently explored such as targeting the EGFR, the topoisomerase 2A (TOP2A), c-MYC and vascular endothelial growth factor (VEGF) receptor (Podo et al. (2010) and reference therein). One of the most promising treatments at the moment is poly ADP-ribose polymerase (PARP) inhibition. In BRCA1-defective cells, inhibition of PARP leads to the accumulation of DNA double-strand breaks that are not correctly repaired due to the lack of functional BRCA1. This leads to tumor cell death (McCabe et al., 2006). In normal cells PARP inhibition has a limited effect due to active BRCA1. The general principal behind PARP inhibition is synthetic lethality (Tucker and Fields, 2003). Synthetic lethality occurs when two otherwise non-lethal changes result in cell death when present together. PARP inhibition showed promising results in mutation carriers (Fong et al., 2009). As mentioned earlier, many BRCA1-mutation carriers present TNBC and it has been hypothesized that at least a fraction of TNBC are BRCA1 deficient (Turner et al., 2006) due to the expression of ID4 (a negative regulator of BRCA1) or the epigenetic silencing of BRCA1 (Veeck et al., 2010; Evers et al., 2010). To conclude there is still no targeted therapy for TNBC available in routine clinical practice. Hopefully a better understanding of the biology of these tumors and their links to BRCA1 mutations will lead to the development of new treatments for these cancers.
2.3 Breast tumors of the Curie-Servier cohort
For the Curie-Servier project breast tumors of Luminal A, Luminal B, ER- / HER2+ and TNBC subtypes were selected and characterized by a pathologist (Anne Vincent Salomon, M.D./Ph.D.) of the IC using immunohistochemistry (IHC, Anne Vincent Salomon and Marion Richardson, M.Sc.). These tumors were obtained from patients treated at the IC (Biological Resource Center) and contain between 50% and 90% tumor cells. Many features of these tumors were collected such as the size of the tumor and the overall survival of the patients. Additionally normal tissues from mammoplastic surgery were collected by Anne Vincent Salomon and Fabien Reyal (M.D./Ph.D.). Finally, cell-lines characterized as TNBC in Neve et al. (2006) were obtained: 184B5, MDA-MB-436, HCC1143, HCC1187, BT20, HCC1937, MCF-12A, HCC38, Hs 578T, MCF-10A, MDA-MB-468, BT-549, HCC70, MDA-MB-157,
Figure 2.3: Summary of the samples of the Curie-Servier dataset and their Histological and Immunohis-tochemical characterization.
MDA-MB-231. All the information on the samples are summarized on Figure 2.3.
This means that the different subtypes are known before any of our analyses. This information can be used to confirm the groups we find, and also earlier for experimental design, in particular the information can be taken into account to determine batches and make sure batch effects are not responsible for the differences we observe between subtypes.
Part II
Genomic Analysis
Chapter 3
Chromosome aberrations
A B
Figure 3.1: Karyotype of two cells. (A) The karyotype of a normal cell, which contains two copies of each autosome. (B) The karyotype of a colon cancer cell, which typically shows many aberrations in chromosome number and structure. (From Alberts et al. (2002))
In a normal human cell, chromosomes go by pairs, excluding sex-determining chromosomes (see Figure 3.1 A). Thus, most regions of the genome are present in two copies, one coming from the mother and the other one coming from the father. This balanced state is called euploidy. Deviation from this normal state is called aneuploidy and is often observed in cancer cells (see Figure 3.1 B). This aneuploidy is often the consequence of the genomic instability of tumor cells. More precisely, due to an accumulation of defects in DNA repair pathways, in cell cycle check-points and in mitotic
segregation pathways, tumor cells often fail to properly carry out the duplication and segregation of chromosomes and accumulate chromosome aberrations (Aguilera and Gomez-Gonzalez, 2008).
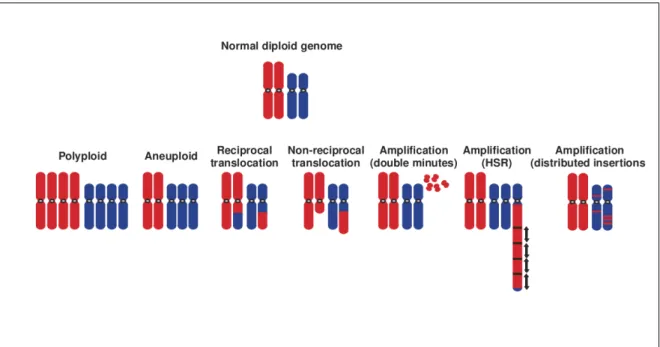
Figure 3.2: Schematic view of typical chromosome aberrations that are found in cancer cells. Based on Albertson et al. (2003)
Typical tumoral alterations are described below and schematically represented in Figure 3.2: Polyploidy A number of chromosomes have p copies with p greater than 2.
Euploidy At least one chromosome has an abnormal number of copies.
Translocation A chromosome translocation is a rearrangement of parts between chromosomes, whether or not they are from the same original pair. Translocations can be reciprocal, i.e. there is an exchange between the chromosomes and no regions are lost or gained. But translocations can be non-reciprocal, i.e. a part is gained and/or lost during the rearrangement. Translocations might create fusion genes or truncated genes.
Amplification A small contiguous portion of the genome is present in a high number of copies (from 4 to over 50 copies). These copies can be isolated fragments without centromeres and are called double minutes. Otherwise, they can be incorporated into chromosomes, either in nearly
41 contiguous homogeneously staining regions (HSR) or interspersed in the genome.
Figure 3.3: Schematic view of LOH aberrations that are found in cancer cells. Based on Albertson et al. (2003)
Moreover, chromosomal aberrations do not necessarily produce abnormal karyotypes. Indeed, it has been observed in cancer cells that both chromosomes of a given pair come from the same parent. One of the chromosomes has been lost and the other one has been duplicated. This is called Loss of Heterozygosity (LOH) without DNA copy number change (see Figure 3.3). When the LOH rearrange-ment concerns a whole chromosome, it is called isodisomy and when it impacts only a portion of the chromosome, it is called partial isodisomy or somatic recombination.
Some of these alterations are responsible for the development of cancer. For example, in ER-/ HER2+ breast tumors, an amplicon around the ERBB2 gene (also called HER2 gene) on chromosome 17 leads to the over-expression of the ERBB2 protein and this over-expression in turn induces the activation of the PI3K / AKT pathway, a pathway which is known to affect tumor development. This particular case is well known and the ERBB2 protein is now targeted by therapy. More generally, it is thought that lost regions harbor tumor suppressor genes while gained regions harbor oncogenes. Thus, the study of chromosome aberrations in tumor cells, and more specifically the identification of
frequent aberrations, is a way to identify new oncogenes or tumor suppressor genes.
3.1 Some technologies to study genomic rearrangements
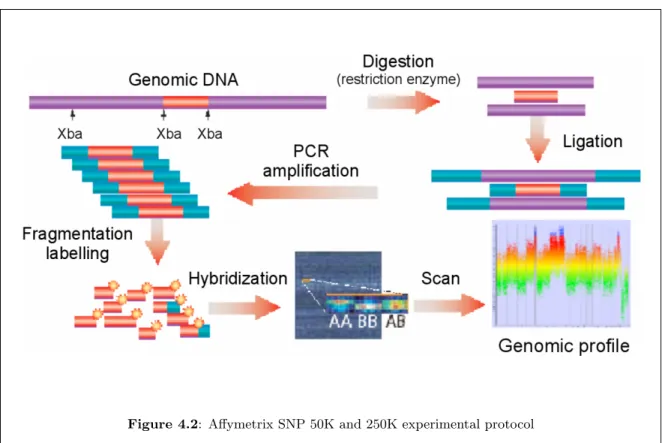
There are many different technologies to study these events such as Comparative Genomic Hybridiza-tion (CGH) arrays and Single Nucleotides Polymorphism (SNP) arrays. Historically, the genome-wide study of DNA copy number changes was performed using the CGH technique, which was developed in the early 1990s. In this technique, total genomic DNA is isolated from tumor and normal control cells, labeled with different fluorochromes and hybridized to normal metaphase chromosomes (Kallioniemi et al., 1992). This technique is therefore called chromosomal CGH. Differences in the tumor fluores-cence with respect to the control fluoresfluores-cence along the metaphase chromosomes are then quantified to reflect changes in the DNA copy number of the tumor genome. Subsequently, array CGH, where arrays of genomic sequences replaced the metaphase chromosomes as hybridization reporters, was es-tablished (Solinas-Toldo et al., 1997; Pinkel et al., 1998) and solved many of the technical difficulties and problems caused by working with cytogenetic chromosome preparations. The main advantage of array CGH is its ability to perform copy number analyses with a much higher resolution compared to chromosomal CGH (resolution smaller than a megabase compare to several megabases for chromoso-mal CGH). Array CGH has already been widely used in oncology for many purposes such as global analysis of copy number aberrations, identification of putative target genes, tumor classification or assessment of clinical significance of copy number changes (Kallioniemi, 2008). Pinkel and Albertson (2005) give details in their review about the technology and its application in oncology. Here, we will present only the general outline of the protocol (see Figure 3.4):
1. Total genomic DNA is isolated from a tumor sample (i.e. the test DNA) and from a normal sample (i.e. the reference DNA). Genomic DNA is then digested with a restriction enzyme and the obtained DNA fragments are labeled. The tumoral DNA is usually labeled with a red fluorochrome and the normal DNA with a green fluorochrome.
3.2. DNA COPY NUMBER PROFILES OF SNP AND CGH ARRAYS 43
Figure 3.4: Schematic view of the CGH protocol (From Philippe Hup´e).
a competitive hybridization between the tumoral DNA target sequences and the normal DNA target sequences.
3. After hybridization, the chip is scanned and the signal intensity is quantified for both the red and green wavelengths. Image files are created in which each pixel is given a red and a green intensity.
4. An image analysis software reconstructs the signal intensity for each spot.
In the case of SNP arrays, the protocol is quite similar except that there is no normal DNA reference.
3.2 DNA copy number profiles of SNP and CGH arrays
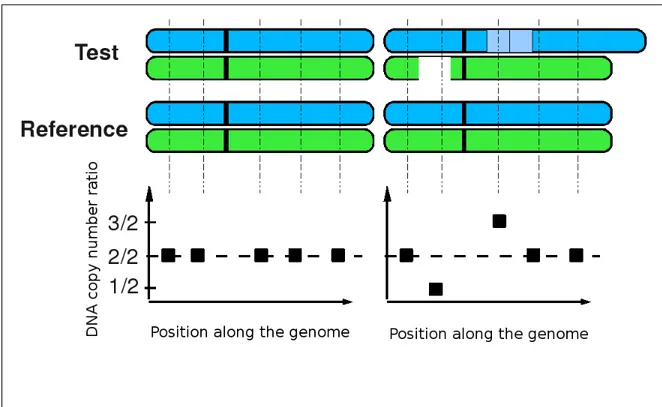
In CGH arrays, the DNA copy number is obtained by comparing the test sample with a normal reference sample. This is often done with the ratio of the measured intensity of the test sample and reference. For example, a ratio of 1 means that the usual 2 copies of DNA are present in the test
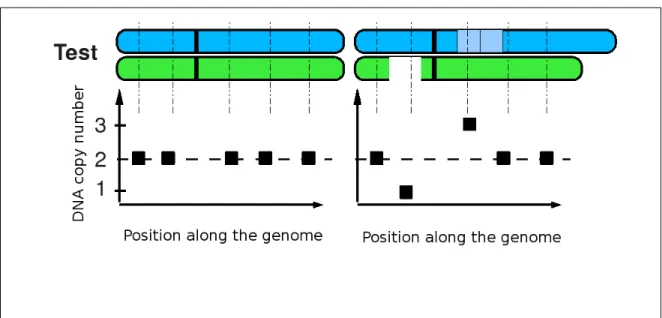
sample (see Figure 3.5). While doing this, one assumes that the DNA copy number of the reference is 2. However, it is not necessarily the case as copy number polymorphisms are common in the healthy population.
Figure 3.5: Illustration of chromosomes and the corresponding CGH profiles. Using CGH arrays, a test sample is compared to a reference. (Left) If the two samples have the same DNA copy number, the profile should be a set of points on the 2/2 ratio line. (Right) If there are differences between the samples, points in gained regions appear above the 2/2 ratio and points in lost regions appear below the 2/2 ratio.
The main difference between CGH and SNP arrays is that SNP arrays usually do not use a reference (see Figure 3.6). Moreover, the DNA copy number is not measured directly but rather computed as the sum of the intensities of both alleles. In this way, one observes differences between regions of the genome but it is not necessarily easy to determine the intensity that corresponds to 2 DNA copies. This is all the more true for TNBC as they harbor many rearrangements and one cannot assume that the mean or median intensity of all probes corresponds to the intensity of 2 DNA copies.
3.3. AN OVERVIEW OF CGH DATA ANALYSIS 45 the reference intensity of 2 DNA copies in TNBC (Popova et al., 2009).
Figure 3.6: Illustration of chromosomes and the corresponding SNP profiles. Using SNP arrays, a test sample is analyzed without any references. The level corresponding to 2 DNA copies is usually chosen as the mean or median intensity of the whole profile. (Left) If there is no DNA copy number changes, the profile should be a set of points on the same line. (Right) If there is some changes, points in gained regions appear above others and points in lost regions appear below others.
For both CGH and SNP arrays, we expect a limited number of possible values for the measured intensity. If we could measure the copy number almost continuously along the genome, we would expect a constant signal, except for a few abrupt changes corresponding to gains and losses. However, there are measurement errors and noise is observed around the signal, which complicates the analyses.
3.3 An overview of CGH data analysis
Many methods have been developed specifically to analyze CGH arrays (see the review by van de Wiel et al. (2010)). They can be divided into two categories: pre-processing and downstream methods.
Pre-processing methods are a critical step because their results affect any following analyses and their biological interpretation. Pre-processing usually consists in the following steps:
Control Assess the quality of the experiment via a number of checkpoints.
Normalization Remove artifacts that hamper our ability to extract the biological signal. Segmentation Divide the genome into regions sharing the same DNA copy number.
Calling Recover the DNA copy number (0, 1, 2, 3...) or at least try to make the difference between normal, gained and lost regions.
Once these different steps have been performed, many different types of downstream analyses can be performed depending on the biological or clinical questions. Many specific methodologies have been proposed to identify:
• recurrently aberrant regions (across tumors);
• new subgroups of cancer (unsupervised classification);
• markers associated to prognosis, diagnosis or other clinical variables of interest (supervised clas-sification or regression).
In the following chapters, I will highlight some of my contributions to the normalization (Rigaill et al., 2008) and segmentation (Rigaill et al., 2010c; Rigaill, 2010b) of these DNA copy number profiles.
Chapter 4
Normalization of DNA copy
number profiles
In microarray experiments, as in many experimental protocols, measurements are influenced by non-relevant factors that hamper our ability to extract the signal of interest. The intensity of a probe is affected by three elements:
• the biological signal, which is the level of the fragment of interest (either mRNA or DNA); • some systematic biases such as the probe GC content or spatial artifacts;
• some random factors that take into account the inevitable variability between repeated measure-ments.
In this context, normalization aims to remove the systematic biases while preserving the biological signal, namely the biological signal. The random factors cannot specifically be taken into account because they are random.
In this section, I will first give a short overview of current issues regarding microarray normalization. Then I will pinpoint some of the normalization specificities for tumor DNA copy number array. Finally, I will present the ITALICS method (Rigaill et al. (2008), the article is provided in subsection 4.4) that I developed to normalize Affymetrix 50K and 250K SNP arrays.
4.1 Short overview of microarray normalization
Microarray normalization is often referred to as a preprocessing step. Indeed, it is the first step of many microarray analysis pipelines. Therefore it influences the results of all further analyses and more importantly the biological interpretation of these results. Thus, it is a critical issue and an extensively studied problem. Many normalization methods have been proposed, especially for one-color gene expression microarrays, see Binder et al. (2010) for a review. There are two main reasons which make it difficult to find an efficient and understandable normalization method:
• knowledge about the underlying hybridization mechanisms is incomplete; • tools to assess the quality of a given normalization procedure are unsatisfactory. These two issues are further detailed below.
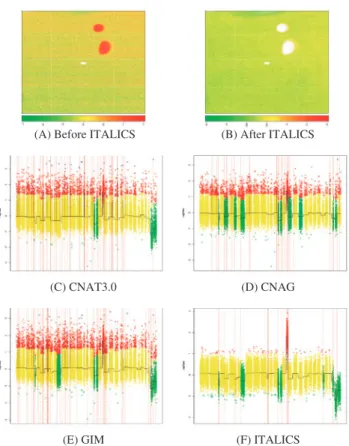
First, any microarray normalization procedure relies on a model that describes the relationship between the probe intensity, the level of the mRNA or DNA fragment of interest and some non-relevant phenomena. Some of the phenomena are relatively well understood, such as probe duplex formation in solutions which depends on the probe sequence. This can be described using a nearest neighbor thermodynamic model (SantaLucia, 1998) and seems to work quite well on microarrays (Binder et al. (2009) and reference therein). Moreover, quite recently, it has been shown that surface hybridization could be modeled using an adsorption model such as the Langmuir adsorption equation (Binder et al., 2008). Many other phenomena are less known and they control the specificity and sensitivity of a given probe such as steric hindrance, RNA or DNA secondary structure formation and probe-probe interactions (Zhang et al., 2003). Therefore, many normalization models are based on (sometimes questionable) statistical considerations rather than physical or thermodynamical considerations. For example, for mRNA expression arrays, it is generally assumed that the majority of genes are not differentially expressed and that the proportions of down-regulated and up-regulated genes are similar. Similarly, in the ITALICS method (Rigaill et al., 2008), the “mean intensity” of a given quartet (PM probe of the A and B allele) across a reference dataset was used to correct the measured intensity (see subsection 2.1 paragraph “Non-relevant sources of variation” on page 2 and subsection 2.2 paragraph
4.1. SHORT OVERVIEW OF MICROARRAY NORMALIZATION 49 “Non-relevant effect estimation” on page 3 of the ITALICS paper). We have empirically shown that this correction dramatically increases the quality of the data (see subsection 3.2 on page 4 of the ITALICS paper). This “mean intensity” is a very good surrogate of the sensitivity and specificity of the probe, yet we poorly understand what non-relevant effects it takes into account. Overall, normalizing microarrays is based on correcting their signal using two complementary types of information: biological and physical knowledge of the mechanisms and empirically validated normalization tricks.
The second issue, is the way to assess the quality of a given normalization procedure. Indeed, one would like to know which normalization method is the best or which method should be used in a given context. For two-color microarrays this is relatively easy and one can assess the performance of a given normalization method using an Anova (Kerr et al., 2000; Cui et al., 2003). That is not the case for one-color microarrays. To assess the performances of a one-color microarray normalization method one can use a benchmark dataset. In the case of expression profiling arrays, there are several, e.g. spike-in studies (Irizarry et al., 2003b) and dilution series (Bolstad et al., 2003). Based on these datasets, it is possible to compare the precision and accuracy of different methods or in other words their ability to reduce the variance without introducing any biases. These benchmark datasets are certainly not perfect to assess the quality of normalization methods and several other strategies and statistical criteria have been proposed (Galfalvy et al., 2003; Harr and Schl¨otterer, 2006; Jiang et al., 2008; Ploner et al., 2005). Note that these other strategies are certainly not perfect either. Like the benchmark datasets, they should be considered with caution. For example Ploner et al. (2005) proposed an interesting criteria based on the overall correlation of random sets of genes and argued that on average the correlation should be 0. However, this criterion cannot be used alone because it is quite clear that to achieve this goal it is enough to normalize all intensities to 1 and thus one removes simultaneously all non-relevant and relevant effects. An alternative approach is the use of quantitative real-time PCR as a gold standard technique. Unfortunately, it can be used for only a few measurements. Overall, assessing the quality of a normalization procedure is a complex question and subject to many controversies.