1
Bio-Ökonomie: Chancen, Risiken und
Perspektiven des gesamten Systems
Andreas Pfennig
Products, Environment, and Processes (PEPs) Department of Chemical Engineering
Université de Liège
www.chemeng.uliege.be/pfennig [email protected]
gehalten beim dem VT Kolloquium der Technischen Universität Hamburg, TUHH 17.01.2019
Quadratur des Kreises
kurzes CV
4
1979 bis 1984 Studium Verfahrenstechnik an der RWTH Aachen 1984 bis 1985 Forschungsaufenthalt bei J.M. Prausnitz, Berkeley, USA 1985 bis 1987 Promotion RWTH Aachen
1988 bis 1995 Habilitation, TU Darmstadt 1995 bis 2011 Professor, RWTH Aachen 2011 bis 2014 Professor, TU Graz, Österreich
seit 2014 Professor am Department of Chemical Engineering, University of Liège, Belgien
Datenbanken und Copyright
• IPCC illustrative model pathways:
Daniel Huppmann, Elmar Kriegler, Volker Krey, Keywan Riahi, Joeri Rogelj, Steven K. Rose, John Weyant, et al.,
IAMC 1.5°C Scenario Explorer and Data hosted by IIASA.
Integrated Assessment Modeling Consortium & International Institute for Applied Systems Analysis, 2018.
doi: https://doi.org/10.22022/SR15/08-2018.15429
url: https://data.ene.iiasa.ac.at/iamc-1.5c-explorer, release 1.0
• UN WPP population prospects:
United Nations, Department of Economic and Social Affairs, Population Division (2017). World Population Prospects: The 2017 Revision, DVD Edition.
https://population.un.org/wpp/
• BP Statistical Review of World Energy 2018:
https://www.bp.com/en/global/corporate/energy-economics/ statistical-review-of-world-energy/downloads.html
• UN FAOSTAT zu Landnutzung und Ernährung:
http://www.fao.org/faostat/en
• CDIAC: CO2historical data:
1960 1980 2000 2020 2040 2060 330 380 430 480 530 580 Quelle: http://www.esrl.noaa.gov/gmd/ccgg/trends/ +1.0°C C O2 i n p p m Jahr +1.5°C +2.0°C +2.5°C
COP 21 Paris agreement UN, Kyoto protocol
G. H. Brundtland, Our Common Future G. O. Barney, The Global 2000 Report
D. L. Meadows, Club of Rome, The Limits to Growth
CO
2
-Gehalt der Atmosphäre
7
UN Climate Conference 21, 2015, Paris
Article 2.1:
This Agreement ... aims to strengthen the global
response to the threat of climate change ... by:
Holding the increase in the global average
temperature to well below 2 °C above
pre-industrial levels and to pursue efforts to limit
the temperature increase to 1.5 °C above
pre-industrial levels, recognizing that this would
significantly reduce the risks and impacts of
climate change...
einige Haupt-Triebkräfte
Weltbevölkerung
7.600.000.000
Nahrungsmittel
2.8 kg/(cap d)
Energie
21.000 kWh/(cap a)
Materialien
ca. 0.9 kg/(cap d)
fossile Ressourcen
5.6 kg/(cap d)
Landfläche
Agrarfläche: 7.000 m
2/cap
10DIE Haupttriebkraft
Weltbevölkerung
7.600.000.000
Nahrungsmittel
2.8 kg/(cap d)
Energie
21.000 kWh/(cap a)
Materialien
ca. 0.9 kg/(cap d)
fossile Ressourcen
5.6 kg/(cap d)
Landfläche
Agrarfläche: 7.000 m
2/cap
13
Blick in die Zukunft
Ansatz zur Modellierung
kein
IAM (integrated assessment model)
stattdessen aufbauend auf
wesentlichen Bilanzen
:
Einfluss individueller Parameter direkt erkennbar
Haupteinflüsse deutlich
negativer Einfluss von zu detaillierten Modellen:
H. Hasse, Thermodynamics of Reactive Separation.
In: K. Sundmacher, A. Kienle (Eds.): Reactive Distillation
Status and Future Directions. Wiley-VCH, Weinheim, 2003
1960 1980 2000 2020 2040 2060 2080 2100 0 2 4 6 8 10 12 14 W e lt b e v ö lk e ru n g i n M ill ia rd e n Jahr niedrige Variante mittlere Variante hohe Variante h e u te Quelle: United Nations
World Population Prospect 2017 Revision
UN-Szenarien zur Weltbevölkerung
16 2000 2010 2020 2030 2040 2050 7 8 9 10 11 W e lt b e v ö lk e ru n g 2 0 5 0 in M illia rd e n Publikations-Jahr hohe Variante mittlere Varian te niedri ge V arian te
2000 2010 2020 2030 2040 2050 7 8 9 10 11 W e lt b e v ö lk e ru n g 2 0 5 0 in M illia rd e n Publikations-Jahr hohe Variante mittlere Varian te niedri ge V arian te 11,03 Milliarden in 2050
Entwicklung der UN-Vorhersage für 2050
18 1960 1980 2000 2020 2040 2060 2080 2100 0 2 4 6 8 10 12 14 W e lt b e v ö lk e ru n g i n M ill ia rd e n Jahr niedrige Variante mittlere Variante hohe Variante h e u te 11,03 Milliarden in 2050 Quelle: United Nations
World Population Prospect 2017 Revision
UN-Szenarien zur Weltbevölkerung
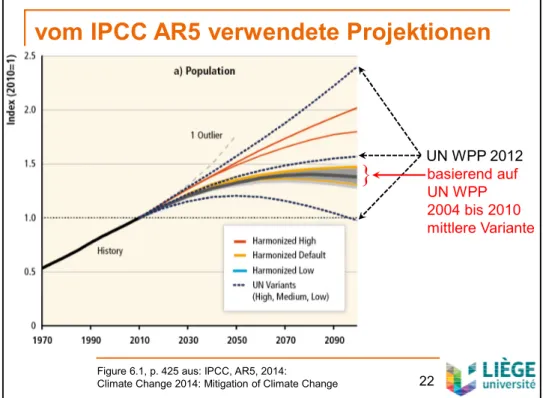
vom IPCC AR5 verwendete Projektionen
22
Figure 6.1, p. 425 aus: IPCC, AR5, 2014: Climate Change 2014: Mitigation of Climate Change
UN WPP 2012
basierend auf UN WPP 2004 bis 2010 mittlere Variante 1000 10000 100000 1 2 3 4 5 6 7 Irak D.R. Congo Pakistan China Indien USA Saudi Arabien Israel Angola Nigeria F e rt ili tä t in K in d e r p ro F ra uBIP pro Kopf in US-$/(cap a)
Niger
Fazit Weltbevölkerung
26
hohe Bevölkerungs-Variante der UN
gleich realistisch wie mittlere Variante
in 2100 zwischen 11,2 und 16,5 Mrd. Menschen
starker Einfluss auf Ressourcen-Verbrauch und
Abfall-Produktion
starker Einfluss auf Welt-Hunger
1980 2000 2020 2040 2060 2080 2100 0 10000 20000 30000 40000 50000 60000 globaler Mittelwert P ri m ä re n e rg ie v e rb ra u ch i n k W h / ( ca p a ) Jahr OECD-Länder Bevölkerung: 1,3 Mrd. Nicht-OECD-Länder Bevölkerung: 6,1 Mrd. Projektion
Entwicklung des Pro-Kopf-Verbrauchs
1995 2000 2005 2010 2015 2020 0 10 20 30 40
Wachstumsrate = Zunahme pro Jahr
W a ch s tu m sr a te i n % /a ( 3 -J a h re s-M itt e l) Jahr solar + Wind Wasserkraft
jährliche globale Wachstumsraten
29 1990 2000 2010 2020 2030 2040 2050 0.01 0.1 1 10 % jährliche Zunahme: 30 25 20 S u b s tit u ti o n s ra te in % /a Jahr Wind + solar
Zukünftiges Wachstum Wind & solar
Substitutionsrate: wie viel Primärenergie
in einem Jahr zusätzlich durch Wind- und Solar-Energie ersetzt wird. im globalen Mittel!
1990 2000 2010 2020 2030 2040 2050 0.01
0.1 1 10
Mittel letzte 20 Jahre Primärenergie W a c h s tu m s - / S u b s ti tu tio n sr a te i n % /a Jahr Wind + solar ökonomische Lebenserwartung Kraftwerk
maximale Substitutionsrate
32max. Substitutionsrate: 3.0%/a
max. Substitutionsrate: 2.0%/a
1990 2000 2010 2020 2030 2040 2050 0.01 0.1 1 10 S u b s tit u ti o n s ra te in % /a Jahr hohe Bevölkerungs-Variante Wind + solar
Wachstumsrate: 30%/a 20%/a
drei betrachtete Szenarien
33
Substitutionsrate: wie viel Primärenergie
in einem Jahr zusätzlich durch Wind- und Solar-Energie ersetzt wird. im globalen Mittel!
copyrights data see:
IMP P1 to P4: https://data.ene.iiasa.ac.at/iamc-1.5c-explorer WPP: https://population.un.org/wpp/
Biogas Biokraftstoff
Strom Wasserstoff
Endenergie effektive Energie Endenergie effektive Energie Strom Fernwärme Erdgas Kohle Erdöl Erneuerbare Transport Beleuchtung, EDV Dampferzeugung Industrieöfen stationäre Motoren Raumheizung Klimatisierung
heute in 2050
Transport Beleuchtung, EDV Dampferzeugung Industrieöfen stationäre Motoren Raumheizung KlimatisierungKonsequenzen der Energiewende
34 1980 2000 2020 2040 2060 2080 0 10 20 30 40 50 60 hohe Bevölkerungs-Variante
Energie-Szenarien (in %/a):
20 - 2,0: am einfachsten 25 - 2,5: mittleres 30 - 3,0: herausfordernd +1,93 °C +1,66 °C +1,51 °C CO 2 -E rz e u g u n g i n G t/ a Jahr hist oris ch, k eine Sub stitu tion
2020 2030 2040 2050 2060 1 2 3 4 5 6 7 8 9 10 mittlere Bevölkerungs-Variante +2,0°C m in im a l n ö ti g e S u b s ti tu tio n sr a te i n % /a
Start-Jahr der erhöhten Anstrengungen +1,5°C
hohe
Bevölkerungs-Variante
Konsequenzen verzögerter Anstrengungen
40 1970 1980 1990 2000 2010 0.0 0.2 0.4 0.6 0.8 1.0 1.2 1.4 1.6 1.8 2.0 Bio-Energie Bio-Kraftstoff Wind Geothermie & Wasserkraft P ri m ä re n e rg ie -V e rb ra u c h in G to e Jahr fossil & nuklear Solarenergie
EU Primärenergie-Verbrauch
41Fazit Energiewende
vollständiger Umbau wesentlicher Industrie-Sektoren
Vulnerabilität der Volkswirtschaften steigt
wir haben das 1.5°C-Klimaziel verschlafen!
nicht nur mehr Solar- und Windenergie,
auch neue Endnutzer-Technologien
für 2.0°C: 20%/a - 2%/a bis 2075
für 1.5°C: 30%/a - 3%/a bis 2050
44 19900 2000 2010 2020 2030 200 400 600 800 1000 u n te re rn ä h rt e M e n sc h e n i n M ill io n e n Jahr historische Daten jüngstes Ziel UN Millenium
Development Goals UN Sustainable Development Goals
2000 2020 2040 2060 2080 2100 0 1000 2000 3000 4000 5000 6000 7000 8000 9000 10000 Biomaterialien Brennstoffe Weiden pflanzenbasierte Nahrungsmittel Wälder Wiesen und Weiden L a n d fl ä c h e m 2 /c a p Jahr Ackerland Futtermittel verbleibender Wald
Landfläche: ≈ 1.5°C, hohe Pop.-Variante
50 in 2100: CO2 465 ppm T 1.51 °C 2000 2020 2040 2060 2080 2100 0 1000 2000 3000 4000 5000 6000 7000 8000 9000 10000 Biomaterialien Brennstoffe Weiden pflanzenbasierte Nahrungsmittel Wälder Wiesen und Weiden L a n d fl ä c h e m 2 /c a p Jahr Ackerland Futtermittel Wälder +
ab 2060: Aufforstung, Bio-Energie , etc.
Landfläche: ≈ 1.5°C, mittlere Pop.-Variante
51
in 2100: CO2 460 ppm T 1.47 °C
2000 2020 2040 2060 2080 2100 0 1000 2000 3000 4000 5000 6000 7000 8000 9000 10000 Biomaterialien Brennstoffe Weiden pflanzenbasierte Nahrungsmittel Wälder Wiesen und Weiden L a n d fl ä c h e m 2 /c a p year Ackerland Futtermittel Wälder +
Aufforstung, Bio-Energie, etc.
Landfläche: ≈ 1.5°C, mittlere Pop., vegan
52
in 2100: CO2 460 ppm T 1.47 °C
Fazit Teller vs. Tank, Bio-Ökonomie
mit Verhaltensänderung
(maximal 2 Kinder, pflanzenbasierte Ernährung):
vorhandene Technologie erlaubt nachhaltiges Wohlergehen
ohne Verhaltensänderung:
•
Technologien zu maximalem Fortschritt gezwungen
•
mehr Menschen unterernährt
•
mehr Wald wird abgeholzt
Verhaltensänderung zwingend
Unterstützung weniger entwickelter Länder auf Augenhöhe
chemical exergy of various materials
75 0 10 20 30 40 50 60 80 100 120 140 PA 6 .6 poly styr ene PET PVC poly prop ylen e poly carb onat e H2O, CO2 methanol glucose amylose ethanol glycerol lactic acid CO poly lact ic a cid poly ethy lene ethene plant oil coal crude oilmethane, natural gas
c h e m ic a l e xe rg y i n M J /k g hydrogen
fossil biomass intermediates products feedstock glucose fermentation net reaction
fossil
after: Philipp Frenzel, Rafaela Hillerbrand, Andreas Pfennig: Increase in energy and land use by a bio-based chemical industry. Chemical Engineering Research and Design 92 (2014 ) 2006-2015
bio-based?
elements in chemical industry by weight
76
PE
PLA
H O fossil raw materials
bio-based feedstock conventional polymers bio-based polymers
lignin
starch, cellulosehemicellulose glucose oleic acid natural gas crude oil coal C PET PHB water CO2 +H2-H2O -CO2 -H2O
source: Philipp Frenzel, Rafaela Hillerbrand, Andreas Pfennig: Increase in energy and land use by a bio-based chemical industry. Chemical Engineering Research and Design 92 (2014 ) 2006-2015
questions to be answered
What are the boundary conditions for a
bio-based or a CO
2
-based economy?
Which options are possible?
77
feasible reactions
0 10 20 30 40 50 60 80 100 120 140 H2O CO 2 methanol glucose ethanol ethene c h e m ic a l e xe rg y i n M J/ k g hydrogen net reactiondemand
fossil feedstock today used for:
4% to petrochemicals
2.5% to jet fuel
x% in total as combustible or materially in chemical and
steel industry
in scenarios for 2050:
440 m
2/cap for bio-materials
plastics ≈ 80 kg/(cap a)
i.e. intensified recycling
feedstock all chemicals ≈ 125 kg/(cap a)
680 m
2/cap for 10% bio-combustibles
79
options for bio-based chemicals 2050
80
gen feedstock products radius
km fi rs t g e n e ra ti o n sugar beet sugar or ethanol + CO2 10.4 ethanol 14.6 ethylene 18.7 sugar cane sugar or ethanol + CO2 7.5
ethanol 10.5 corn sugar or ethanol + CO2 13.4
ethanol 18.7 wheat sugar or ethanol + CO2 17.5
ethanol 24.5 oil palm plant oil 11.4 rape seed plant oil 30.1
s
e
c
o
n
d miscanthus/reeds sugar or ethanol + CO2 5.7
ethanol 7.9 wood sugar or ethanol + CO2 14.8
ethanol 20.7 th ir d corn straw sugar or ethanol + CO2 20.1 ethanol 28.2 wheat straw sugar or ethanol + CO2 23.2
ethanol 32.5 arable land 2050 0 500 1000 1500 area in m2/cap goal ranges:
maximum national and world average productivity projected for 2050 color:
■technically realized
■partly pilot-plant radius for capacity of 250 000 t/a
bio- vs. CO
2
-economy
bio-economy:
existing technology, comparable to food processes
requires agricultural land area
energy requirements comparably small
drop-in possible
protein to food
large side and recycle streams
CO
2-economy:
no agricultural land area required
requires a lot of energy
not yet installed on large scale (economically feasible?)
drop-in possible
after net-decarbonization mostly from air
81
typical area/equipment demand
land area required feedstock & technology
m
2/ (t/a)
1 to 3
bio-technological processes
(alcohol from sugar)
0.2 to 0.5
direct biomass conversion
(sugar from starch)
0.03 to 0.1
chemical process
(e.g. steam cracker)
chances, challenges
bio-based and CO
2
-based chemistry:
various options
bio-economy
≠
only bio-technology
bio-economy
≠
automatically sustainability
economics, ecologics,
ethics
big chance
: real circular economy
all happens in ±30 years (or it is too late)
87
individuelle Akteure
93stable
sustainable
development
individuelle Bürger
Firmen-Manager
Politiker
kontrollieren
verhandeln
Systemsicht
entscheidend
Medien, NGOs,
Religionen, ...
- Legitimation?
- vertreten wen?
- legitime Ziele?
- wie kontrolliert?
- Transparenz!
Bénard convection setup
94
Fazit
• Klimaziele mit vorhandener Technologie erreichbar,
aber muss systematisch in größerem Maßstab umgesetzt werden • deutlich erhöhte globale Anstrengungen, Wachstum 20 - 30%/a
• Nahrungsversorgungkritisch,
aber die Änderung der individuellen Entscheidungen ist unerlässlich: - Anzahl der Kinder
- pflanzliche vs. tierische Nahrung
• sowohl Bio- als auch CO2-Ökonomie können funktionieren • Bio-Masse der dritten Generation reicht nicht aus
• Minimierung der Bioenergie: Teller vs. Tank
• CO2-Ökonomie: keine Konkurrenz um Landfläche, aber Ökonomie?
• Entwicklungs-Kipppunktist möglich
• Systemsichtstatt Fokussierung auf eigene Interessen
• Ethik: individuell verantwortlich, nicht nur Frage von Politik & Technik
• es muss jetzt passieren, sonst dramatische Situation zu unseren Lebzeiten und denen unserer Kinder
96
relevante Publikationen
98
Pfennig, A. (2007). Supporting debottlenecking of global human processes by applying appropriate balances. Biotechnology Journal, 2(12), 1485-1496. Pfennig, A. (2007). Globale Bilanzen als Wegweiser für nachhaltiges
Wirtschaften. Chemie Ingenieur Technik, 79(12), 2009-2018.
Frenzel, P., Fayyaz, S., Hillerbrand, R., Pfennig, A. (2013). Biomass as Feedstock in the Chemical Industry - An examination from an Exergetic Point of View. Chemical Engineering and Technology, 36(2), 233-240. Frenzel, P., Hillerbrand, R., Pfennig, A. (2014). Exergetical Evaluation of
Biobased Synthesis Pathways. Polymers, 6(2), 327-345.
Frenzel, P., Hillerbrand, R., Pfennig, A. (2014). Increase in energy and land use by a bio-based chemical industry. Chemical Engineering Research and Design, 92, 2006-2015.
Frenzel, P., Pfennig, A. (2014). Bewertung der steigenden Nachfrage nach Diesel-Kraftstoffen hinsichtlich ihrer CO2-Emissionen.
In U., Bachhiesl (Ed.), Innehalten und Ausblick: Effektivität und Effizienz für die Energiewende (pp. 1-9).
Playlist auf YouTube
99
https://www.youtube.com/
suche bei YouTube nach:
Andreas Pfennig Sustainability
www.chemeng.uliege.be/successfulfuture
www.vision3000.eu (under construction)
Bio-Ökonomie: Chancen, Risiken und
Perspektiven des gesamten Systems
Andreas Pfennig
Products, Environment, and Processes (PEPs) Department of Chemical Engineering
Université de Liège
www.chemeng.uliege.be/pfennig [email protected]