Soil Sci. Soc. Am. J. doi:10.2136/sssaj2011.0376 Received 4 Nov. 2011.
*Corresponding author ([email protected]) © Soil Science Society of America, 5585 Guilford Rd., Madison WI 53711 USA
All rights reserved. No part of this periodical may be reproduced or transmitted in any form or by any means, electronic or mechanical, including photocopying, recording, or any information storage and retrieval system, without permission in writing from the publisher. Permission for printing and for reprinting the material contained herein has been obtained by the publisher.
Turbulence Effect on Gas Transport in
Three Contrasting Forest Soils
Soil Physics
T
he production of CO2 in the soil by roots, microorganisms, and macro-fauna not only varies temporally and spatially on the plot and the land-scape level, but also vertically with soil depth. Using chamber techniques it is possible to address the spatial and the temporal variation of the CO2 efflux at a site. However, it is impossible to gain information about the vertical distribution of CO2 sources within the soil profile, which is important to improve our under-standing of the influence of parameters varying with depth. The gradient method (DeJong and Schappert, 1972; Davidson et al., 2006; Massman, 2006; Pumpanen et al., 2008; Schack-Kirchner et al., 2011) could potentially overcome this limita-tion. Although the main gas transport process in soils is diffusion, advection can be important under certain circumstances such as large changes in barometric pressure (Clements and Wilkening, 1974; Elberling et al., 1998), a rising ground water table (Jiao and Li, 2004; Maier et al., 2010), or wind-induced stationary pressure differences across topographical features (Amos et al., 2009; Bowling and Massman, 2011). This advective contribution can be integrated in the gradient method using a suitable gas transport model (e.g., Fang and Moncrieff, 1999). TheMartin Maier*
Helmer Schack-Kirchner Institute of Soil Science and Forest Nutrition
Univ. of Freiburg
79085 Freiburg im Breisgau, Germany Marc Aubinet
Stéphanie Goffin
Unité de Physique des Biosystèmes Faculté Universitaire des Sciences Agronomiques de Gembloux 5030 Gembloux, Belgium Bernard Longdoz Florian Parent
Unité d’Ecophysiologie forestière INRA Centre de Nancy
F54280 Champenoux, France
Atmospheric turbulence can affect soil gas transport, and thus violates the assumption that molecular diffusion is the only relevant transport mechanism in the soil. Due to the oscillating character of turbulence-induced pressure pumping the net vertical air flow into/out of the soil is zero. Yet, the dispersion processes induced by the oscillating air movement in the soil pores enhance the gas exchange in the soil, and should be considered when the gradient method is applied. We developed a simple lab method to test the impact of turbulence-driven pressure pumping on soil gas transport using neon as a tracer gas. The experiment was conducted using soil core samples from three contrasting forest sites. The ratio of air permeability and air-filled pore-volume, ka/ε, was found to be suitable to assess the sensitivity of soil gas transport to the pressure-pumping effect. The pressure-pumping effect reached up to 60% of the diffusive flux rates depending on the intensity of pressure pumping. We conclude that the turbulence effect can substantially influence soil gas transport in field studies, especially at sites with a high ka/ε value >1000 µm2. Therefore, we recommend taking this effect into account when soil gas flux is determined using the gradient method.
Abbreviations: a, dispersivity; Cout, neon concentration at the chamber outlet; ε,
air-filled pore-space; D0, diffusion coefficient in air; Ddisp, dispersion term; Ddisp/D0, relative dispersion coefficient; Dres, resulting diffusivity; DS, effective gas diffusion coefficient, DS/
D0, relative diffusion coefficient; ka, air permeability, κp, pressure diffusivity; η, viscosity of the air; p, pressure fluctuations; P0, mean atmospheric pressure; v, gas velocity.
major challenge here is the measurement of the pressure gradient, which can be hardly detectable (Maier et al., 2010).
In addition to these static pressure gradients, resulting from low-frequency pressure changes (time scale of hours to days), there are also high-frequency pressure fluctuations (>0.1 Hz) due to atmospheric turbulence. Field studies showed that these high-frequency pressure fluctuations can strongly influence soil gas concentrations (Hirsch et al., 2004; Seok et al., 2009; Flechard et al., 2007, Maier et al., 2010), and hence also soil gas transport and efflux. It is important to note that high-frequency pressure fluctuations do not induce a persisting pressure gradient as wind with laminar flow over topographical features does. If laminar wind is flowing steadily, for example, over a rock pile, a persistent pressure difference between the upwind to the downwind side can result in a continuous air flow through the porous pile (Amos et al., 2009). But in the case of a flat but complex surface, such as a plain covered by forest, wind will only induce turbulent flow with oscillating pressure fluctuations, and the net air flow into or out of the soil is zero. Nevertheless the observed effect on soil gas concentrations occurs throughout the entire profile (Seok et al., 2009; Maier et al., 2010). The pressure pumping induces an oscillating flow in the soil pores that seems to “enhance the diffusion” of the soil gas. This effect of turbulence-driven pressure pumping can be attributed to dispersion processes (Takle et al., 2004). Fukuda (1955) theoretically examined the movement of air in soil due to “wind gustiness”. Some years later, Scotter and Raats (1968) presented results from an experiment using a piston to impose a small sinusoidal movement on the air in a cylinder packed with sand. They observed an enhancement of gas exchange through the sand cores, and thus could clearly demonstrate the importance of the dispersion effect due to oscillating air flow. Recent research about gas dispersion in the soil focused on the dependence of dispersivity on substrate type (Hamamoto et al., 2009; Gidda et al., 2006; Sharma and Poulsen, 2010). The set-up used in these experiments is designed to accurately determine the dispersion induced by continuous gas flow and not by oscillating gas flows. To model the transport of contaminants, for example, by soil vapor extraction, these measurements are close to reality. Yet, this standard method (e.g., Hamamoto et al., 2009) does not allow relating the driving force (turbulence), the oscillating flow due to pressure pumping, and the effect of “enhanced diffusion”.
Modeling CO2 flux in a snowpack, Massman and Frank (2006) integrated diffusion, viscous flow, and also dispersion into the gradient method. Based on modeling with synthetic pressure-pumping data, Poulsen and Møldrup (2006) also emphasized the importance of pressure pumping and addressed the crucial role of soil physical parameters on soil-atmosphere gas exchange. There are several transfer functions available that can be used to derive the parameters that are difficult to measure, for example, the diffusion coefficient DS, from parameters that can be easily determined, for example, the air-filled pore-volume (Millington, 1959; Moldrup et al., 1999). Yet, these functions are not able to fully reflect site-specific factors, which can be crucial if the relevance of pressure pumping must be evaluated for different sites.
In this paper (i) we discuss the transport mechanisms underlying the turbulence-driven pressure pumping and present a conceptual model. We propose to integrate the pressure-pumping induced dispersion and the diffusion as “apparent diffusion”, which easily could be used in field studies applying the gradient method. (ii) We examine the effect of pressure pumping on gas transport through undisturbed soil samples from three sites using a new experimental design. The experimental data are analyzed to evaluate the impact of relevant soil physical parameters on the sensitivity of soil gas transport to pressure pumping. The laboratory results help us to assess the sensitivity of the soil to the pressure-pumping effect at the three forest sites where the gradient method is currently applied.
TurBuLence-Driven PreSSure PuMPinG
The amplitudes of high-frequency pressure fluctuations are very small compared to the barometric pressure. Hence, the vertical air flow into/out of the soil is very small compared to the depth of a soil (a pressure fluctuation of 10 Pa can compress the soil air column by 0.1 mm, if a barometric pressure of 100 kPa and a soil depth of 1 m is assumed). Though, the movement of the soil air column can be substantial compared to the diameter of the soil pores. As a result of the alternating direction of the pressure fluctuation, the net vertical air flow into/out of the soil is zero, although air flow occurs within the soil pores.The effect of turbulence-driven pressure pumping on soil gas transport can be basically explained by dispersion induced by the oscillating airflow in the soil pores. The phenomenon of dispersion is well-known, for example, from contaminant transport in ground water (Delgado, 2006), but is also relevant in the gas phase of porous media (Scotter and Raats, 1969; Costanza-Robinson and Brusseau, 2002).
Generally, the dispersion in soil pores can be attributed to molecular diffusion and mechanical mixing components. Figure 1 visualizes the gas transport in a soil pore driven only by diffusion (left), and additionally driven by pressure pumping (middle: downward movement of the soil air column; right: upward movement). The enhancement of the gas transport due to pressure pumping can be mainly explained by three effects.
First, dead-end pores do not contribute to the gas transport under calm conditions, and there is no concentration gradient between dead-end pore and main pore (Fig. 1 left: A). But when the air column is oscillating, the vertical concentration gradient in the main pore results in an additional, lateral concentration gradient between the dead-end pore and the main pore with oscillating direction (Fig. 1 middle, right: A). When the air column in the main pore is below the neutral point, the lateral concentration gradient leads to diffusion of CO2 molecules into the main pore (Fig. 1 middle: A). When the air column is above the neutral point (that means air from a deeper position and a higher CO2 concentration is shifted upward in the main pore), the CO2 molecules diffuse from main pore into the dead-end pore, “loading” the dead-end pore with CO2 (Fig. 1 right: A). Thus, the oscillating air acts as a “ladder”.
Second, there is mechanical mixing of soil air at the intersection of pores (Fig. 1 middle, right: B). Because of different permeability, the flow rate of air differs between the soil pores leading to horizontal concentration heterogeneity, and finally to an irreversible mixing of air with different CO2 concentrations.
Third, even within a single pore the gas velocity differs depending on the distance to the pore wall due to wall friction. As a consequence the concentration isolines, which are straight under calm atmospheric conditions, become curved under turbulent conditions due to pressure pumping (Fig. 1:C). When the oscillating air column is below the neutral point, the CO2 molecules close to the wall diffuse toward the center of the pore (Fig. 1 middle: C) and are then transported upward. As soon as the air column is above the neutral point, the direction of the diffusion is reversed toward the pore wall by diffusion (Fig. 1 right: C). Therefore the CO2 molecules preferentially use the upward movement of the oscillating air column.
Theoretically, in a vertically homogeneous soil, gas transport can be calculated using the advection–diffusion–dispersion equation:
(
S)
22C D v v C S
t z z
∂ = + α ∂ - ∂ +
∂ ∂ ∂ , [1]
where C is the concentration of the gas species (mmol mol–1), t
is time (s), DS is the gas diffusion coefficient in the soil (m2 s–1),
a is the dispersivity (m), z is the depth (m), S is the source term (mmol mol–1s–1), and v (m s–1) is the vertical velocity of the
air-flow. The dispersion coefficient Ddisp (m2 s–1) is the product of a
and v, Ddisp=αυ, where v is an absolute value because disper-sion happens in both directions and is always positive. If we ap-ply Eq. [1] to the turbulence-driven pressure pumping on a time scale larger than 5 min, the mean of v becomes zero, because of the oscillating character of the flow. Hence, the advective contri-bution to the gas transport is zero. However, the instantaneous gas velocity and thus the mean absolute value of v is not zero and we have to consider dispersion. It is Ddisp that represents the pressure-pumping effect, which we want to integrate in the modeling of field studies. We define the sum of the diffusion and dispersion coefficients as the resulting exchange coefficient Dres (m2 s–1): D
res = DS +Ddisp. Hence, the pressure-pumping
induced dispersion effect can be dealt with as an additive term in the regular diffusion equation using Dres instead of DS.
The dispersivity a mainly depends on the geometry of the air-filled pores (Costanza-Robinson and Brusseau, 2002; Sharma and Poulsen, 2010), while the mean |v| depends on the characteristics of the pressure fluctuation at the surface and the physical properties of the soil (Poulsen and Møldrup, 2006). The |v| value at a depth is linked to the penetration of pressure fluctuations p (Pa) into the soil that can be obtained using (Fukuda, 1955):
2 2 p
p
p
t
z
∂
= κ
∂
∂
∂
, [2]Equation [2] is a diffusion-like equation, in which the pressure diffusivity κp (m2 s–1) is described by:
0 a
p
k P
κ =
ε η
, [3]where ka is air permeability (mm2), e is air-filled pore-volume
(m3 m–3), P
0 the mean atmospheric pressure (Pa), and η is the
viscosity of the air (mPa s–1). While P
0 and η represent the
influ-ence of the fluid, ka and e reflect the dependence on physical soil properties. A higher ka/e ratio (mm2) results in higher pressure
diffusivity, and thus an easier and deeper penetration of pressure fluctuations into the soil.
Based on Eq. [1–3] and Darcy´s law, Massman (2006) calculated the resulting three-dimensional pressure field and gas velocity v for a layered medium. The resulting equations were used to derive reference values of Ddisp for our laboratory experiment results. However, this physically-based model needs many input parameters that are difficult to obtain in the field.
MATeriALS AnD MeTHODS
Description of the Sites
Three different forest sites (Hartheim, Germany; Hesse, France; Vielsalm, Belgium) were chosen to take undisturbed soil core samples at different depths. A meteorological tower is present at each experimental site to measure the main meteorological variables including wind speed and friction velocity. The three sites differ largely in their stand characteristics and soil properties (Table 1). The Scots pine stand at the Hartheim site has a sparse canopy and a dense understory, while the beech stand at Hesse and the mixed stand at Vielsalm have a dense canopy and no understory. The soil at Hartheim has a high porosity and is well aerated, while porosity and aeration at Vielsalm are reduced due to soil compaction. At Hesse the aeration of the topsoil is intermediate, but the subsoil shows stagnic properties.
Standard Measurements of Soil Physical Parameters
For the standard measurements of soil physical parameters (porosity, water retention characteristics, diffusivity, and air permeability) we took 127 undisturbed 200 cm3 core samples (5 cm
height) at different depths at the different sites. The porosity of the soil samples was determined by vacuum pycnometry and the thermogravimetric method (Hartge and Horn, 1999). To obtain the water retention curves the samples were saturated with water and then successively drained applying defined levels of water potential using a filter bed and a pressure plate.
Gas diffusivity (DS) was measured at different levels of water potential employing a nonstationary one-chamber method (Kühne et al., 2011), using neon as a tracer gas. The intact soil cores were placed on top of a chamber, so that gas exchange was restricted to diffusion through the soil sample. A defined amount of neon was injected into the chamber. From the decreasing neon concentration over time the diffusivity DS and the dimensionless relative diffusivity DS/D0 were determined.
Air permeability was measured with a device similar to that described by Iversen et al. (2001), where air flows through a soil ring sample at a constant rate. The pressure gradient across the soil sample at a given flow rate is inversely proportional to the air permeability. The device was equipped with a highly sensitive pressure sensor (GMSD 2.5 MR, 125 Greisinger Electronic GmbH; Regenstauf; Germany; sensitivity 0.1 Pa). For each site the horizon-specific dependence of diffusivity and air permeability on air-filled pore volume was derived using nonlinear regression functions.
Turbulence experiment
We developed a steady-state method to measure the resulting soil gas diffusivity, which could also be used to test the effect of
turbulence-Table 1. Description of the experimental forest sites Hartheim (Germany), Hesse (France), and vielsalm (Belgium). Soils were classi-fied according uSDA (Soil Survey Staff, 2006) and WrB classification (FAO, 2006).
Site Hartheim Hesse vielsalm
Location Upper Rhine Valley/47°56' N, 7°36' E Northeast France/ 48°40' N, 7°05' E Belgian Ardennes/ 50°18' N, 6°00' E
Elevation above sea level 200 m 300 m 450 m
Mean annual temperature 10.3°C† 9.2°C‡ 7.0°C§
Mean annual precipitation 642 mm† 820 mm‡ 1000 mm§
Soil type USDA Calciudoll Hapludalf Dystrudept
Soil type WRB Haplic Regosol Stagnic Luvisol Haplic Cambisol
Texture Silt loam (topsoil), sand and gravel (subsoil) Silt loam Silty clay loam
Available water capacity 80 mm (0–0.6-m depth)¶ 175 mm (0–1.6-m depth)‡ 150 mm (0–0.6-m depth)
pHH2O 7.8–8.2¶ 4.9 3.7–4.5
Organic carbon 14.20 kg m–2¶ 10.07 kg m–2‡ 9.44 kg m–2
Humus type Mull Moder Moder
Tree species Scots pine (Pinus sylvestris L.) European beech (Fagus sylvatica L.) Mixed stand dominated by European beech
Stand height/age 14 m/45 yr† 16.2 m/30 yr# 27 m/100 yr††
Diameter at breast height 0.19 m† 0.10 m# 1.06 m††
Stand density 800 trees ha-1† 2600 trees ha-1# 243 trees ha-1††
† Holst et al. (2008). ‡ Granier et al. (2008). § Aubinet et al. (2005). ¶ Maier et al. (2010). # Granier et al. (2000). †† Aubinet et al. (2001).
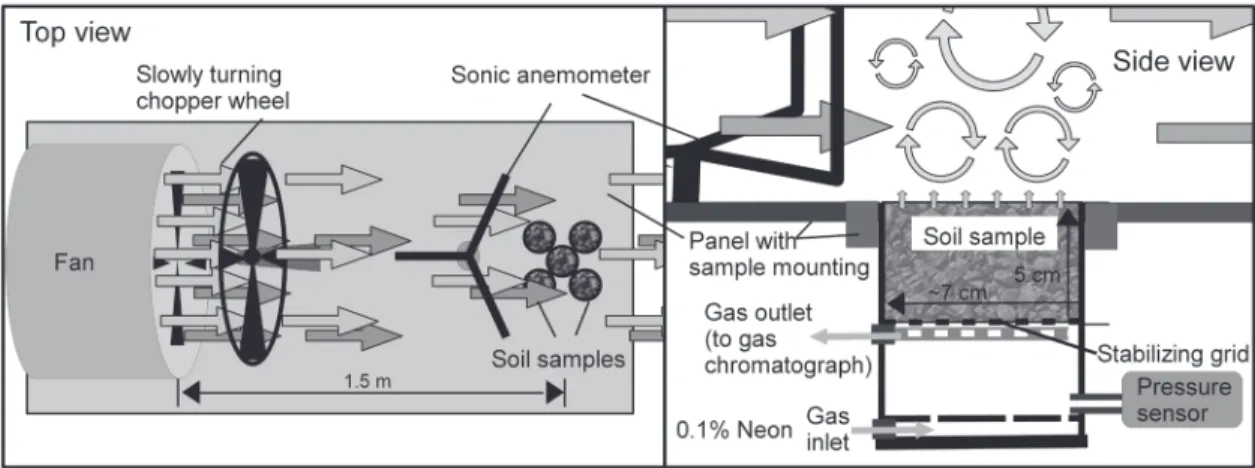
driven pressure pumping on gas transport. The set-up was similar to that of Jassal et al. (2005). The method was modified using a peristaltic pump and neon as a tracer gas. A soil core sample (200 cm3) was fixed
on top of an open-top chamber (200 cm3), through which air with
a defined concentration of tracer gas was circulated. This air entered at the bottom of the chamber with a constant neon concentration of 0.1% (Fig. 2, side view). A perforated tube positioned right below the soil sample collected the air leading it to a micro-gas chromatograph (CP2002P, Chrompack, Middelburg, the Netherlands, CP-Molsieve-5A column, helium as carrier gas). The flow rate into and out of the chamber was exactly the same and was controlled by a peristaltic pump. The loss of neon was restricted to diffusion through the soil sample (when turbulence above the sample is zero). After a certain time, an equilibrium situation is established and a stationary neon concentration in the chamber will be reached. No fan was located inside the chamber to avoid undesired turbulence. In this stationary situation, the tracer gas flux through the soil sample (F, m3 s–1)
corresponds only to diffusion and dispersion because the source and the advective terms are zero, leading to the following equation:
(
S disp)
C res C F D D D z z ∂ ∂ = + = ∂ ∂ , [4]Thus, Dres (m2 s–1) could be calculated by
(
)
(
in out)
disp res out atm S F C C D D D C C C z h F D D -+ = = = - , [5]where Φ is the flow rate of the pump (m3 s–1), C
in, Cout, and Catm
the neon concentration (mmol mol–1) at the chamber inlet, outlet
and in the atmosphere, and h the height of the soil sample (m). The set-up allowed us to measure five samples simultaneously (Fig. 2, top view). To simulate a flat soil surface, the soil rings were mounted into a panel, so that the panel surface and the top of the soil samples formed a plane surface (Fig. 2, side view). This was necessary to avoid local effects and to ensure that all five samples received the same turbulence-induced pressure fluctuations. Turbulence was generated by a constantly blowing fan and a slowly turning chopper wheel. The resulting air movement across the experimental surface varied continuously, inducing pressure fluctuation at the samples
surfaces. To assess the pressure pumping two of the chambers were equipped with a sensor (GMSD 2.5 MR, Greisinger Electronic GmbH; Regenstauf, Germany) to measure the pressure fluctuations. The atmospheric turbulence was measured at 10 Hz using a sonic anemometer (81000V, R. M. Young Company, Traverse City, MI) installed in front of the experimental set-up.
At first, the diffusivity of the soil samples was measured under calm conditions where pressure pumping had no effect (Dres = DS). Then the turbulence generator was switched on (= turbulence Level 1) and a new steady state was reached. Then a higher turbulence level (= turbulence Level 2) was set. The difference between Dres measured under calm conditions (= DS) and Dres measured under turbulent conditions could be attributed to turbulence-induced dispersion (Ddisp). Analogous to DS/D0, we define the dimensionless relative dispersion coefficient Ddisp/ D0 and the relative resulting exchange coefficient Dres/D0.
For this experiment we used five topsoil samples (0–5-cm depth) of each site at two different soil moisture levels. The friction velocity u* (m s–1) was used as a proxy specifying the
turbulence intensity (Stull, 1988). The friction velocity is obtained from u*= -(u w´ ´) where u’ and w’ are the fluctuations of the horizontal and vertical wind velocities compared to the mean values (m s–1), respectively, and (u w´ ´) represents the
temporal mean value of the product of u’ and w’.
All statistical analyses were accomplished using the software SAS 9.2 (SAS Institute Inc., Cary, NC). We used the procedure PROC NLIN for nonlinear curve-fitting. To smooth the water retention curve the procedure PROC TPSPLINE was used. The effect of turbulence-driven pressure pumping on Dres/D0 was tested at p = 0.05 using the Friedman test.
reSuLTS
Pore-Size Distribution, Diffusivity, and Air Permeability
The pore-size distribution was derived from the measured soil-water retention curves, assuming radial pore geometry. At Hartheim the soil is well aerated throughout the profile, and has a large volume of macropores representing interaggregate pores (Fig. 3a). At Hesse the profile was slightly compacted in the top soil (depth <25 cm).
Fig. 2. Set-up of a steady-state method to measure the soil gas diffusivity under calm and the resulting soil gas diffusivity under turbulent conditions. The flow rate of the gas into and out of the chamber was controlled by a peristaltic pump.
The volume of the macropores (diameter >300 mm) diminishes at depth >60 cm, so aeration of the subsoil is limited (Fig. 3b). At Vielsalm traces of compaction due to the use of forestry machinery were visible in the field. Here, also the volume of the macropores (>300 mm diam.) in the top soil was lowest (Fig. 3c).
The topsoil (0–5 cm) at all sites revealed distinct relationships between e and DS/D0 (Fig. 4a, 4b, and 4c). At similar e values the Vielsalm samples generally had the lowest DS/
D0 values. The relationship between ka and e was more scattered (Fig. 4d, 4e, 4f ), especially for the Hartheim samples where the highest ka values were observed. As the pore-volume decreases with soil depth, the measured DS/D0 and ka values decreased with depth (data not included).
Fig. 3. Profiles of the pore-size distribution at the experimental sites. equivalent pore diameter was derived from matric potential.
Fig. 4. (top) relationship between the relative diffusion coefficient DS/D0 and the air-filled pore-volume ε and (bottom) relationship of air permeability ka and ε of topsoil samples (0–5-cm depth).
Turbulence experiment
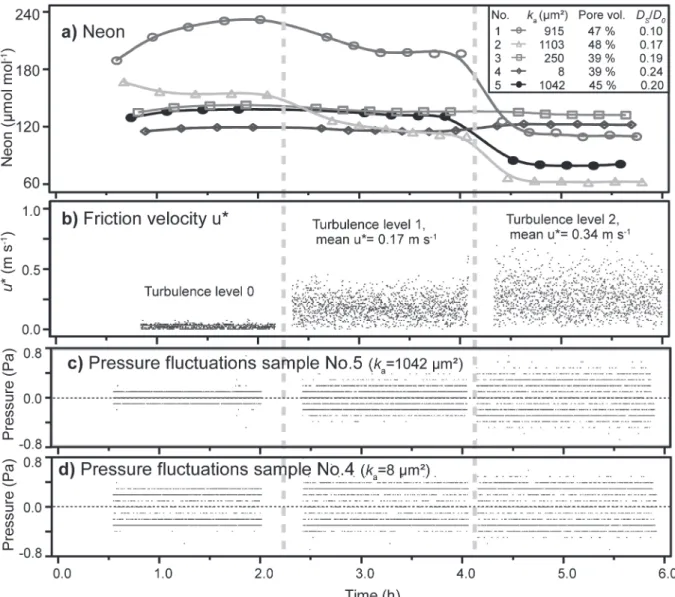
The results of a demonstration test are plotted in Fig. 5. For this run, five plastified soil samples with similar air-filled pore-volume, but distinct effective gas diffusion coefficient and air permeability were used (Fig. 5a, see legend). The soil physical properties of the samples were non-natural due to the plastification. Yet, the underlying physical principle of the pressure-pumping effect could clearly be observed on these samples. When a steady-state concentration was reached the turbulence generator was switched on (Fig. 5b) to start turbulence-driven pressure pumping. As a result the neon concentration in the chamber (Cout) dropped substantially in some of the chambers and tended to a new steady-state concentration. DS was calculated from the steady-state concentration under calm conditions, where a high concentration corresponds to a low value for DS (see Eq. [5]). The decrease in the steady-state Cout concentration under turbulent conditions due to the pressure-pumping effect did not depend on the initial DS value, but rather on ka (see Fig. 5a). Only samples with high air permeability
showed a substantial decrease in the steady-state concentration under turbulent conditions (Fig. 5a: samples 1, 2, and 5).
Unfortunately the peristaltic pump used in the experiment induced a small oscillating pressure fluctuation in the chamber. The pressure fluctuations induced by the pump were tested by sealing the chambers with solid plastic samples and were the same for all chambers. The resulting pressure fluctuations were less but still detectable when soil samples were fixed on the chambers (Fig. 5c, 5d, turbulence Level 0). Samples with a higher ka/e-value revealed lower basic pressure fluctuations, because the pressure fluctuations induced by the peristaltic pump could easily “be transported” through the sample to the atmosphere. This caused probably an overestimation of DS. Nevertheless, the conclusions drawn for turbulence-induced Ddisp remain unchanged, because this effect was the same at all turbulence levels.
The mean value of the friction velocity u* was <0.01 m s–1
under calm conditions, 0.17 m s–1 at turbulence Level 1, and
0.34 m s–1 at turbulence Level 2. The turbulence-driven pressure
fluctuations at the surface of the different soil samples were the same at a given turbulence level. Yet, the penetration of pressure
Fig. 5. Test results using plastified soil samples. Time series of (a) the resulting steady-state concentrations of neon in the chamber, (b) friction velocity u*, and (c, d) pressure fluctuations within the respective chamber.
fluctuations through the samples depends on the pressure diffusivity, and thus the resulting pressure fluctuation in each chamber was different. The observed pressure fluctuation in the chambers increased with increasing turbulence (Fig. 5c, 5d). This response was stronger for the soil sample with the higher ka (Fig. 5c). The turbulence induced pressure fluctuations in the chambers (excluding the basic fluctuations) increased by 100% when changing from turbulence Level 1 to Level 2. Thus, an increase by 100% of the turbulence-induced pressure fluctuations at the sample surface was assumed.
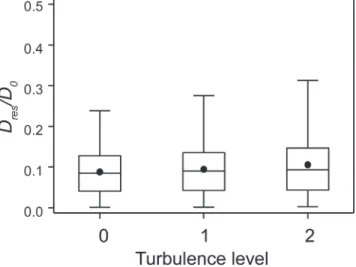
The relative resulting exchange coefficient Dres/D0 at a given turbulence level varied widely due to the distinct soil characteristics and the large range in soil moisture of the measured samples (Fig. 6). A statistically significant increase in Dres/D0 with increasing turbulence level was obtained using the Friedman test (nonparametric statistical test for paired measurements, p = 0.05).
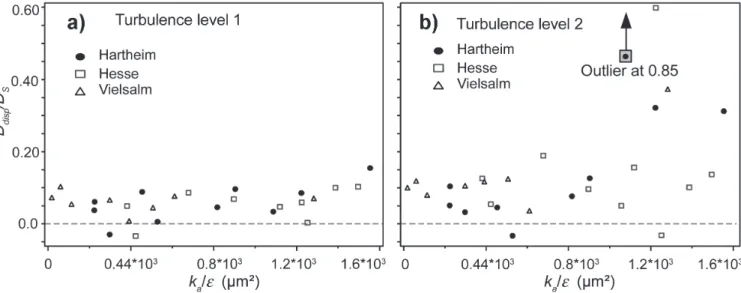
To focus on the effect of pressure pumping only Ddisp/D0 was considered. To analyze the effect of soil physical parameters on Ddisp/D0 at a given turbulence level, we tested different parameters. The ratio of air permeability and air-filled pore space (ka/e) was the best explanatory variable (Fig. 7). Ddisp/ D0 increased with ka/e. Indeed, as this parameter combination describes the soil physical component of the pressure diffusivity, it is able to explain a part of the Ddisp/D0 variation between the samples (R2 = 0.48 at turbulence Level 1, R2 = 0.38 at turbulence
Level 2). The experimental relationship was compared to modeled ones obtained from Eq. [9] of Massman (2006) who modeled the air-flow velocity in the soil pores to derive Ddisp (Fig. 7). To run the model for a situation similar to turbulence Level 1 (Level 2), a pressure fluctuation of 0.5 Pa (1 Pa, respectively), and a wave frequency of 1 Hz were used (values in agreement with the observed increase of pressure fluctuations in the chambers, Fig. 5c, 5d). For the dispersivity a different realistic values were used (Hamamoto et al., 2009).
To compare the importance of the pressure-pumping induced dispersive transport to normal diffusion Ddisp was divided by DS. The dispersive transport Ddisp reached up to 15% at turbulence Level 1, where no clear relationship between Ddisp/ DS and other soil physical parameter could be found (including ka/e, Fig. 8a). At turbulence Level 2, Ddisp/DS reached up to 85% (probably an outlier, Fig. 8b). Samples with a ka/e > 1000 mm2
showed substantially higher Ddisp/DS values. Single samples showed no turbulence effect, or even a small reduction in Dres, that caused negative values of Ddisp to be estimated (Fig. 7). These values become more negative when they are divided by a (low) DS value (Fig. 8). We attribute these negative Ddisp/DS values, and also the extreme high outlier, to measurement uncertainty.
relevance for Sites
The results of the turbulence experiment proved that ka/e has an important effect on Ddisp. Thus, we used it as surrogate to determine the sensitivity of the soil gas transport to pressure pumping on a larger data set from our three experimental sites.
Fig. 6. The relative resulting exchange coefficient Dres/D0 at different turbulence levels. The boxes indicate 25th, 50th, and 75th percentiles, the dot the mean value.
Fig. 7. relationship between the pressure-pumping effect (measured as the dimensionless relative dispersion coefficient Ddisp/D0) and the parameter combination ka/ε for (a) turbulence Level 1 and (b) turbulence Level 2.
Both ka and e depend on the soil-water content and, hence, on soil matric potential. At Hartheim, the topsoil samples (0–5-cm depth) had high ka/e values and soil matric potential had only little impact (Fig. 9). The samples from Hesse revealed lower ka/e values at higher soil moisture, but the ka/e values were high. The Vielsalm samples generally had the lowest ka/e values that slightly increased when the soil was drier.
DiScuSSiOn
Laboratory experiment
We could demonstrate the effect of turbulence-driven pressure pumping on gas transport in soil core samples through the activation of mechanical dispersion processes. Using the present set-up, it was possible to relate turbulence directly to the pressure-pumping effect and Ddisp. The dispersion term, Ddisp, is the product of the dispersivity, a, and the gas velocity in the soil pores (Ddisp= αυ ), which are parameters that are difficult to measure individually.
Until now, most of the experimental set-ups that have been used to measure a in the gas phase are based on the detection of the breakthrough curve of tracer gas when air is flowing
continuously through porous media (e.g., Poulsen et al., 2008; Hamamoto et al., 2009). However, these set-ups cannot be used to examine the pressure-pumping effect on the gas transport. We also wonder whether this a value corresponds to the a value for oscillating flow. Our set-up could also be adapted to field experiments to assess the impact of pressure pumping in the field, avoiding the determination of the individual parameters a and v.
Over the three sites investigated, the parameter combination ka/e seems to be a suitable and physically-based surrogate to assess the sensitivity of gas transport in a soil to turbulence-driven pressure pumping. The relationship between ka/e and Ddisp (Fig. 7) in soil samples with large ranges of pore sizes and structure shows that ka/e is the dominant soil property affecting the effectiveness of the pressure-pumping effect at the sample surface and agrees with predictions from the Massman (2006) model. In addition, our results show the need for accurate site-specific parameter determination. Simple models, which calculate ka based on e, already fix the relation between ka and e. However, this ratio can vary greatly between sites (Fig. 4). Therefore, we emphasize measurement instead of modeling the relevant soil physical parameters ka, e, and even DS.
Fig. 8. relationship between the ratio of gas transport processes (ratio of dispersion coefficient and effective diffusion coefficient, Ddisp/DS) and the parameter combination ka/ ε for (a) turbulence Level 1 and (b) turbulence Level 2. negative Ddisp/DS values are due to measurement errors.
Fig. 9. relationship between ka/ε and pF of topsoil samples (0–5-cm depth), where ka/ε is a surrogate for the susceptibility of a soil to pressure pumping, and pF the soil moisture status [pF = log (-matric potential)].
The turbulence-induced dispersive enhancement of the gas transport reached up to approximately 60% of the transport due to regular diffusion (Ddisp/DS). However, an enhancement >20% could only be observed at the higher turbulence level on samples with a ka/e >1000 mm2 (Fig. 8). Even though 1000 mm2
is very high for mineral soil, it is quite common for the humus layer. This threshold cannot be seen as a fixed value but rather depends on the intensity of the pressure pumping and the height of the sample. Hence, the uppermost few centimeters of the humus layer are always potentially affected by the turbulence effect.
The dispersivity a is an important parameter proportional to Ddisp (= a × v) at a given level of pressure pumping (Poulsen and Møldrup, 2006). It depends mainly on the geometry of the air-filled pores (Hamamoto et al., 2009), which is also influenced by soil moisture. Because ka/e can also depend on soil moisture (Fig. 8, see Hesse and Vielsalm), ka/e and a may covary negatively. Thus, higher soil-water content could lead to a lower ka/e value (Fig. 9) and probably also to higher a values (Costanza-Robinson and Brusseau, 2002). This could partly explain the relatively high Ddisp/D0 values of a Vielsalm samples at low values of ka/e, which exceed the modeled values (Fig. 7). Thus, modeling the pressure-pumping effect on soil gas transport could be improved using site-specific moisture dependence of ka/e and a.
The assumed amplitudes of the pressure fluctuations during our experiment were very low (0.5 Pa, 1 Pa). Yet, the observed increase in pressure fluctuations in the chamber below the soil sample agrees well with the assumed amplitudes and the dampening effect of the soil. These values can be considered realistic, although very low compared to values used in the synthetic datasets of Poulsen and Møldrup (2006) or those measured by Massman et al. (1997). In contrast, our measured ka values were very high, so that even little pressure fluctuations had a substantial effect.
relevance for Sites
Comparing the topsoil of the different sites, the samples from Hartheim showed the highest ka values. This agrees with the high pore volume and the high fraction of macro/interaggregate pores (Fig. 3a). Soil moisture content has only little influence on ka/e (Fig. 9a), and, hence, this soil is sensitive to pressure pumping during all seasons. Because the values of ka/e are high throughout the profile, the pressure fluctuations can easily penetrate deeper into the soil. The penetrating depth is a very important factor. It represents the maximum depth to which the effect occurs. Additionally it affects directly the movement of the air column in the topsoil pores, since a deeper penetration depth means also a higher air-flow velocity in the topsoil pores. Another important issue is the transfer of turbulence above the canopy to the soil surface. At Hartheim the Scots pine canopy is sparse, and atmospheric turbulence can easily affect the soil surface. Therefore we have to expect a relatively large turbulence-driven pressure-pumping impact for this type of forest site during all seasons (e.g., Maier et al., 2010).
At the Hesse site ka/e (Fig. 9c), and thus Ddisp at a given pressure fluctuation level, is generally lower. This means that the soil is less sensitive to pressure pumping than at Hartheim. Additionally, soil moisture has a more important influence. During summer the soil is drier leading to higher ka/e values and the soil gas transport becomes more sensitive to pressure pumping. However, the canopy of the beech stand is dense and only strong wind situations may induce turbulence near the forest floor. Poulsen and Møldrup (2006) suggested that turbulence-induced Ddisp would become more important at higher soil moisture contents, because the relative contribution to the soil aeration (Ddisp/DS) increased. As a result, pressure pumping could be important at Hesse during winter, when the diffusivity is low.
At the Vielsalm site we expect atmospheric turbulence to have only little effect on soil gas transport, because ka/e is usually low (Fig. 9c). Especially during winter when there is no dense canopy the soil moisture is high and ka/e minimal. But also here pressure pumping could be important, since the diffusivity is also low.
To include turbulence-driven pressure pumping in field studies, precise information about the pressure fluctuation at the soil surface is needed. Additionally to the amplitude of the pressure fluctuation also wave frequency and wavelength is needed (Farrell et al., 1966; Kazanskiy and Zolotokrylin, 1994; Massman, 2006), which is difficult to measure. Seok et al. (2009), Massman and Frank (2006), and Bowling and Massman (2011) used wind speed as a surrogate for the pressure pumping, while Flechard et al. (2007), and Maier et al. (2010) used friction velocity u*. Improvement could be made by studies linking u* and high frequency pressure fluctuations at the soil surface, so wind data could be used to derive information about the pressure pumping. At forest sites, wind is usually measured above the canopy. But the transition of the above-canopy turbulence to pressure fluctuations at the soil surface must also be considered (Aubinet et al., 2003). Therefore we recommend to measure u* above the soil surface as well. An approach to overcome the uncertainties from parametrization of DS and Ddisp would be to continuously measure the vertical profile of Dres in situ, similar to the radon method applied by Davidson and Trumbore (1995).
cOncLuSiOnS
We showed how turbulence-driven pressure pumping can substantially enhance soil gas transport. We strongly recommend considering the turbulence effect on soil gas transport during field studies. The resulting diffusivity (Dres) should be used instead of the effective gas diffusion coefficient (DS) for studies using the gradient method to measure soil gas efflux. Also efflux measurements using closed chambers are probably biased low compared with turbulence-driven pressure pumping in the field. Closing the chambers temporarily to measure the efflux probably excludes or attenuates the natural atmospheric pressure fluctuations. Hence, soil gas transport is modified and the efflux is probably lower when the chamber is closed.
AcKnOWLeDGMenTS
assistance in the laboratory. Our thanks also go to Helmut Mayer for providing the sonic anemometer and technical assistance.
reFerenceS
Amos, R.T., D.W. Blowes, L. Smith, and D.C. Sego. 2009. Measurement of wind-induced pressure gradients in a waste rock pile. Vadose Zone J. 8:953–962. doi:10.2136/vzj2009.0002
Aubinet, M., B. Chermanne, M. Vandenhaute, B. Longdoz, M. Yernaux, and E. Laitat. 2001. Long term carbon dioxide exchange above a mixed forest in the Belgian Ardennes. Agric. For. Meteorol. 108:293–315. doi:10.1016/ S0168-1923(01)00244-1
Aubinet, M., B. Heinesch, D. Perrin, and C. Moureaux. 2005. Discriminating net ecosystem exchange between different vegetation plots in a heterogeneous forest. Agric. For. Meteorol. 132:315–328. doi:10.1016/j.agrformet.2005.08.006 Aubinet, M., B. Heinesch, D. Perrin, and M. Yernaux. 2003. Horizontal and
vertical CO2 advection in a sloping forest. Boundary-Layer Meteorol. 108:397–417. doi:10.1023/A:1024168428135
Bowling, D.R., and W.J. Massman. 2011. Persistent wind‐induced enhancement of diffusive CO2 transport in a mountain forest snowpack. J. Geophys. Res., [Biogeosci.] 116:G04006.
Clements, W., and M. Wilkening. 1974. Atmospheric pressure effects on 222Rn
transport across the earth-air interface. J. Geophys. Res. 79:5025–5029. doi:10.1029/JC079i033p05025
Costanza-Robinson, M.S., and M.L. Brusseau. 2002. Gas phase advection and dispersion in unsaturated porous media. Water Resour. Res. 28:1–10. Davidson, E.A., K. Savage, S.E. Trumbore, and W. Borken. 2006. Vertical
partitioning of CO2 production within a temperate forest soil. Glob. Change Biol. 12:944–956. doi:10.1111/j.1365-2486.2005.01142.x Davidson, E.A., and S.E. Trumbore. 1995. Gas diffusivity and production
of CO2 in deep soils of the eastern Amazon. Tellus 47B:550–565. doi:10.1034/j.1600-0889.47.issue5.3.x
DeJong, E., and H. Schappert. 1972. Calculation of soil respiration and activity from CO2 profiles in the soil. Soil Sci. 113:328–333. doi:10.1097/00010694-197205000-00006
Delgado, J.M.P.Q. 2006. A critical review of dispersion in packed beds. Heat Mass Transfer 42:279–310. doi:10.1007/s00231-005-0019-0
Elberling, B., F. Larsen, S. Christensen, and D. Postma. 1998. Gas transport in a confined unsaturated zone during atmospheric pressure cycles. Water Resour. Res. 34:2855–2862. doi:10.1029/98WR02037
Fang, C., and J.B. Moncrieff. 1999. A model for soil CO2 production and transport 1: Model development. Agric. For. Meteorol. 95:225–236. doi:10.1016/S0168-1923(99)00036-2
FAO. 2006. World reference base for soil resources 2006. World Soil Resources Rep. 103. FAO, Rome.
Farrell, D.A., E.L. Greacen, and C.G. Gurr. 1966. Vapor transport in soil due to air turbulence. Soil Sci. 102:305–313. doi:10.1097/00010694-196611000-00005 Flechard, C., A. Neftel, M. Jocher, C. Ammann, J. Leifeld, and J. Fuhrer. 2007.
Temporal changes in soil pore space CO2 concentration and storage under permanent grassland. Agric. For. Meteorol. 142:66–84. doi:10.1016/j. agrformet.2006.11.006
Fukuda, H. 1955. Air and vapor movement in soil due to wind gustiness. Soil Sci. 79:249–256. doi:10.1097/00010694-195504000-00002
Gidda, T., D. Cann, W.H. Stiver, and R.G. Zytner. 2006. Airflow dispersion in unsaturated soil. J. Contam. Hydrol. 82:118–132. doi:10.1016/j. jconhyd.2005.09.005
Granier, A., P. Biron, and D. Lemoine. 2000. Water balance, transpiration and canopy conductance in two beech stands. Agric. For. Meteorol. 100:291– 308. doi:10.1016/S0168-1923(99)00151-3
Granier, A., N. Breda, B. Longdoz, P. Gross, and J. Ngao. 2008. Ten years of fluxes and stand growth in a young beech forest at Hesse, North-eastern France. Ann. For. Sci. 65:704. doi:10.1051/forest:2008052
Hamamoto, S., P. Moldrup, K. Kawamoto, T. Komatsu, and D.E. Rolston. 2009. Unified measurement system for the gas dispersion coefficient, air permeability, and gas diffusion coefficient in variably saturated soil. Soil Sci. Soc. Am. J. 73:1921–1930. doi:10.2136/sssaj2009.0012
Hartge, K.H., and R. Horn. 1999. Die physikalische Untersuchung von Böden. 3rd ed. Ferdinand Enke Verlag, Stuttgart. (In German.)
Hirsch, A.I., S.E. Trumbore, and M.L. Goulden. 2004. The surface CO2 gradient and pore-space storage flux in a high-porosity litter layer. Tellus 56B:312– 321. doi:10.1111/j.1600-0889.2004.00113.x
Holst, J., R. Barnard, E. Brandes, N. Buchmann, A. Gessler, and L. Jaeger. 2008. Impacts of summer water limitation on the carbon balance of a Scots pine forest in the southern upper Rhine plain. Agric. For. Meteorol. 148:1815– 1826. doi:10.1016/j.agrformet.2008.06.008
Iversen, B.V., P. Schjønning, T.G. Poulsen, and P. Moldrup. 2001. In situ, on-site and laboratory measurements of soil air permeability: Boundary conditions and measurement scale. Soil Sci. 166:97–106. doi:10.1097/00010694-200102000-00003
Jassal, R., T. Black, G. Drewitt, M. Novak, Z. Nesic, and D. Gaumont-Guay. 2005. Relationship between soil CO2 concentrations and forest-floor CO2 effluxes. Agric. For. Meteorol. 130:176–192. doi:10.1016/j.agrformet.2005.03.005 Jiao, J.J., and H.L. Li. 2004. Breathing of coastal vadose zone induced by sea level
fluctuations. Geophys. Res. Lett. 31:L11502. doi:10.1029/2004GL019572 Kazanskiy, A.B., and A.N. Zolotokrylin. 1994. On the missing component in the equation for the land surface heat balance as applied to the heat exchange between the desert or semidesert surface and the atmosphere. Boundary-Layer Meteorol. 71:189–195. doi:10.1007/BF00709226
Kühne, A., H. Schack-Kirchner, and E.E. Hildebrand. 2011. Gas diffusivity in soils compared to ideal isotropic porous media. J. Soil Sci. and Plant Nutrition 175(1):34–45. doi: 10.1002/jpln.201000438.
Maier, M., H. Schack-Kirchner, E.E. Hildebrand, and J. Holst. 2010. Pore-space CO2 dynamics in a deep, well-aerated soil. Eur. J. Soil Sci. 61:877–887. doi:10.1111/j.1365-2389.2010.01287.x
Massman, W.J. 2006. Advective transport of CO2 in permeable media induced by atmospheric pressure fluctuations: 1. An analytical model. J. Geophys. Res. 111:G03004. doi:10.1029/2006JG000163
Massman, W.J., and J.M. Frank. 2006. Advective transport of CO2 in permeable media induced by atmospheric pressure fluctuations: 2. Observational evidence under snowpacks. J. Geophys. Res. 111:G03005. doi:10.1029/2006JG000164 Massman, W.J., R.A. Sommerfeld, A.R. Mosier, K.F. Zeller, T.J. Hehn, and S.G.
Rochelle. 1997. A model investigation of turbulence-driven pressure-pumping effects on the rate of diffusion of CO2, N2O, and CH4 through layered snow-packs. J. Geophys. Res. 102:18851–18863. doi:10.1029/97JD00844 Millington, R.J. 1959. Gas diffusion in porous media. Science (Washington,
DC) 130:100–102. doi:10.1126/science.130.3367.100-a
Moldrup, P., T. Olsen, T. Yamaguchi, P. Schjonning, and D.E. Rolston. 1999. Modelling diffusion and reaction in soil. IX. The Buckingham–Burdine– Campbell equation for gas diffusivity in undisturbed soil. Soil Sci. 164:542–551. doi:10.1097/00010694-199908000-00002
Poulsen, T., and P. Møldrup. 2006. Evaluating effects of wind-induced pressure fluctuations on soil-atmosphere gas exchange at a landfill using stochastic modelling. Waste Manage. Res. 24:473–481. doi:10.1177/0734242X06066363 Poulsen, T., W. Suwarnarat, M.K. Hostrup, and P.N.V. Kalluri. 2008. Simple and
rapid method for measuring gas dispersion in porous media: Methodology and applications. Soil Sci. 173:169–174. doi:10.1097/SS.0b013e31816408c9 Pumpanen, J., H. Ilvesniemi, L. Kulmala, E. Siivola, H. Laakso, P. Kolari, C.
Helenelund, M. Laakso, M. Uusimaa, and P. Hari. 2008. Respiration in boreal forest soil as determined from carbon dioxide concentration proðle. Soil Sci. Soc. Am. J. 72:1187–1196. doi:10.2136/sssaj2007.0199 Schack-Kirchner, H., E. Kublin, and E.E. Hildebrand. 2011. A finite-element
regression procedure to estimate depth profiles of CO2/N2O production in soils. Vadose Zone J. 10:169–183. doi:10.2136/vzj2009.0193 Scotter, D.R., and P.A.C. Raats. 1968. Dispersion in porous mediums due to oscillating
flow. Water Resour. Res. 4:1201–1206. doi:10.1029/WR004i006p01201 Scotter, D.R., and P.A.C. Raats. 1969. Dispersion of water vapor in soil due to air
turbulence. Soil Sci. 108:170–176. doi:10.1097/00010694-196909000-00004 Seok, B., D. Helmig, M.W. Williams, D. Liptzin, K. Chowanski, and J. Hueber. 2009. An
automated system for continuous measurements of trace gas fluxes through snow: An evaluation of the gas diffusion method at a subalpine forest site, Niwot Ridge, Colorado. Biogeochemistry 95:95–113. doi:10.1007/s10533-009-9302-3 Sharma, P., and T. Poulsen. 2010. Gas dispersion and immobile gas content in
granular porous media: Effect of particle size nonuniformity. Soil Sci. 175:426–431. doi:10.1097/SS.0b013e3181f0edaf
Soil Survey Staff. 2006. Keys to Soil Taxonomy. 10th ed. NRCS, Washington, DC. Stull, R.B. 1988. An introduction to boundary layer meteorology. Kluwer Acad.
Publ., Dordrecht, the Netherlands.
Takle, E.S., W.J. Massman, J.R. Brandle, R.A. Schmidt, X. Zhou, I.V. Litvina, R. Garcia, G. Doyle, and C.W. Rice. 2004. Influence of high-frequency ambient pressure pumping on carbon dioxide efflux from soil. Agric. For. Meteorol. 124:193–206. doi:10.1016/j.agrformet.2004.01.014