HAL Id: tel-01146819
https://tel.archives-ouvertes.fr/tel-01146819
Submitted on 29 Apr 2015
HAL is a multi-disciplinary open access
archive for the deposit and dissemination of sci-entific research documents, whether they are pub-lished or not. The documents may come from teaching and research institutions in France or abroad, or from public or private research centers.
L’archive ouverte pluridisciplinaire HAL, est destinée au dépôt et à la diffusion de documents scientifiques de niveau recherche, publiés ou non, émanant des établissements d’enseignement et de recherche français ou étrangers, des laboratoires publics ou privés.
Mapping oxygen in the awake mouse brain
Declan Lyons
To cite this version:
Declan Lyons. Mapping oxygen in the awake mouse brain. Neurons and Cognition [q-bio.NC]. Uni-versité Pierre et Marie Curie - Paris VI, 2015. English. �NNT : 2015PA066046�. �tel-01146819�
Université Pierre et Marie Curie
Ecole Doctorale Cerveau Cognition Comportement (ED3C)
Cartographie de l'oxygénation cérébrale chez la souris éveillée
Mapping oxygen in the awake mouse brain
Présentée par
Declan LYONS
Thèse de doctorat de Neurosciences
Dirigée par Serge CHARPAK
Présentée et soutenue publiquement le 06 février 2015 à Paris
Devant un jury composé de :
Serge CHARPAK (Directeur de thèse) Bruno WEBER (Rapporteur)
Gilles BONVENTO (Rapporteur) Philippe FAURE (Président)
ii
Résumé en français
Comprendre la relation entre l’activité cérébrale, le flux sanguin et le métabolisme énergétique impose de déterminer comment l’oxygène est délivré et consommé par les neurones in vivo. Suite à la synthèse récente du PtP-C343, une sonde bi-photonique phosphorescente sensible à l’oxygène, notre laboratoire a développé l’imagerie bi-photonique de phosphorescence en profondeur, pour mesurer la concentration en oxygène in vivo, avec une résolution micrométrique dans le cerveau de rongeurs anesthésiés (Parpaleix et al. 2013). Le laboratoire a quantifié, dans le bulbe olfactif de la souris, la pression partielle d’oxygène (Po2) dans les vaisseaux et dans le tissu. Il a également fait
l’observation que la valeur de la Po2 à mi-distance entre deux érythrocytes d’un capillaire, peut
être utilisée pour évaluer indirectement la Po2 dans le tissu voisin. Mon projet de thèse a été de
mettre au point une approche permettant de mesurer la Po2 cérébrale chez l’animal éveillé
non-stressé.
Dans un premier temps, j’ai développé une approche chirurgicale permettant d’observer en microscopie bi-photonique, le bulbe olfactif et le cortex somato-sensoriel de souris éveillées. J’ai ensuite mis au point une technique d’entrainement permettant à ces souris d’être maintenues en contention en l’absence de stress.
La première partie de mon travail, menée dans la couche glomérulaire, a permis de déterminer pour la première fois les paramètres vasculaires physiologiques de la micro-vascularisation, associés aux mesures de Po2 vasculaires et tissulaires: une Po2 érythrocytaire de
60.6 mm Hg et une Po2 tissulaire de 23 mm Hg, un flux érythrocytaire moyen de 30.6 cellules/s et
un hématocrite moyen de 34.6 %.
Dans un deuxième temps, j’ai reproduit ces mesures dans le cortex somato-sensoriel et observé des différences régionales, selon l’organisation en couches corticales. De manière générale, la Po2 tissulaire moyenne est plus basse dans la couche I (14.7 mm Hg) que dans les deux couches
sous-jacentes (couche II/III, 22.9 mm Hg; couche IV, 27.4 mm Hg). De même, des différences dans les relations dynamiques entre les Po2 globulaire/tissulaire et les paramètres vasculaires, tels
l’hématocrite et le flux érythrocytaire varient selon les couches corticales.
Enfin, j’ai comparé les valeurs des Po2 tissulaire et vasculaire chez l’animal éveillé et
anesthésié, et observé que l’anesthésie change dramatiquement l’état d’oxygénation cérébrale. Ceci démontre la nécessité de mesurer l’ensemble des paramètres vasculaires et métaboliques dans des conditions vraiment physiologiques. De cette manière, mes données permettront d’améliorer les modèles de diffusion de l’oxygène, ainsi que l’analyse quantitative du métabolisme cérébral et l’interprétation de la nature des signaux mesurés en imagerie cérébrale humaine.
iv
Abstract
Understanding brain metabolism at rest and during periods of activity requires quantifying the amount of oxygen entering, being consumed in, and exiting selected volumes of neural tissue. Two-photon phosphorescence lifetime microscopy (2PLM) is a new technique that has been used for depth-resolved micron-scale measurements of the partial pressure of oxygen (Po2) in the
rodent brain. It has allowed mapping of Po2 in depth in both the olfactory bulb and the cortex of
anaesthetised mice. The spatiotemporal resolution of 2PLM Po2 measurements has revealed that
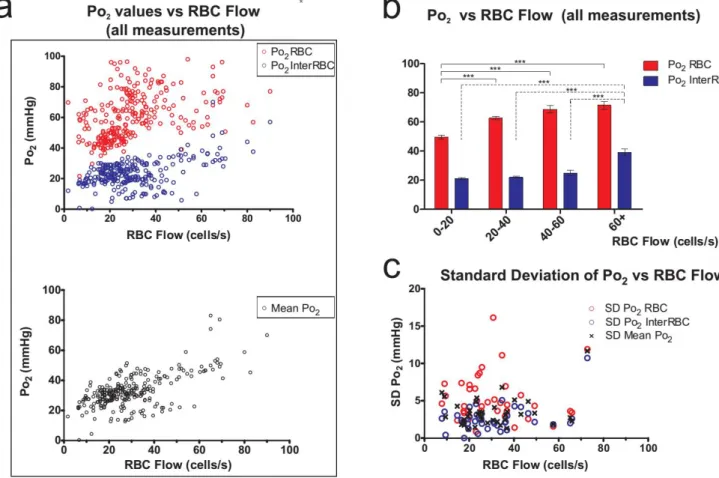
the portion of plasma in the vicinity of individual red blood cells (RBCs) has a higher oxygen content(Po2RBC) than that which is at a distance from RBCs(Po2InterRBC). Our laboratory has
shown that Po2 InterRBC is at equilibrium with Po2 in the neuropil and can thus be used to
non-invasively measure tissue Po2 (Parpaleix et al., 2013). However, the relevance of all reported
high-resolution Po2 values has remained uncertain as measurements have only been performed during
anaesthesia, which affects both neuronal activity and cerebral blood flow, two major parameters that affect brain vascular and tissue oxygenation.
My project aimed to map the physiological values of brain Po2 at rest, in the awake, unstressed
mouse. I have done so in two brain regions, the olfactory bulb glomerular layer and the somatosensory cortex. In the initial phase of this project, I implemented surgical techniques to allow for long-term optical access to the olfactory bulb or the somatosensory cortex, and also methods for training mice to allow for 2-photon imaging and 2PLM while minimising the stress induced by these procedures.
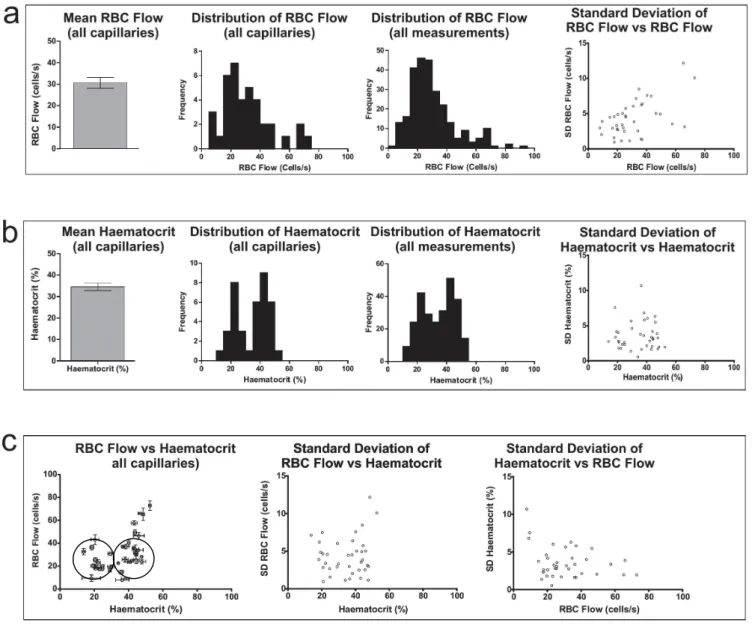
The first section of my research, conducted in the olfactory bulb glomerular layer, produced the first measurements of blood flow and Po2 parameters in the cerebral microvasculature in
physiological conditions. I determined mean Po2 levels of values of 60.6 mmHg for RBC Po2, 23
mmHg for tissue Po2, a mean capillary RBC flow rate of 30.6 cells/s and a mean capillary
haematocrit level of 34.6%
In the second section of my work, I performed similar measurements in the somatosensory cortex and observed regional differences between the superficial cortical laminae. Measured from the capillaries, the mean local tissue Po2 in Layer I (14.7 mmHg) is generally lower than in the two
underlying layers (Layer II/III: 22.9 mmHg, Layer IV: 27.4 mmHg). Furthermore the relationships of RBC Po2 and tissue Po2 to the blood flow parameters differed between the cortical layers, and
also in comparison to the olfactory bulb glomerular layer.
Finally, I compared the values of vascular and tissue Po2 between the awake and anaesthetised states, and observed that anaesthetics can dramatically change the state of cerebral oxygenation at the microvascular scale. This final finding emphasises the importance of measuring these values in the physiologically normal brain.
In this way, my research will help improve our understanding of cerebrovascular function and brain metabolism.
v
Foreword and Acknowledgements
I wish to offer my thanks to the École des Neurosciences, Paris Île-de-France, for the opportunity to live and study in Paris over the last number of years. Had it not been for the support offered by their graduate programme I sincerely doubt that I would have been able to embark on this tremendous experience. I would also like to thank La Fondation pour la Recherche Médicale for their support during the fourth year of my thesis studies.
Great thanks must go to Serge Charpak for welcoming me to his lab and for all his guidance over the course of my PhD studies.
I am very grateful to Dr. Gilles Bonvento, Dr. Phillipe Faure and Prof. Dr. Bruno Weber for accepting to serve on my thesis jury.
I wish to thank all the members, past and present, of the Charpak team and of the wider Laboratoire de Neurophysiologie et des Nouvelles Microscopies, with whom I have shared the past few years. I would especially like to thank Kiri Couchman and Alexandre Parpaleix, with whom I worked extensively, and Yannick Goulam Houssen, Mathieu Ducros, and Serguei Sasnouski for their technical advice and assistance. Moreover, I have to thank all those people, too numerous to name here, who have been there with smiles and kind words, concerned questions and precious advice, and jokes and laughs throughout all the ups and downs of the past few years.
I am grateful to my friends Brendan, Alex, Sean, and Emma for their various journeys to attend my thesis defence.
Thank you also to my family, who have always been there for me, each in their own way listening to me, advising me, encouraging and distracting me.
My deepest thanks go to Róisín-Ana Ní Chárthaigh, firstly, for proofreading this thesis and making sure that all my ‘Po2’s were ‘Po2’s. But more than that, I will be forever grateful to you for
your love. Your care and kindness and thoughtfulness and encouragement have brought me through all the trials on the way to here. I can never thank you enough.
vi
I will give a proof of my zeal: one day, on tearing off some old bark, I saw two rare beetles and seized one in each hand; then I saw a third and new kind, which I could not bear to lose, so that I popped the one which I held in my right hand into my mouth. Alas it ejected some intensely acrid fluid, which burnt my tongue so that I was forced to spit the beetle out, which was lost, as well as the third one.
vii I love deadlines.
I like the whooshing sound they make as they fly by.
viii
Table of Contents
Résumé en français... ii
Abstract ... iv
Foreword and Acknowledgements ... v
PART 1: INTRODUCTION ... 1
Chapter 1: Oxygen, Metabolism and the Brain ... 2
Section 1 – Cellular metabolism, ATP turnover, and the role of oxygen in these processes ... 2
1.1 – Thermodynamics and the central role of ATP in the processes of life ... 2
1.2 – Cellular production of ATP ... 5
Section 2 – Oxygen in Physiology ... 10
2.1 – The physical and chemical properties of oxygen in biological systems ... 10
2.2 – The transport of oxygen from the atmosphere to the mitochondria ... 11
2.3 – Mechanisms of oxygen delivery from the microvasculature to the tissue ... 15
Section 3 – Metabolism, ATP turnover and Oxygen Consumption in the Brain ... 17
Chapter 2: Supply of Blood to the Brain, and our Model Systems. ... 20
Section 1 – Blood supply to the Brain ... 20
Section 2 – Our Model Systems ... 23
2.1 – The olfactory bulb ... 23
2.1.1 – Structure and basic functions ... 23
2.1.2 – Vascular supply and organisation of the olfactory bulb ... 25
2.2 – The somatosensory cortex ... 27
2.2.1 – Structure and basic functions ... 27
2.2.2 – Vascular supply and organisation of the Somatosensory Cortex ... 30
Chapter 3: Tools and Techniques for measuring Oxygen... 33
Section 1 – Measurements of oxygen parameters other than Po2 ... 33
1.1 – Measurement techniques based on measurement of haemoglobin and So2 ... 33
1.2 – Positron Emission Tomography (PET) ... 34
Section 2 – Methods of Measuring Po2 ... 35
2.1 – Polarographic measurements of Po2 ... 35
2.2 – Electron Parametric Resonance (EPR) oximetry ... 36
2.3 – Mass spectrometry for measuring Po2 ... 38
2.4 – Optical methods for determining Po2 ... 38
Chapter 4: The Current Understanding of Oxygen in the Brain ... 48
Section 1 - What is known of Po2 in the Brain? ... 48
1.1 – Po2 in the human brain ... 48
1.2 – Po2 in the mammalian brain... 48
1.2.1 – Po2 in the brain vasculature ... 49
1.2.2 – Po2 in brain neural tissue ... 53
1.2.3 – Relationship of tissue Po2 to vascular Po2... 56
1.3 – The effect of inspired gases and anaesthetics on brain Po2 ... 57
Section 2 – Conclusion... 57
PART 2: METHODS & PROCEDURES ... 59
Section 1 – Combined 2-photon Imaging and 2PLM for Simultaneous Po2 Measurement, and RBC detection60 Section 2 – Surgical Procedures ... 65
Section 3 – Training procedure ... 68
ix
PART 3: RESULTS ... 73
Section 1 – Oxygenation of the Olfactory Bulb Glomerular Layer ... 74
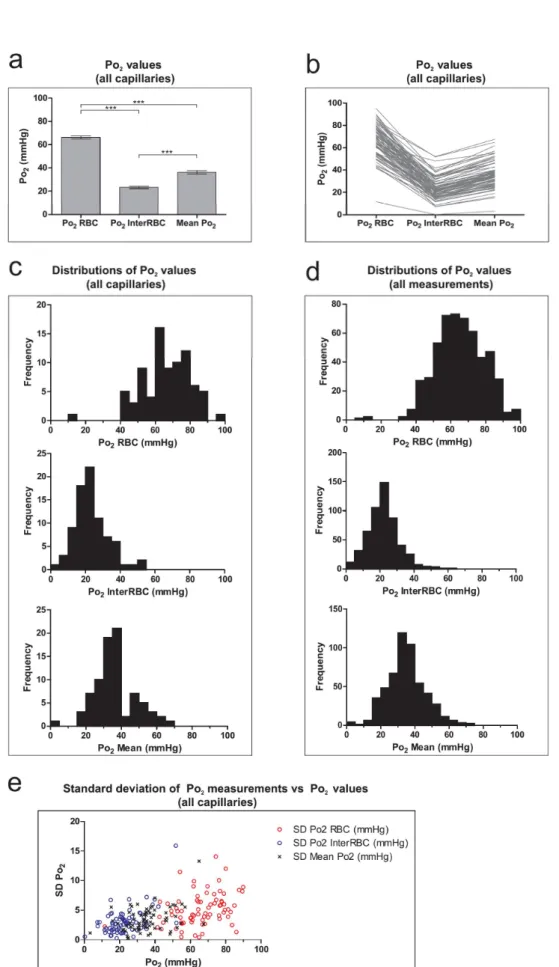
3.1.1 – Capillary and tissue Po2 in the olfactory bulb glomerular layer ... 74
3.1.2 – Capillary RBC flow and haematocrit in the olfactory bulb glomerular layer ... 77
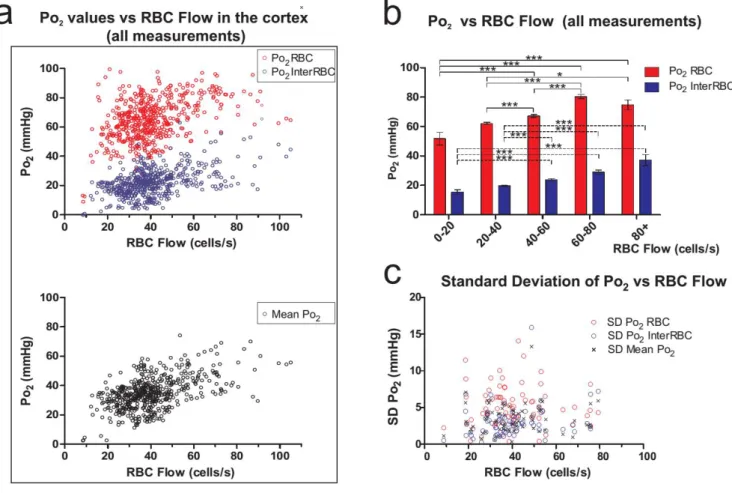
3.1.3 – The relationship between blood flow and Po2 in the olfactory bulb glomerular layer ... 79
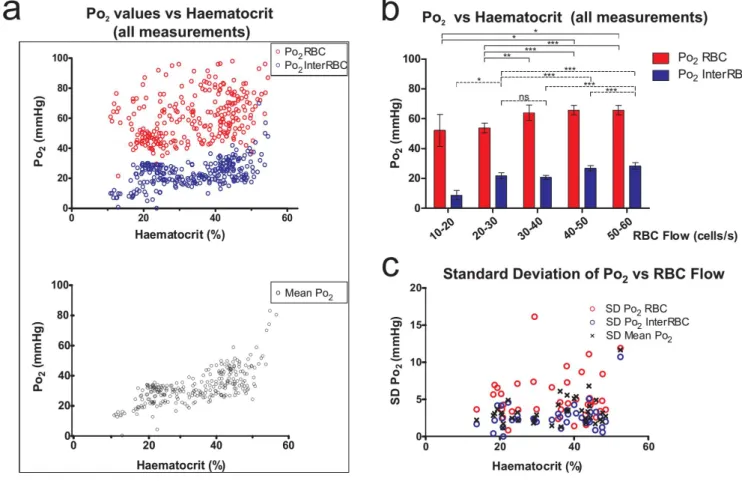
3.1.4 – The relationship between haematocrit and Po2 in the olfactory bulb glomerular layer ... 80
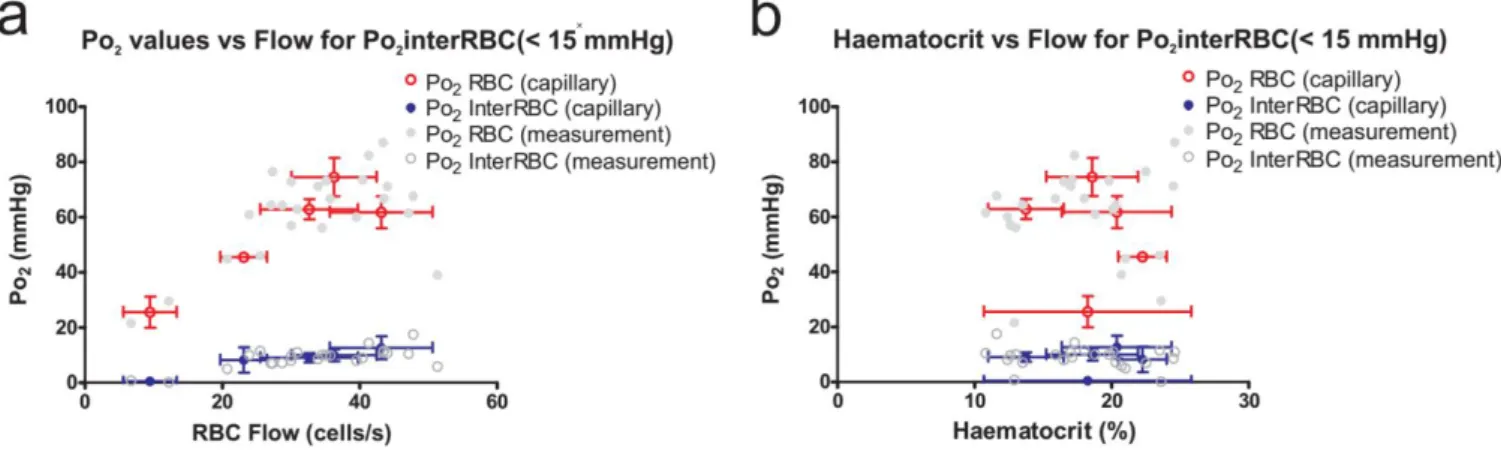
3.1.5 – Capillary blood flow parameters in areas of low tissue Po2 in the olfactory bulb glomerular layer 81 Section 2 – Oxygenation of the superficial layers of the somatosensory cortex ... 82
3.2.1 - Capillary and local tissue Po2 in the somatosensory cortex ... 82
3.2.2 – Capillary RBC flow and haematocrit in the somatosensory cortex ... 84
3.2.3 – The relationship between capillary blood flow and Po2 in the somatosensory cortex ... 86
3.2.4 – The relationship between capillary haematocrit and Po2 in the somatosensory cortex ... 87
3.2.5 – Capillary blood flow parameters in areas of low tissue Po2 in the somatosensory cortex ... 88
3.2.6 – Laminar variations in capillary Po2 in the somatosensory cortex ... 89
3.2.7 – Laminar variations in capillary RBC flow and haematocrit in the somatosensory cortex ... 92
3.2.8 – Laminar variations in the relationship between capillary blood flow parameters and Po2 in the somatosensory cortex ... 92
3.2.9 – Po2 in penetrating arterioles and venules in the somatosensory cortex ... 97
Section 3 – The effect of isoflurane anaesthesia on capillary Po2 and RBC flow rates in the brain ... 99
Section 4 – Summary ... 101
PART 4: DISCUSSION ... 102
Section 1 – The olfactory bulb glomerular layer ... 103
1.1 – Po2 in the olfactory bulb GL ... 103
1.2 – RBC flow and haematocrit in the olfactory bulb GL... 104
1.3 – Correlations of Po2 with capillary haematocrit and RBC flow in the GL ... 105
1.4 – Low tissue Po2 in the GL is linked to low capillary haematocrit ... 105
1.5 – Are there hypoxic regions in the GL? ... 105
1-6 – Why are capillary haematocrit levels low in the GL? ... 106
Section 2 – The cerebral cortex ... 108
2.1 – Capillary haematocrit in the awake cortex is higher than previous estimates from anaesthetised mice 108 2.2 – Cortical tissue Po2 is correlated with both capillary haematocrit and RBC flow ... 109
2.3 - Tissue Po2 is lower in layer I than in underlying layers ... 109
2.4 - The correlation of Po2 and blood flow parameters in layers II/III and IV ... 110
2.5 – Po2RBC is independent of blood flow parameters in layer IV... 112
2.6 – Penetrating arterioles and venules in the cortex ... 112
Section 3 – Comparison of Po2 and RBC flow in the awake state and under isoflurane anaesthesia ... 113
Section 4 – Comparison of my data with previous measurements of PO2 in the awake brain ... 114
Section 5 - Comparison of my data with similar measurements made under anaesthesia ... 115
Section 6 – Appraisal of Sakadzic et al. (2014) “Large arteriolar component of oxygen delivery implies a safe margin of oxygen supply to cerebral tissue” ... 117
6.1 – Experimental animal preparation ... 117
6.2 – Measurement of near-RBC PO2 and its difference from PO2RBC ... 118
6.3 – Change in ‘PO2RBC’ with depth in the cortex ... 120
6.4 – Evidence for a large supply of oxygen to the cortical tissue from arterioles ... 120
6.5 – Conclusion ... 123
Section 7 – A perspective on the applicability of anaesthetised animal preparations in cerebrovascular research 124 Section 8 - Potential application of the present data to theoretical studies of oxygen dynamics ... 125
Section 9 - Remaining questions and future directions ... 126
PART 5: CONCLUSION ... 129
x
Bibliography ... 134 List of Figures ... 144
1
2
Chapter 1: Oxygen, Metabolism and the
Brain
Section 1 – Cellular metabolism, ATP turnover, and the role of oxygen in these processes
1.1 – Thermodynamics and the central role of ATP in the processes of life
Life can be defined as a temporary, but regenerative, area of order in a universe of ever-increasing disorder.
For any process to occur, the end result must involve an increase in the entropy of the universe. Overall increases in entropy are understood as decreases in the Gibb’s energy associated with a particular process. The Gibb’s energy is decreased in any overall process that can occur, and so it can be thought of as denoting the thermodynamic potential of a process to occur.
On all scales from macromolecules to whole individuals, the order implicit in the structure and organisation of organisms requires that the processes that establish and maintain this order be coupled to processes that increase disorder elsewhere.
This holds true for the biosphere as a whole (with overall increasing disorder generated by reactions in the sun or by the exothermic oxidation of inorganic molecules such as hydrogen sulphide in chemosynthesis), and within individual organisms down to the cellular and biomolecular level1.
1
Although the general principle discussed here is applicable to all life, for the purposes of this thesis the discussion will be limited to processes concerning eukaryotic heterotrophs, and more precisely to mammals.
3
Some such processes can be coupled directly, such that the entropy increase induced by one allows for the other to proceed in spite of its own thermodynamic unfavourability. An example of this type of direct coupling of processes can be seen when one considers the transport of glucose into enterocytes from the intestinal lumen. The sodium-glucose symporter proteins provide a mechanism for co-transport of sodium and glucose across the cell membrane. In this case, the increase in order (and decrease in entropy) associated with moving glucose against a concentration gradient is counterbalanced by the increased disorder induced by sodium moving along a concentration gradient, thus rendering the entire process a spontaneous, thermodynamically possible one.
Mechanisms that are available to allow other processes to occur however are not directly coupled, and require an intermediate process to allow for coupling.
If we once again consider the example of co-transport of sodium and glucose out of the intestinal lumen across the enterocyte apical membrane, one can ask how it is that a sodium concentration gradient exists across the cell membrane in the first place. In this case, the gradient is maintained by the operation of the Na+-K+ ATPase.
This protein antiporter extrudes 3 Na+ ions from the cell (while bringing 2 K+ ions
into the cell), with this process made thermodynamically possible by the increase in entropy associated with the hydrolysis of one molecule of adenosine triphosphate (ATP) into an adenosine diphosphate (ADP) and an inorganic phosphate (Pi).
In an aqueous solution at 37°C the ATP ⥨ ADP + Pi reaction will reach an equilibrium whereby almost all the ATP has been dissociated into ADP + Pi. In cells however, the concentration of ATP is typically 1-10 mM, which is ~3-10 times that of ADP, and thus this reaction is very far from equilibrium (a displacement of ~1010
4
thermodynamically favourable. ATP hydrolysis is coupled mechanistically to many other processes in the organism, and in this way, ATP serves as an energy currency, allowing these thermodynamically unfavourable, order generating, processes to proceed. These processes and reactions include such essential biological functions as the synthesis of nucleic acids from nucleotides, synthesis of proteins from amino acids, transport across membranes (for example to generate, maintain and restore ion gradients and membrane potentials), and intracellular transport processes.
The maintenance of the ATP ⥨ ADP + Pi reaction far from equilibrium is central to the utility of ATP as a thermodynamic intermediate. This state is maintained by continuous production of ATP from ADP and Pi. The fact that progress of the reaction in this direction to produce ATP is itself thermodynamically unfavourable is circumvented by coupling this synthetic reaction to controlled catabolic consumption of complex molecules. This serves to increase the total entropy sufficiently to allow the overall process to progress.
In this way, the ordered structure and operation of eukaryotic heterotrophs is generated and maintained by linking these processes to the disordering of other complex structures, leading to a global increase in entropy. ATP’s role in this overall process is to allow for coupling of spatially and temporally separated steps by acting as an intermediate store of thermodynamic potential (in this case Gibb’s energy). The mechanisms that underlie synthesis of ATP in mammalian systems will be discussed in the following section.
5
1.2 – Cellular production of ATP
The total mass of ATP in the human body at any one time is approximately 100g. However, a resting adult human consumes approximately 40kg of ATP over the course of 24h, and indeed during strenuous exercise, the rate of ATP consumption can be as high as 0.5kg per minute (Berg et al., 2002) . Thus it is necessary that ATP is continually replenished, primarily achieved by synthesis from ADP and a Pi. In the
following description, unless stated, the production of ATP is achieved in this way, with the consumption of 1 ATP and 1 Pi, resulting in the production of 1 ADP and 1
H2O.
Generally, animal cells have two mechanisms in which ATP is produced by oxidation of energy substrates (primarily glucose but also fatty acids)2. The first,
glycolysis, is a complex series of reactions, the end result of which is the splitting of a molecule of glucose to produce two pyruvate molecules, two NADH molecules and two ATP molecules. Pyruvate is readily interconverted with lactate, with the oxidation of an NADH molecule to NAD+, or the reduction of NAD+ to NADH for
the production of lactate or pyruvate respectively.
The second way of making ATP in cells is via a linked set of processes, which utilise the pyruvate (either generated directly from glucose or indirectly from lactate) and fully oxidise it to CO2, with the energy liberated being used to generate large
quantities of ATP. In contrast to glycolysis, which takes place in the cytosol, these processes all take place in mitochondria.
2
The brain metabolises only a very small amount of fatty acids, utilising almost exclusively glucose, as evidenced by its respiratory quotient of nearly 1 (0.97, with this number representing the ratio of CO2 production to O2 consumption by the brain, and indicating that carbohydrates are the primary
energy substrate) (Clarke and Sokoloff, 1999) . For this reason I will only discuss metabolism of glucose as an energy substrate.
6
In the first of these processes, the pyruvate is conjugated to coenzyme A to form acetyl CoA, which also involves the reduction of an NAD+ to NADH. Acetyl CoA can
also be produced from fatty acids, with the production of 1 NADH and 1 FADH2
from NAD+ and FAD respectively.
Acetyl CoA acts as an intermediate to transfer the acetyl group into the process known as the citric acid cycle (or alternatively, the Krebs cycle, or the Tricarboxylic acid [TCA] cycle). In this cycle, the acetyl group is completely oxidised to CO2, with
the production of 6 reduced NADH and 2 FADH2 molecules (along with one GTP).
7
The NADH and FADH2 produced throughout these steps are vital to the final
process which is oxidative phosphorylation. This process is carried out by a series of protein complexes (the electron transport chain) which sit in the mitochondrial inner membrane and which co-operatively act to oxidise the NADH and FADH2 in a
controlled fashion, and to harness the free energy released to pump H+ ions from
inside to outside the mitochondrial inner membrane. This extrusion produces a H+
gradient across this membrane. The energy stored in this gradient is used to power the ATP-synthase enzyme. This protein complex provides a passage for H+ to flow to
the inside of the inner membrane, but their passage induces rotation and
Introduction Figure 2. Schematic diagram summarising steps involved in oxidation of pyruvate (and fatty acids) in the mitochondria, and subsequent production of ATP via oxidative phosphorylation. Adapted from (Lodish et al., 2000)
8
conformational changes in the enzyme such that ADP and Pi are combined to form
ATP.
The constituents of the electron transport chain (Complexes I to IV), all contribute to the controlled oxidation of the NADH and FADH2 coenzymes. This allows the H+
extrusion to proceed, but it is at complex IV, cytochrome c oxidase (or simply cytochrome oxidase), that the corresponding reduction aspect of the redox reaction occurs. Electrons, garnered from the coenzymes and passed along the electron transport chain complexes and cofactors, are transferred to oxygen along with 2 H+
ions to form H2O.
Therefore, oxygen acts as the ultimate acceptor of the electrons which are taken from the reduced coenzymes. It is molecular oxygen’s substantial oxidising power that provides the thermodynamic drive to allow this series of electron-transferring and H+-translocating reactions to proceed. Thus, production of ATP at the ATP synthase
is completely dependent on oxygen.
Glycolysis, which does not involve molecular oxygen, produces only 2 ATP molecules per glucose molecule consumed. Conversely, the processes that converge on ATP production in the ATP-synthase can theoretically produce up to 34.6 ATP molecules (plus 1 GTP) by the complete oxidation of the two resultant pyruvate molecules to CO2. Although the actual rate of ATP generation is approximately 30
ATP per glucose molecule consumed (Rolfe and Brown, 1997; Raichle and Mintun, 2006) (mostly due to loss of electrons along the electron transport chain and H+ leak
across the inner membrane), it is nonetheless clear that the vast majority of ATP production capability in animal cells is critically dependent on the presence of oxygen.
9
For each molecule of glucose that is fully oxidised, 6 O2 molecules are consumed. The
approximate number of ATP molecules produced by full oxidation of a glucose molecule is 32, of which 2 come from glycolysis, and thus 30 come from oxidative phosphorylation. This means that although the theoretical correspondence is approximately 6 ATP produced per 1 O2 consumed, the actual ratio is closer to 5.3:1.
Considering only the ATP produced via oxidative phosphorylation, the ratio is approximately 5 ATP produced per O2 molecule consumed.
10
Section 2 – Oxygen in Physiology
2.1 – The physical and chemical properties of oxygen in biological systems
Oxygen can be measured in a number of different but related ways. Three essential parameters when considering oxygen in mammalian physiology are the concentration of dissolved oxygen ([O2]), the partial pressure of oxygen (Po2), which
is related to the absolute number of O2 molecules, the temperature and the local
pressure, and the oxygen saturation of haemoglobin (Hb) in the red blood cells (RBCs) of the blood. This saturation is the proportion of Hb which has an O2
molecule bound to it. It is abbreviated as So2 and is expressed as a percentage. Hb-O2
binding, So2 and their relationship to Po2 will be discussed later (in section 2.2 of this
chapter).
In physiology, Po2 is typically expressed in units of millimetres of mercury (mmHg)
or torr (Torr) (1 mmHg ≈ 1 Torr ≈ 133.3 kPa), and is related to the dissolved O2 by the
relationship:
[ ] = ( )( )
(Henry’s law, where α is the solubility coefficient of oxygen in the solvent, often approximated as 3 × 10⁻⁵ ml O2/ ml liquid/ mmHg, for blood plasma, intracellular
fluid and interstitial/extracellular fluid [ISF]). The Po2 influences diffusion, and
spatial Po2 differences establish diffusion gradients which are integral to gas
transport in the body.
In addition to its essential role in eukaryotic metabolism (as the terminal electron acceptor in the electron transport chain), oxygen is a potent toxin. These two properties are intimately related, as they both derive from the two unpaired electrons
11
in molecular oxygen’s valence shell. These electrons confer a very large redox potential and make O2 the very powerful oxidising agent that it is. Production of
reactive oxygen species (ROS) occurs during normal cellular and metabolic processes. Although essential in some normal physiological processes, these species are highly toxic, and are capable of oxidising essential cellular elements such as nucleic acids, lipids and proteins, inducing severe cellular and tissue damage. For this reason there are multiple mechanisms by which the body limits the formation of these chemicals and limits the damage wrought by those which are produced. However, in cases of excessive oxygenation, these protective mechanisms can be overwhelmed and oxygen toxicity can ensue. Therefore, in order to maintain sufficient aerobic production of ATP while avoiding oxygen toxicity, Po2 must be
tightly regulated (Acker and Acker, 2004).
The integrated operation of the cardiovascular and respiratory systems serves to facilitate controlled uptake of oxygen from the atmosphere into the body and its appropriate distribution among the various organs, tissues and cells that depend critically upon it.
2.2 – The transport of oxygen from the atmosphere to the mitochondria
Normal atmospheric Po2 is around 159 mmHg (this partial pressure derives from O2
making up ~21% of dry air, and total atmospheric pressure being 760 mmHg).
During inhalation, as air passes through the upper respiratory tract and trachea, the air is warmed and humidified, becoming saturated with water vapour. This increase in PH2O, in addition to both a loss of O2 and an increase in CO2 due to gas exchange
with the blood means that the alveolar Po2 is on average around 100 mmHg. The
12
exchange with the blood. Although a certain quantity of oxygen can dissolve in the plasma and the cytosol of red blood cells (RBCs), the vast majority (~98%) of the oxygen in blood is bound to haemoglobin (Hb) in the RBCs.
Haemoglobin is a protein made of four subunits, each containing of a haem group, which is a porphyrin with an iron atom at its centre. The iron atom is normally in the Fe2+ state and can reversibly bind O2. Each iron atom can bind 1 O2 molecule, and so a
complete Hb tetramer can bind 4 molecules of O2. In human RBCs, the Hb
concentration is around 33% w/v. In theory, 1g of Hb can bind up to 1.39 ml of O2,
however, as a portion of Hb in blood is unable to bind O2 (due to the effects of
oxidation of the iron atom or binding of carbon monoxide) the empirically determined ratio in vivo is closer to 1.34 ml/g (Pittman, 2011). Nonetheless, with approximately 270 million Hb tetramers in each cell (Pierigè et al., 2008) , when fully saturated, a single RBC can bind and transport over 1 billion O2 molecules.
The binding of O2 to Hb is cooperative. Binding of O2 to a single subunit induces a
conformational change in the haemoglobin tetramer that enhances the affinity for the other subunits for O2. Hb in which at least one of the subunits has bound an O2
molecule has an affinity for O2 binding that is around three times as strong as that of
fully deoxygenated Hb.
This cooperativity is reflected in the characteristic sigmoid shape of the oxygen-Hb binding curve (Berg et al., 2002), which relates So2 to Po2 (Introduction Figure 3).
13
Due to the fact that in normal physiology the vast majority of O2 in blood is bound to
Hb, the oxygen carrying capacity of the blood is highly dependent on the amount of RBCs in a given volume of blood. This parameter, the volume of RBCs in a volume of blood is known as the haematocrit (expressed as a % v/v). Systemic haematocrit in humans is around 42-45%, so considering that RBCs are 33% Hb w/v, one can conclude that 100ml of fully oxygenated systemic blood (Po2 ~100mmHg) can bind
and transport ~18.7-20.1 ml of O2 (in addition to a small amount dissolved in the
plasma and the cytosol of blood cells).
The vascular system transports oxygen (primarily bound to Hb in RBCs) around the body. From the lungs, freshly oxygenated blood returns to the heart, from where it is pumped into the aorta, which gives rise to all the main arteries that distribute blood to the disparate areas of the body. In the case of the brain, this blood supply comes from the vertebral arteries and internal carotid arteries, which arise from the subclavian and common carotid arteries respectively, all of which derive their inflow
Introduction Figure 3. Oxygen-Haemoglobin binding-curves of human, rat and mouse blood. Adapted from (Gray and Steadman, 1964)
14
from the ascending aorta. A description of the brain vascular supply is found later in this manuscript (Chapter 2: Section 1).
Generally speaking, from the main arteries, blood is distributed into smaller arterioles and subsequently capillary beds, before progressive re-convergence through the venous network and return to the heart and lungs for re-oxygenation and redistribution.
It is primarily at the level of the microcirculation (the arterioles, capillary network and small venules within a given organ) that O2 (and other solute) exchange occurs
between the blood and the tissue. In the case of oxygen, this occurs via progressive unbinding of O2 from Hb, and its diffusion from the RBCs into the plasma, across the
vascular walls and into the tissue. The affinity that most adult human blood has for O2 means that at normal macrocirculatory Po2 (Arterial blood Po2 ≈ 95-100 mmHg,
mixed venous blood Po2 ≈ 40mmHg) the haemoglobin in the blood will be largely
saturated, but in the microcirculation Po2 values fall to the range where there will be
significant desaturation of HB and release of the bound O2. In the tissue, O2 will be
dissolved in both the interstitial fluid and in cells. Within cells, O2 finally diffuses to
the mitochondria, where it is consumed by reduction to H2O at cytochrome c oxidase
(as described earlier). Representative values of Po2 in different vascular
compartments and in the interstitial fluid are presented in Introduction Table 1.
Compartment Mean Po2 (mmHg) So2 (%) Reference(s)
Arterial Blood ~95 - 100 ~95 - 100 (Pittman, 2011b)
Arteriolar Blood 20 - 80 50 - 80 (Tsai et al., 2003)
Capillary Blood 10 - 50 40 - 60 (Tsai et al., 2003)
Venular Blood 10 - 40 50-60 (Tsai et al., 2003)
Mixed Venous Blood ~40 ~75 (Pittman, 2011b)
Intrastitial Fluid ~20 - (Tsai et al., 2003)
15
2.3 – Mechanisms of oxygen delivery from the microvasculature to the tissue
As it is the main site of oxygen delivery to the tissue, the mechanisms and process that govern oxygen transfer at the level of the microvasculature merit further attention.
Oxygen diffuses according to Po2 gradients, and the difference between Po2 in the
vasculature and the tissue provides the ‘driving force’ for transport of oxygen between these compartments. Thus, at the level of the microvasculature, diffusion of oxygen from the vasculature to the tissue occurs at all points where there is a Po2
gradient to induce this flow.
Most transport of oxygen to the ISF and then the parenchymal cells in a tissue occurs from arterioles and capillaries. Both Po2 and So2 fall progressively along the arteriolar
network, with oxygen continuously being unloaded from Hb and diffusing from the RBCs through the plasma and across the arteriolar wall into the ISF. There is a similar overall longitudinal gradient in capillaries, but the situation is complicated by the fact that capillary luminal size if similar to the diameter of RBCs (Human RBC diameter = ~8µm (Rosen, 1967), mean human brain capillary diameter = ~6.5 µm (Lauwers et al., 2008). Mouse RBC diameter ~6µm (Milo et al., 2010), mean mouse brain capillary diameter ~4µm (Blinder et al., 2013) . For this reason, in capillaries, RBCs proceed in single file, with each RBC being separated from the preceding and succeeding cell by a region of plasma. As O2 solubility is limited in the plasma, the
Po2 will be higher near the RBCs than at greater distance from them. Thus, at a given
point in a capillary, there will be alternating periods of high and low Po2 related to
the passage of RBCs. This phenomenon was initially predicted by Hellums in 1977 (Hellums, 1977) and termed “erythrocyte associated transients” (EATs). These EATs were first experimentally observed in the rat mesenteric microvasculature by Golub and Pittman in 2005(Golub and Pittman, 2005) . The effect of this heterogeneous
16
oxygenation of capillary blood is a decrease in the effective surface area of the capillaries available for O2 diffusive delivery of oxygen to the ISF. Only the areas
near the RBCs that have a Po2 that is greater than that of the tissue will have a net
flux of O2 out across the capillary wall. Conversely, the magnitude of the
vascular-tissue Po2 gradient will be greater in the regions near the RBCs than what would be
understood by simply comparing the mean vascular and tissue Po2.
O2 diffuses from the vasculature according to the vascular-tissue Po2 gradient, thus,
at steady state, the quantity of O2 diffusing across the microvessel wall is equal to the
quantity that is consumed by the tissue that is supplied by that vessel. Additionally, given that the ISF surrounds the cells (which consume and thus act as sinks for O2)
and the blood vessels (which are the local sources of O2), it represents the interface
between these two elements and its Po2 in effect reports the equilibrium between O2
supply and demand. The gradient that exists between microvascular Po2 and
mitochondrial Po2 can be perturbed by increases or decreases in either oxygen
delivery or consumption. The primary reason for changes in O2 consumption rate is a
change in tissue metabolic rate and ATP production via oxidative phosphorylation. Delivery of oxygen to a given tissue volume can be increased either by increasing the total blood flow (and so RBC delivery) into that volume (which thereby increases convective delivery of O2) or by increasing the fractional extraction of that O2 which
is made available by the blood flow in that volume. This can be achieved by increasing the surface area for O2 diffusion, either by increasing the number of
capillaries that are fully perfused in the region (capillary recruitment) but also by increasing the total capillary wall area that is in close apposition to RBCs. This latter mechanism will increase the diffusive flux of O2 from capillaries by increasing the
effective surface area available for diffusion from the higher Po2 regions near RBCs.
This increase in effective surface area can be achieved by increasing local haematocrit. These mechanisms have been observed in peripheral tissues (eg. skeletal
17
muscle) although their relative importance in oxygen delivery to these tissues is a topic of much debate(Pittman, 2011; Poole et al., 2011) .
Section 3 – Metabolism, ATP turnover and Oxygen Consumption in the Brain
The brain is very expensive metabolically. In adult humans, it makes up only 2% of the body’s mass, but accounts for approximately 20% of resting metabolic rate (Attwell and Laughlin, 2001). In mice the brain makes up slightly less of the overall body weight (1.8%), but is proportionally less energetically expensive, contributing around 6.5% of total energy expenditure (Kummitha et al., 2014).
Human brain glucose consumption at rest has been measured at 23 µmol/100g/min. Average adult brain mass is around 1400g in males and 1200g in females. Thus for the whole brain, the total glucose consumption rate is 322 µmol/min for men, and 276 µmol/min for women. There are, however, regional differences in metabolic rate within the brain, with grey matter being more energetically demanding than white matter. Comparisons of metabolic rate for glucose in the human brain shows variations between structures and subregions ranging between 15 – 45 µmol/100g/min, with means of 30-40 µmol/100g/min in the grey matter and around 20 µmol/100g/min in the white matter(Heiss et al., 1984) . Measurements of glucose metabolism in the rat brain show that grey matter glucose consumption ranges between 54 and 197 µmol/100g/min, depending on regional activity levels, whereas white matter consumption rates are more homogenous with values of 33-40 µmol/100g/min(Clarke and Sokoloff, 1999). In rats the rate of cerebral glucose consumption is around 65 µmol/100g/min, which gives a whole brain consumption rate of around 1.24 µmol/min(Linde et al., 1999) (the mass of a rat brain is ~1.9g).
18
By considering that for each glucose molecule consumed in the brain 32 ATP molecules are generated, we can arrive at a set of values for the specific and absolute rates of ATP turnover in the brain. Thus, in humans, ATP turnover rate in the brain as a whole is 736 µmol/100g/min, the rates in the grey and the white matter are 960-1280 and 640 µmol/100g/min respectively, and in total, the human brain consumes on average 8832-10304 µmol/min. In the rat, the equivalent figures are approximately 2080 µmol/100g/min for whole brain ATP turnover rate, 1728-6034 µmol/100g/min and 1056-1280 µmol/100g/min for grey and white matter respectively, and 39.5 µmol/min for the brain’s total ATP consumption.
Considering the rate of oxygen consumption, specific rates for the whole human brain have been measured as 143-156 µmol/100g/min(Madsen et al., 1995; Clarke and Sokoloff, 1999) . This rate is similar for both males and females, giving an average total rate of consumption of 1700-2200 µmol/min.
As an illustrative calculation, we can work out the amount of O2 that could be
dissolved in the brain tissue at any given moment, and compare it to the brain’s rate of O2 consumption. Taking a value of the solubility coefficient of O2 in brain tissue of
3 × 10⁻⁵ ml O2 (ml tissue)-1 (mmHg)-1(Sharan and Popel, 2002) , and a value of 30
mmHg for brain tissue Po2 (which is towards the higher range of the mean Po2 values
that have previously been recorded in the mammalian brain, as collated by Ndubuizu and LaManna in 2007(Ndubuizu and LaManna, 2007) ), dissolved O2 in
the brain can be calculated to be 9 × 10⁻⁴ ml O2 (ml tissue)-1. After appropriate
conversions, we arrived at a value of 4 × 10⁻⁵ mol O2 (g tissue)-1 for the quantity of O2
dissolved in each unit mass of brain tissue.
The resting rate of consumption of O2 in the brain has been measured as up to 1.56
µmol (g tissue)-1 (min)-1 in humans(Clarke and Sokoloff, 1999) , and 3.4µmol (g
19
Thus, human brain is capable of consuming all the O2 dissolved in it in around 1.5s,
and the rat brain will do so in 0.7s. This suggests that there is essentially no tolerance in the brain for an interruption of oxygen supply, and that therefore the rate of consumption must be compensated for by the delivery of an equivalent quantity of oxygen.
The fact that the brain lacks the capacity to store oxygen means that it must constantly be supplied with all the oxygen necessary to support its functioning. Thus, the human brain must receive at least 36.4µmol/s (or 0.815 ml) of oxygen per second.
All of this oxygen must be transported in the blood. Therefore, in the next chapter I will describe the vascular supply to the brain.
20
Chapter 2: Supply of Blood to the Brain,
and our Model Systems.
Section 1 – Blood supply to the Brain
Given the magnitude of brain’s demand for oxygen and energy substrates, and its sensitivity to interruption of their delivery (in humans, consciousness is lost within seconds of a cessation in blood supply to the brain (Raichle and Mintun, 2006) ), it is imperative that it receives a large and reliable supply of blood.
Introduction Figure 4. Diagrams of the ventral surface of the human (left panel) and mouse (right panel) brains, showing major features of the cerebrovasculature. Of note are the vessels which form the circle of Willis (see lower portion of left panel, and text for details), along with the basilar and internal carotid arteries (which supply the blood to the brain), and the major cerebral arteries (ACA, MCA, and PCA, see text for details). Left panel adapted from(Purves et al., 2001) . Right panel adapted from (Lochhead et al., 2014) .
21
The supply of oxygenated blood to the brain is via the two internal carotid arteries and the basilar artery (which itself is formed when the two vertebral arteries merge). In addition to giving rise to branches which supply blood to such structures as the pituitary gland, the choroid plexus and many areas of the brainstem, major output of each these three vessels is to the circle of Willis (also known as the cerebral arterial circle). This critical structure, located at the base of the forebrain, is a network of vessels which form a loop that connects the major inflows from the peripheral circulation to the major cerebral vessels that supply blood to the forebrain Introduction Figure 4. The basic structure of the circle of Willis is composed of the two posterior cerebral arteries (PCA, which diverge from the basilar artery), the two internal carotid arteries, and the two anterior cerebral arteries (ACA), along with the anterior communicating artery and the two posterior communicating arteries.
The ACA and PCA, in addition to the middle cerebral arteries (MCA), also form the major outflows from the circle of Willis. These three pairs of arteries are commonly referred to as the major cerebral arteries, and provide the bulk of the blood supplied to the cerebrum.
These vessels give off many branches which supply subcortical structures (for example the central branches of the MCA irrigate such structures as the thalamus, the striatum and the internal capsule). However, the main branches of these arteries proceed onto the cortical surface where they divide to into a network of pial arteries. Each of the major cerebral arteries has a broadly defined territory in the forebrain for which they almost exclusively provide the blood supply, although arterio-arterial anastamoses between certain downstream vessels allow for a degree of flow redistribution at the borders of these territories. Generally speaking, the ACA supplies a region that encompasses the medial portions and extends into the dorso-medial portions of the frontal and parietal lobe. Conversely, the MCA supplies a volume of the forebrain in the dorsal and lateral regions of the frontal and parietal
22
lobes along with the dorso-lateral areas of the temporal lobes, and the insula. Finally, the PCA supplies blood to the occipital lobe, as well as the ventro-medial areas of the temporal lobe.
The pial arteries lie on the surface of the cortex, in the subarachnoid space. From these pial vessels, descending arteries penetrate the cortex itself. They subsequently ramify extensively to generate the dense network of the cortical microvasculature. The draining of blood from the brain is accomplished via large intracranial venous sinuses which are fed by both superficial and deep veins and have outflows which return blood to the peripheral circulation. In the case of the neocortex, microvessels in the cortical microvasculature eventually converge upon penetrating venules, which ascend to the cortical surface and allow blood to be drained to the pial venule network. From here the blood flows into collecting superficial veins and thence to the sinuses.
23
Section 2 – Our Model Systems
In the research presented in this dissertation, I concern myself mainly with two particular brain areas: the olfactory bulb, and the somatosensory cortex. I will thus present a more in depth treatment of these two regions, discussing their organisation and function
2.1 – The olfactory bulb
The olfactory bulb is a forebrain structure, which in humans is located to ventral to the frontal lobe but in rodents is rostral to the frontal lobes near the dorsal surface of the skull. It consists of two substructures: the main olfactory bulb and the accessory olfactory bulb. In my work I have dealt exclusively with the main olfactory bulb, will thus focus only on it during this introduction, and will refer to it simply as the olfactory bulb.
2.1.1 – Structure and basic functions
It has a relatively simple laminar structure, consisting of six well defined layers. Proceeding from the most superficial to the deepest layer they are, in order: The olfactory nerve layer (ONL), the glomerular layer (GL), the external plexiform layer (EPL), the mitral cell layer (MCL), the granule cell layer (GCL), and the internal plexiform layer(IPL).
It is the first central relay of the olfactory system, and importantly for our work, the first synaptic contact in this system occurs in the glomeruli of the olfactory bulb, which are located in the superficial GL (at a depth of approx. 40-150µm in the mouse), such that those in the dorsal portion of the bulb are accessible for in vivo imaging studies.
24
The basic circuit of the olfactory bulb is as follows: Olfactory sensory neurons (OSNs) located in the olfactory epithelium project both cilia into the nasal cavity, and axons, through the cribiform plate, towards the olfactory bulb. Axons expressing particular forms of olfactory receptors become associated into fascicles which eventually extend through the ONL to one of two specific glomeruli which are located on opposite sides of the olfactory bulb.
These glomeruli are areas of neuropil which are formed by the terminals of incoming OSN axons, and the dendrites of mitral cells and tufted cells, along with those of a heterogeneous array of juxtaglomerular neurons and the processes of GL astrocytes. They are essentially devoid of cell somata, and thus can be conceptualised as functional units composed entirely of synaptic and peri-synaptic structures.
In the mouse, the GL of each bulb contains between two- and four-thousand glomeruli (Mombaerts, 2006; Richard and Taylor, 2010) arranged in a broadly stereotyped map (Soucy et al., 2009) which contains an axis of mirror symmetry, such that the two glomeruli in each bulb that receive the axons from a specific class of OSNs are located on opposite sides of the bulb.
Each glomerulus receives input from some 5 x 10³ OSNs, encompasses the axial tufts
of around 25-50 mitral cells and 60 tufted cells, and are contacted by the processes of approximately 100 juxtaglomerular neurons and around 20 astrocytes(Nawroth et al., 2007) . The cell bodies of the juxtaglomerular neurons and glomerular-layer astrocytes are located in the interglomerular regions of the GL, those of tufted cells are located in the EPL, and mitral cell somata are located in the MCL.
Mitral and tufted cells are the main output neurons of the olfactory bulb, and project to numerous cortical and subcortical structures which deal with the processing and interpretation of olfactory stimuli.
Both mitral and tufted cells have extensive lateral dendritic arbours in the EPL and are contacted there by the similarly extensive processes of GABAergic granule cells to form reciprocal dendro-dendritic synapses.
25
Although a gross simplification, the olfactory bulb response to an odour stimulus can be described thus:
Odourant receptors on OSN cilia in the nasal epithelium are activated by the binding of the odourant molecules for which they have sufficient affinity. In response the OSNs fire action potentials, which proceed to the glomeruli. Here, pre-synaptic glutamate release is detected by the various post- and peri-synaptic elements of the relevant glomeruli. The circuit and synaptic interactions are already quite complicated at this level, potentially involving GABAergic, dopaminergic and glutamatergic inputs from varous juxtaglomerular cells and dendritic release of glutamate by both mitral and tufted cells.
Subsequent mitral and tufted cell activity is further influenced by their interactions with one another and with granule cells. Their final action potential output is then transmitted to higher areas for further treatment.
2.1.2 – Vascular supply and organisation of the olfactory bulb
Blood is supplied to the olfactory bulb by the olfactofrontal artery and the ventral olfactory artery, both of which are branches of the ACA. They each divide into a lateral and a medial branch, which proceed into the bulb, towards the dorsal regions in the case of the olfactofrontal artery and the ventral regions for the ventral olfactory artery (Coyle, 1975) . A number of anastmotic connections were observed between the medial and lateral branches of each artery, and also between the vessels of the ventral and dorsal regions. These large arterioles were situated near the surface, but give rise to smaller branches which penetrate into the bulb and supply the deeper laminae.
These observations fit with those from our own laboratory. In in vivo experiments, we commonly observe the existence of a small number of large vessels (both veins and arteries) on the dorsal surface of the bulb, and a larger quantity of minor
26
arterioles and venules in the EPL, which appear to be branches of these large vessels, some of which descend into the GL and beyond.
The organisation and distribution of vascular elements in the bulb
The vascular organisation of the olfactory bulb has yet to be thoroughly explored, particularly in the case of the deeper laminae. The density of vascular elements in the more superficial layers of the rat olfactory bulb has been studied however, initially by Borowsky and Collins (Borowsky and Collins, 1989) using histological approaches in fixed olfactory bulb slices, and subsequently here in the Charpak lab using in vivo 2-photon imaging(Chaigneau et al., 2007; Lecoq et al., 2009) .
The combined results of these studies show that capillary density of the glomeruli (1056 ± 72 mm/mm3) is higher than both that of the EPL (746 ± 111 mm/mm3) and of
the ONL, the latter of which is essentially devoid of capillaries (only 45 ± 26 mm/mm3). This value of capillary density in the GL is among the highest recorded in
the brain. The calculated average distance from any given point to the nearest capillary was calculated to be 36.55 ± 1.69 µm in the ONL and 10.78 ± 0.73 µm in the glomeruli.
The density of larger microvessels, either arterioles or venules, is also low in the superficial layers of the dorsal olfactory bulb. The average distance from any given point in the ONL to a blood vessel (be it a capillary or a larger vessel) was determined to be approximately 28 ± 5 µm.
The capillary network in the GLs appears to be continuous and relatively homogenous, with no apparent functional organisation relative to the glomeruli. Indeed there are typically numerous capillaries that cross the inter-glomerular space and others which can traverse multiple glomeruli. (Chaigneau et al., 2003)
27
2.2 – The somatosensory cortex 2.2.1 – Structure and basic functions
The cerebral cortex is a thin layer of grey matter that forms the outermost regions of the cerebrum. The neocortex is characterised by a 6-layered structure, named layers I to VI proceeding from the pial surface to the sub-cortical white matter. The relative volumes and exact function of each layer varies somewhat with the area of the cortex considered, but nonetheless some basic parameters hold true. Classically the layers are described and distinguished based on their neuronal content. Layer I has few neuronal cell bodies, consisting mostly of axons and dendrites of cells located in deeper layers. Layers II and III both contain multiple cell types with smaller spherical neurons predominating in layer II and pyramidal cells being more prominent in layer III. Layer IV densely packed with smaller spherical cells with stellate cells being common, whereas layer V contains many large pyramidal cells which send their apical dendrites up through all the overlying layers. Layer VI, the deepest layer of the cortex, borders the underlying white matter and contains multiple different types of neurons which make connections with intracortical and subcortical structures.
The cortex as a whole is made up of vertically-oriented modules which seem to represent the basic functional unit. These modules, also known as cortical columns, consist of 200-400 µm diameter portions of the cortex that encompass the entire depth of the cortex within that area.
These columns receive and process information from either thalamocortical inputs, corticocortcal fibres or a combination of both, in addition to neuromodulatory inputs from subcortical nuclei. It is thought that the basic circuit organisation is similar across different regions of the cortex, though the input and output projections will vary according to location and function of the modules(Douglas and Martin, 2004) . A very general description of the circuit is that thalamic input to the cortical area is targeted primarily to layer IV, and that layer IV excitatory neurons synapse onto
28
pyramidal neurons in the more superficial layers. The axonal arbours of layer II and III neurons project to multiple targets including other Layer II and III neurons, layer IV neurons in other cortical area and also neurons in layer V of the same column, which in turn project to layer VI. Layer VI neurons then project either back to layer IV to complete a loop, or out of the cortex to the thalamus or other targets. This coarse description has been found to generally hold true for sensory and motor areas across multiple mammalian species (Douglas and Martin, 2004) .
The somatosensory cortex, located in the parietal lobe, is responsible for the initial cortical processing of sensation from the body. In humans it is located in a strip of cortex behind the central sulcus that runs from the midline to the most lateral aspect of the parietal cortex. The afferent input from the various parts of the body is organised such that there is a somatotopic representation of the body in the brain. This means that adjacent areas in the cortex receiving the input related to areas adjacent of the body, albeit with there being differences in the size of the cortical areas which represent the various regions of the body, with a correlation existing between the density of peripheral innervations and the size of the area in which it is represented. This can be clearly seen in Introduction Figure 5 (left-hand panel), in which the relative extent of cortical representation is mirrored by the apposed distorted image of a human body.
In rodents the primary somatosensory cortex is positioned in a homologous area of the cortex to that of humans, however its location is more difficult to discern based on anatomical features due to the lack of sulci and gyri in the rodent cortex. Nonetheless, the location of these areas of cortex can be approximated by use of stereotaxic co-ordinates. In adult mice, the primary somatosensory cortex covers large areas of the laterodorsal cerebral surface from around 2mm anterior to 2mm posterior to Bregma, with the areas representing the head, face and limbs lying between 0.6mm anterior and 1.2 mm posterior to Bregma and 1-4 mm either side of
the midline(Paxinos and Franklin, 2001)
rodent also displays a somatotopic representation of the body, but the relative proportions are different to that in humans, with relatively small areas receiving information from the paws and trunk as compared to those which are receive and process afferents relating to the face and especially the whisker
The rodent equivalent to the human somatotopic homunculus is presented in Introduction Figure 5 (right
In the experiments which I have performed as part of my research, I have focused the fore- and hind-limb related regions of the primary somatosensory cortex, which are located between roughly
3 mm either side of the midline cortical laminar depths and thic
Thickness (µm)
Layer I 62.7 ± 8.2
Layer II/III 205.6 ± 14
Layer IV 182 ± 8
Introduction Figure 5. Diagrams showing the somatotopic representat somatosensory cortex of the human (left panel) and rat (right panel) (Kandel et al., 2000) . Right panel adapted from Seelke et al. (2012) Chapin and Lin (1984) (Chapin and Lin, 1984)
Introduction Table 2. Thickness and approximate range of depths from the cortical surface occupied by different layers I-IV in the S1FL and S1FL regions of the mouse somatosensory cortex.
data drawn from Altamura et al. (2007)
29
(Paxinos and Franklin, 2001). The primary somatosensory cortex of the odent also displays a somatotopic representation of the body, but the relative proportions are different to that in humans, with relatively small areas receiving information from the paws and trunk as compared to those which are receive and ts relating to the face and especially the whisker-pad and vibrissae. The rodent equivalent to the human somatotopic homunculus is presented in Introduction Figure 5 (right-hand panel).
In the experiments which I have performed as part of my research, I have focused limb related regions of the primary somatosensory cortex, which are located between roughly 0.5 mm anterior and 1.2 mm posterior to
3 mm either side of the midline(Paxinos and Franklin, 2001). Within this region the epths and thickness are as follows:
S1 FL
Depth from Surface (µm) Thickness (µm)
0 - 70 65.6 ± 7.1
75 - 280 191.7 ± 11.4
290 - 480 162.9 ± 7.3
Diagrams showing the somatotopic representation of the body in the somatosensory cortex of the human (left panel) and rat (right panel) brains. Left panel adapted from
. Right panel adapted from Seelke et al. (2012) (Seelke et al., 2012) (Chapin and Lin, 1984).)
Thickness and approximate range of depths from the cortical surface occupied by IV in the S1FL and S1FL regions of the mouse somatosensory cortex.
data drawn from Altamura et al. (2007) (Altamura et al., 2007).
primary somatosensory cortex of the odent also displays a somatotopic representation of the body, but the relative proportions are different to that in humans, with relatively small areas receiving information from the paws and trunk as compared to those which are receive and pad and vibrissae. The rodent equivalent to the human somatotopic homunculus is presented in
In the experiments which I have performed as part of my research, I have focused on limb related regions of the primary somatosensory cortex, which 0.5 mm anterior and 1.2 mm posterior to Bregma, and
1-. Within this region the
S1HL
Depth from Surface (µm) 0-75
80-280 290-450
ion of the body in the rains. Left panel adapted from ke et al., 2012) (Originally from
Thickness and approximate range of depths from the cortical surface occupied by IV in the S1FL and S1FL regions of the mouse somatosensory cortex. Laminar thickness
30
2.2.2 – Vascular supply and organisation of the Somatosensory Cortex
As outlined earlier, the cortex receives its vascular supply from the major cerebral arteries, which feed the pial artery network that then gives rise to the penetrating vessels and intracortical microvasculature.
The best characterised area of this cortical blood supply is the territory of the MCA, which covers large areas of the cortex, including somatosensory cortical regions such as the barrel cortex. The pial supply in this region is, as in other cortical regions, formed from a series of interconnected loops from which other branching pial vessels and penetrating arterioles arise. Within this looping structure there is a lattice-like backbone structure which allows for robust redistribution of flow within the network(Blinder et al., 2010) . The offshoots and penetrating arterioles on the other hand represent classic “end arterioles” which provide the blood supply to a particular volume of tissue(Hirsch et al., 2012). These penetrating arterioles descend from the pia into the cortex, where they ramify to form the dense network of the subsurface microvasculature.
Duvernoy et al. (1981) described the human cortical vasculature and classified both the penetrating arterioles and venules based on their penetration depth and the layers in which their branching is concentrated (Duvernoy et al., 1981) 3. Group 1
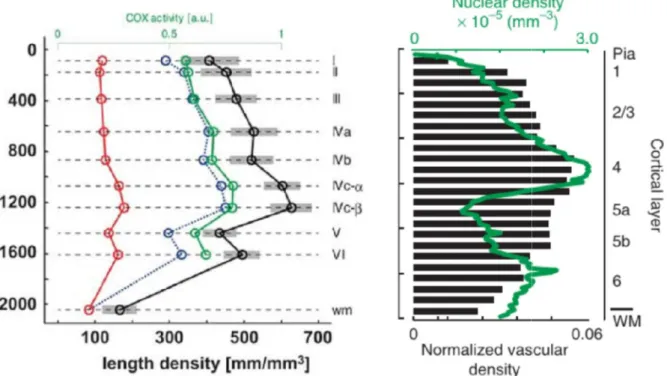
vessels and group 2 vessels reach and ramify in layers I and II, and III respectively. Group 3 vessels are the most numerous, and branch extensively in middle layers of the cortex, primarily in layer IV but also in lower layer III and layer V. Group 4 vessels supply the lower layers of the cortex down to the border of the white matter, and group 5 are similar but with a more extensive supply of the underlying white matter. Group 6 vessels are exclusively arterioles and penetrate through the cortex without branching and only provide extensive vascularisation in the white matter. In addition to the differences in the penetrating vessel supply to different laminae in the cortex, there are variations in the total microvascular and capillary density with
3
The general aspects of the vascular supply to the neocortex are known to be broadly similar across multiple mammalian species (Hirsch et al., 2012) , and are likely to represent a conserved feature in mammals.