THÈSE PRÉSENTÉE À
L'UNIVERSITÉ DU QUÉBEC À CHICOUTIMI COMME EXIGENCE PARTIELLE
DU DOCTORAT EN INGÉNIERIE
PAR
ZAFERKOONT
INTERACTION ENTRE LES PARTICULES D'ALUMINES, LES ALLIAGES D'ALUMINIUM ET SES INCLUSIONS DURANT LA FILTRATION D'ALUMINIUM AVANT LA COULÉE
A THESIS SUBMITTED TO
THE UNIVERSTIY OF QUEBEC AT CHICOUTIMI IN PARTIAL FULFILLMENT OF THE REQUIREMENTS
FOR THE DEGREE OF THE DOCTOR OF PHILOSOHY IN ENGINEERING
BY
ZAFER KOONT
INTERACTIONS BETWEEN ALUMINA PARTICLES, ALUMINUM ALLOYS, AND THEIR INCLUSIONS DURING ALUMINUM FILTRATION BEFORE CASTING
gHevaifi anneme ve turn aifeme ïonsujc de&teaittizi Mr an of sun esiraernedifiniz için minnettarvm...
RESUME
Ce projet a été entrepris pour étudier les interactions entre les particules d'alumine, les
alliages d'aluminium et ses inclusions sous des conditions d'écoulement de l'aluminium
liquide. Le but du projet était de développer une méthode d'essai qui permet de simuler les
conditions similaires à celles dans le procédé de filtration d'aluminium et d'évaluer les
interactions qui ont lieu entre les différents types d'échantillons d'alumine, les alliages
d'aluminium et ses inclusions. Cette méthode d'essai avait pour but de déterminer comment
les différents types d'alumine se comportent durant le procédé de filtration.
Les interactions chimiques entre l'alumine, les alliages d'aluminium et ses inclusions
ont été étudiées dans des conditions d'écoulement statiques et dynamique. Afin d'étudier
ces interactions dans des conditions d'écoulement dynamique, la connaissance du champ de
vitesse au voisinage des particules d'alumine est nécessaire. Dans ce projet, deux systèmes
expérimentaux uniques qui peuvent simuler l'écoulement dans le lit du filtre industriel ont
été conçus et construits. Un modèle mathématique a été développé pour prédire le champ
d'écoulement autour des particules dans le système expérimental. Le modèle mathématique
a été validé en comparant les prédictions avec les résultats d'un modèle physique dans
lequel l'eau était utilisée comme fluide. Ensuite, le modèle mathématique a été utilisé pour
effectuer des études paramétriques afin de déterminer les paramètres de design et
d'opération pour le système expérimental actuel dans lequel les tests ont été faits. Cela a
Des expériences avec divers alliages d'aluminium-magnésium liquide (0, 2, 5 et 7%
Mg, en poids) ont été réalisées pour des différents temps de résidence (de 6 heures à 168
heures) en utilisant les systèmes expérimentaux décrits ci-hauts. Les effets de la vitesse de
l'alliage d'aluminium liquide, de la température du liquide, des propriétés physiques
(porosité apparente, la rugosité de la surface, etc.) et chimiques (teneur en impuretés telles
que Na2Û, SiCh, etc.) sur le degré des réactions interfaciales entre l'alliage d'aluminium et
l'alumine ont été déterminés.
Les échantillons obtenus des expériences aluminium-alumina ont été analysés à l'aide
du microscope optique, du microscope électronique à balayage - la spectroscopie aux
rayons X à dispersion d'énergie (MEB-EDX), du microprobe MEB, et de la diffraction des
rayons X (DRX). Les résultats montrent que les réactions chimiques entre l'alpha-alumine
pure à haute densité et les alliages Mg-Al liquides ne sont pas rapide; mais, la présence des
impuretés (telle que Na2O en tant que phase de bêta-alumine) et la structure poreuse de
l'alumine augmentent l'étendue des réactions significativement. La phase riche en Na2<3
(bêta-alumine) qui se trouve dans toutes les alumines commerciales semble être l'un des
facteurs les plus importants pour les réactions spontanées avec la vapeur de magnésium,
même au temps de résidence le plus court. Mg-spinelle a été trouvé comme le produit de
This project was undertaken to study the interactions between alumina particles,
aluminum alloys, and its inclusions under liquid aluminum flow conditions. The objective
was to develop a test method which can simulate the conditions similar to those in the
aluminum filtration process and to evaluate the interactions taking place between various
types of alumina samples, aluminum alloys, and its inclusions. With this test method, it was
aimed to determine how various alumina types behave under flow conditions during the
filtration process.
Chemical interactions between alumina, aluminum alloys, and its inclusions were
investigated under both static and dynamic flow conditions. In order to study these
interactions under dynamic flow conditions, a knowledge of the velocity field in the
vicinity of the alumina particles is necessary. In this project, two unique experimental
systems which can simulate the flow condition of the industrial bed were designed and
built. A mathematical model was also developed to predict the flow field around the
particles in the experimental system. The mathematical model was validated by comparing
the predictions with the results from a physical model in which water was used as the fluid.
The mathematical model was then used to conduct parametric studies to determine the
design and operational parameters for the actual experimental system in which the tests
were carried out. This allowed the generation of a flow field similar to that of the industrial
filter.
The experiments with various liquid Mg-Al alloys (0, 2, 5, and 7 wt% Mg) were
experimental systems. The effects of the liquid aluminum alloy velocity, the temperature of
the melt, the physical (apparent porosity, surface roughness, etc.) and chemical (impurity
content such as Na2Û, SiÛ25 etc.) properties of alumina samples on the extent of aluminum
alloy/alumina interfacial reactions were determined.
The samples obtained from aluminum-alumina experiments were analyzed by using
the optical microscope, the scanning electron microscope - energy dispersive X-ray
spectroscopy (SEM-EDX), the micro probe SEM, and X-ray diffraction (XRD). The results
indicate that the chemical reactions between high density pure alpha-alumina and molten
Mg-Al alloys are not fast; however, the presence of impurities (such as Na20 as beta
alumina phase) and the porous structure in alumina increase the extent of reactions
significantly. NaiO rich phase (beta alumina) found in all commercial alumina grades
seems to be one of the most important contributors for the spontaneous reactions of Mg
vapor with alumina, even at the shortest residence time. The major reaction product was
ACKNOWLEDGEMENTS
I would like to express my sincere gratitude to my supervisors Prof. Duygu Kocaefe and Dr. Yasar Kocaefe for their unlimited support, guidance, and patience. Without their
valuable help throughout the progress of this project, this thesis could never have been
completed.
I would like to acknowledge the National Science and Engineering Research
Cocuncil (NSERC) of Canada for financial support. I would like to thank Rio Tinto Alcan
Arvida R&D Center for providing the aluminum ingots for the experiments, and also to
Alcoa Chemicals, Aluchem Chemicals, and Alufin Chemicals for sending alumina samples
to be tested free of charge for this study.
I would also thank Mr. Gilles Lemire, Mr. Patrice Paquet, and Mr. Julien Tremblay
for their technical support, Ms. Hélène Grégoire of the Aluminum Technology Center for
SEM analyses, Mr. Paul Bedard of Applied Sciences Department of UQAC for XRD
analyses and valuable discussions on results. I want to express my special thanks to my
friend, roommate, and colleague Dr. Guvenc Ergin for his support, constant
encouragement, and his close collaboration.
I also wish to acknowledge the help provided, in various aspects, by the staff of the
the Engineering Department of UQAC and the ArcelorMittal Dofasco Research and
Development Center. Their support, kindness, and availability were greatly appreciated. I
would like to thank my managers Brian Nelson and Masamichi Ichikawa for their
continuous encouragement, and also all my colleagues at ArcelorMittal Dofasco for their
Last but not least, I would particularly like to thank my mom Hacire, my fiancé
Melissa and my entire family for their precious support in all respects. Their unconditional
love, continuous encouragement, and patience were always there when I needed it the most.
NOMENCLATURE
AP : apparent porosity
Af : time averaged blade angle ABF: alcan deep bed filter at%: atomic percent
Ci: initial solute concentration Cb: bulk solute concentration Cs: surface solute concentration
Co", solute concentration in particle core CD : drag coefficient of cylinder.
Dd : drag coefficient of blade. Dp : diameter of particle, m. D: mass diffusion coefficient EDS : energy dispersive X-ray
spectrometry
EDX: energy dispersive X-ray g : acceleration of gravity, m2/s.
gb: grain boundary h, H : heigth
k : rate constant (sec"1)
K : kinetic energy of turbulence, m2/s2.
M: magnesium concentration MMC : metal matrix composite N : number of blades
NA: not applicable
OES: optical emission spectroscopy PVA: polyvinyl alcohol
r : R e : rpm S : s i :
radius of blade revolution, m. reynolds number
rounds per minute source term, N/m3.
solid liquid interface
SEM: scanning electron microscope XPS: X-ray photoelectron spectroscopy XRD: X-ray diffraction UV: ultraviolet v, w : velocity components in x, y, z directions volume of cell, m3. velocity vector, m/s. u Vc V : x, y, z : cartesian coordinates t: residence time, min n, a: positive constants T : temperature, Kelvin wt %: weight percent w: water
TA : exchange coefficient for (j).
• •• S:
0:
i > : P-co : y: 9 : <ï>s:tilt angle of blade, .
kinetic energy dissipation, m2/s3
general variable kinematic viscosity, m2/s. density, kg/m3 or g/cm3. rotational speed, r/s. surface tension contact angle sphericity
TABLE OF CONTENTS RFSÏTMF » XVXiiLJ KJ X.VM.M1J — — " — — — — — — — — — — — — — — — — — — — — — — — — — — — — — — — — — — — SUMMARY ACKNOWLEDGEMENTS — vii N O M F N r T . À T T T R F - — ÎY J. ^ V ^ l T X X U l ^ V^ JLJxlkX KJ X V I J — — — —— — — — — — — — — — — — — — — — — — — — — — — — — — n^ TABLE OF CONTENTS iv T,TST OF TART,FS viii XJXk_J X V ^ J i . JL x~\JLJJLJMLLJU —————— — — — — — — — — — — — — — — — — — — — — — — — — — — — — — — — y m T T^T O F FTITïTRFSl — , , , — —, , Y XJXkJ JL V-^JL JL Î V J U l V J J k J — — — — — — — — — — — — — j^ I X •
1.1 Deep Bed Filtering of Molten Aluminum — 1 1.2 The Statement of the Problem - 4 1.3 Objective 6
1.5 Originality of the Study 8
2. LITERATURE REVIEW 9 2.1 Alumina — 10 2.1.1 Alumina Minerals 11 2.1.2 Bayer Process 14 2.1.3 Tabular Alumina 17 2.2 Inclusions in Molten Aluminum Alloys—— 23 2.3 Interfacial Reactions — 25 2.3.1 Studies on MMCs 26 2.3.2 Studies on Refractories 37 2.3.3 Studies on Reaction Kinetics 45
3. EXPERIMENTAL SET-UP AND PROCEDURE — 56 3.1 Experimental System Design — 56 3.1.1 Experimental System-I (with Mixer Motion) 5 8
3.2.1 Aluminum Alloy Preparation — 66 3.2.2 Commercial Granular Alumina Particles —— 68 3.2.3 Laboratory Made Alumina Tablets 70 3.2.4 Tablet Preparation Procedure 71 3.2.5 Liquid Metal Velocity — 74 3.2.6 Liquid Metal Temperature 75 3.2.7 Inclusion Study 75 3.3 Physical Characterization of Alumina Samples 77 3.3.1 Apparent Porosity 77 3.3.2 Grain Size Measurements 79 3.3.3 Surface Roughness Analysis 80 3.4 Chemical Characterization of Alumina Samples — 81 3.5 Experimental Procedure — 82 3.6 Ceramographic Sample Preparation — 86 3.7 Analysis of Metallographic Samples 90
3.7.1 Optical Microscopy and Image Analysis — 90 3.7.2 SEM-EDS Analysis 93 3.7.3 XPS Analysis - ArcelorMittal Dofasco R&D Laboratory — 94 3.8 List of Experiments 96
4. PHYSICAL AND NUMERICAL MODELING OF
EXPERIMENTAL SYSTEM-I USING WATER — — 99 4.1 Objectives 100 4.2 System — 100 4.3 Model 104 4.3.1 Source terms for the mixer motion —— 104 4.3.2 Porous Media Resistance— 105 4.3.3 Boundary Conditions 105 4.3.4 Summary of Main Assumptions — 106 4.3.5 Parametric Study 106 4.3.6 Solution technique 106
5. RESULTS AND DISCUSSION 109 5.1 Physical and Mathematical Modeling Results Using Water 109 5.1.1 System Design Simulations 109 5.1.2 Parametric Study — 115 5.2 Physical Characterization of Alumina Samples 118 5.2.1 Apparent Porosity Measurements 118 5.2.2 Grain Size Measurements — 121 5.3 Experiments using Molten Aluminum Alloys 121 5.3.1 Determining Mg Loss in Experiments with Molten Aluminum 121 5.3.2 Minimization of Aluminum Alloy Oxidation —• 124 5.3.3 Effect of Aluminum Alloy Mg content on Affected Zone for Different
Commercial Grade Alumina Particles 125 5.3.4 Effect of Molten Metal Velocity on Affected Zone Thickness for Different Commercial Grade Alumina Particles — — 130 5.3.5 Effect of Commercial Grade Alumina Type on Affected Zone Thickness — 133 5.3.6 Effect of Apparent Porosity on Affected Zone Thickness for Different
Commercial Grade Alumina Particles — 135 5.3.7 Effect of Temperature on Affected Zone Thickness for Different Commercial Grade Alumina Particles 137 5.3.8 Effect of Commercial Grade Alumina Particle Surface Roughness Values on Affected Zone Thickness - 140 5.3.9 Effect of Impurities on Affected Zone Thickness for Different Commercial Grade Alumina Particles — 140 5.3.10 Effect of Temperature and Various Impurities on Affected Zone Thickness Laboratory-Made Alumina Tablets — 141 5.3.11 Comparison of Experimental System-I (Mixer) and System-II Results 143 5.3.12 Comparison of Experimental System-II Top and Bottom Disc Results (Effect of Aluminostatic Pressure on Affected Zone Thickness) 145 5.4 Metallographic Study 147
5.4.1 Metallographic Investigations of Commercial Alumina Particles Before
Contact with Al-Mg Alloys 147 5.4.2 SEM Analysis Results of Commercial Alumina Particles after Contact with Al-Mg Alloys 149 5.4.3 Na-rich Phase Observed in the Commercial Alumina Particle — 152 5.4.4 Metallographic Investigations on Commercial Alumina/Aluminum Alloy
ixixeriace"*———--——-———-—---—--———-—————---—---———-——--—--———---••*—--"-———---——----———--————---" J . D O
5.4.5 Metallographic Examinations of Laboratory-Made Tablets 189 5.5 Thermodynamic Considerations 198 5.5.1 Reactions between 01-AI2O3 and Mg-Al Alloy 199
5.5.2 Reactions between Mg-Al Alloy and Impurities in Alumina 200 5.6 Analysis of the Effect of Flow on the Affected Zone Thickness 201
6. CONCLUSIONS AND RECOMMENDATIONS - — 209 6.1 Conclusions 209 6.2 Recommendations 213
APPFNBTY T
DEVELOPMENT OF AND EXPERIMENTAL SYSTEM WITH LOW VELOCITY SIMILAR TO THAT OF ALUMINUM FILTRATION 223 APPENDIX II 241 RESULTS OF PHYSICAL AND MATHEMATICAL MODELING OF
EXPERIMENTAL SYSTEM-I USING WATER 241 APPENDIX HI 258 AFFECTED ZONE THICKNESS MEASUREMENT RESULTS 258 APPFNTITV TV - 970
. r Y J L X M-Jl y J L / J . Y V X T ————————————————————————————————————————————————————————————————————————————————————— j ^ / \J
LIST OF TABLES
Table 2-1: Comparison of Nomenclatures 12 Table 2-2: Composition of Calcined Alumina 16 Table 2-3: Comparison of Tabular Alumina Grades 21 Table 2-4: Most Common Inclusions in Al-Mg Alloy System .24 Table 2-5: Free Energy Changes for Possible Interfacial Reactions ..29 Table 2-6: Electrochemical Series of Metals at 1027°C and Their Stability 39 Table 2-7: V Value for Different Magnesium Concentrations ...48 Table 3-1: Parameters to Be Studied in the Experimental Study 66 Table 3-2: Chemical Compositions of Industrial Grade Pure Al and Pure Mg Metals 67 Table 3-3: Amount of Al and Mg Metals Required for Alloy Preparations.. 67 Table 3-4: List of the Ingredients Used in the Alumina Tablet Preparation 71 Table 3-5: Molten Aluminum Alloy Velocities Used in the Experimental Study 75 Table 3-6: Molten Aluminum Alloy Temperatures Used in the Experimental Study ..75 Table 3-7: Inclusion Sources Used in the Experimental Study .76 Table 3-8: X-ray Fluorescence Analysis of Tabular Alumina Samples 81 Table 3-9: X-ray Fluorescent Analysis of Alumina Tablet Samples ..81 Table 3-10: The Mixer Speed vs. Molten Metal Velocities [Chapter 5] 84 Table 3-11 : Molten Metal Velocity Calculations for Samples Placed on Rotating Disc 84 Table 3-12: Sample Preparation Procedure 89 Table 3-13: Operational Conditions of XPS Analyses 95 Table 3-14: Experimental Parameters for the Experiments with Commercial Tabular
Alumina Grades (+4.80-6.35 mm) using Experimental System 1 96 Table 3-15: Summary of Experiments Conducted for Testing Commercial Alumina Gravels (+4.80-6.35 mm) Using Experimental System II ...97 Table 3-16: Experiments Conducted with Lab-made Alumina Tablets Using Exp. System II 97 Table 3-17: List of Experiments Conducted for Testing Lab-made Alumina 98 Table 5-1 : System Variable with Respect to the Cases in the Study 110 Table 5-2: Model Results for System Design Simulations 112 Table 5-3: Physical and Mathematical Model Results - Average Liquid Velocities... 114 Table 5-4 : Parametric Study Results (Rotational Speed = 20rpm) 118 Table 5-5 : Apparent Porosity Measurements of Lab-Made Alumina Tablets 119 Table 5-6: Apparent Porosity Measurements of Commercial Alumina Types 120 Table 5-7: Magnesium Loss during Experiments Conducted at 715 °C 122 Table 5-8: The Effect of Daily Magnesium Additions on Final Mg% in the Molten
Aluminum Alloys ....122 Table 5-9: The Effect of Magnesium Additions on final Mg% in the Molten Aluminum
Alloys (Experimental System II) 124 Table 5-10: Summary of Experiment Results for Various %Mg-Al Alloys 127 Table 5.11 : Summary of Results for Various Molten Aluminum Velocities ...130 Table 5-12: Summary of Results for Various Molten Aluminum Temperatures 137
Table 5-13: Total Impurity Content of Commercial Grade Alumina 141 Table 5-14: Stoichiometric Values of Pure Phases ....151 Table 5-15: Quantitative Analysis of Point 1: Reaction Site 1 Shown in Figure 5-36 159 Table 5-16: Quantitative Analysis of Point 2: Reaction Site 2 Shown in Figure 5-36 159 Table 5-17: Quantitative Analysis of Point 3: Reaction Site 3 Shown in Figure 5-36 159 Table 5-18: Standard Gibbs Free Energies of Possible Reactions AT 1000 °K 199 Table 5-19: Summary of 7 day Experiments with Commercial Alumina Grades ...205 Table 5-20: Summary of Diffusion Model Results based on Dynamic Case (with 3.60
mm/s) Experimental Results 205 Table 5-21 : Summary of Mass Transfer Coefficient Calculations for Dynamic Case 207 Table 5-22: Summary of Mass Transfer Coefficient Calculations for Static Case .207 Table Al- 1: Summary of impurities in Argon Gas Reported by the Supplier-Praxair 231 Table A4- 1 : SEM micro probe point analyses results for the spots shown in Figure A4-6
274 Table A4- 2:SEM micro probe point analyses results for the spots shown in Figure A4-14
Figure 1-1 : Molten Aluminum Treatment Stages Before Casting 2 Figure 1-2: A Schematic View of a Deep Bed Filter Process Before Casting 3 Figure 1-3: A View of a Deep Bed Filter During Molten Aluminum Filtration Process 3 Figure 2-1: Specialty Alumina Production Chart 10 Figure 2-2: Major Outlets of Alumina 11 Figure 2-3: Bayer Process Flow Chart 14 Figure 2-4: Tabular Alumina Production Flow Sheet 18 Figure 2-5: Composition / Temperature Stability Regions for (a) Al2O3-MgAl2O4 (b)
MgO-MgAl2O4 Equilibria 31 Figure 2-6: Isethermal Section at 723°C of the Al-Mg-0 System 32 Figure 2-7: Effect of Initial Mg Concentration on the Rate of Mg Concentration Change
During Mixing 34 Figure 2-8: Scanning Electron Microscope Images Showing MgA^C^ Crystals on the
Surfaces of the AI2O3 Particles 36 Figure 2-9: A Schematic View of a Refractory with Inward Corundum Growth 40 Figure 2-10: Experimental Set-up for Dynamic Corrosion Testing ..41 Figure 2-11 : Needle like Structure Phase Developed after Sodium Vapor and Refractory
Binder Interaction in Baspinar's Study 43 Figure 2-12: EDX Analysis Results for Needle-like Structure of the Reaction Product
Formed at Refractory/Aluminum Alloy Interface ..43 Figure 2-13: (a) Bright-field Image, (b) Dark-field Image in a Spinel Reflection, and (c)
Selected Area Diffraction Pattern from Spinel (d) [211] Pattern for Spinel
Superimposed on the Diffraction Pattern 44 Figure 2-14: Image of Micron and Sub-micron Size Spinel Particulates Detected on
Alumina Particles 45 Figure 2-15: Apparent Interaction Zone Thickness vs. Residence Time 48 Figure 2-16: Loss of Mg Resulting from Spinel Formation for Alumina in Super Purity
Aluminum-1 wt%Mg 49 Figure 2-17: Cross-section of Refractory Samples after Different Times of Corrosion 51 Figure 2-18: Increase in Average Corrosion Depth with Time .52 Figure 2-19: Attack of Silica Brick by Al-5.5 wt%Mg Alloy at 800°C in Argon (Solid
symbols refer to as-received brick surfaces while open symbols are cut surfaces) [66] 5 3 Figure 2-20: Schematic Outline of the Refractory Corrosion Mechanism 54 Figure 3-1 : Experimental Set-up for Dynamic Refractory Corrosion Studies 57 Figure 3-2: A Schematic View of the Experimental System-I 59 Figure 3-3: Experimental Assembly for System-I 60 Figure 3-4: Experimental System-1 (a) Pyradia™ Resistance Melting Furnace, (b)
Cylindrical Body Before Being Submerged, (b) Cylindrical Body Partially Submerged into Molten Aluminum.... 61 Figure 3-5: Sample Holder Plate Design (a) Without Alumina Samples, (b)with Alumina
Figure 3-6: A Schematic View of the Rotating Disc Type Experimental System ...63 Figure 3-7: Experimental Assembly for System-II... ....64 Figure 3-8: Experimental System Design #2 (a) Alumina Tablet Experiments with A Single
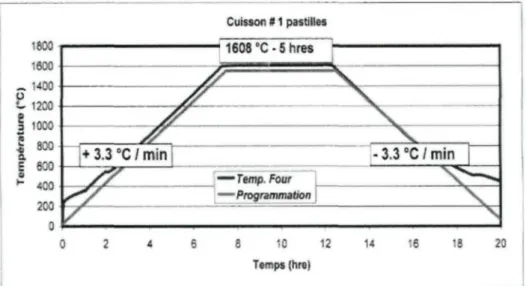
Layer Disc, (b) Tabular Alumina Particle Experiments with Multiple-Layer Rotating Discs... 65 Figure 3-9: (a) The 50 Ton-Capacity Hydraulic Press, and (b) 32 mm 0 Steel Mould 72 Figure 3-10: The Appearance of the Tablets Before and After Sintering at 1600°C ....73 Figure 3-11: The Temperature Profile of the Sintering Furnace During Sintering Process. 73 Figure 3-12: Alumina Tablets Ready for Experiments with Molten Aluminum Alloys 74 Figure 3-13: Inclusion Study Using Alumina Tablets and Pure MgO Balls ....76 Figure 3-14: Revealed Grain Boundaries of Commercial Grade Alumina Gravel ...80 Figure 3-15: Appearance of (a) Alumina Particles, and (b) Lab-Made Alumina Tablets
Before and After Tests 87 Figure 3-16: A Schematic Description of Sample Preparation... 87 Figure 3-17: A Schematic Description of the Cutting of Mounted Sample 88 Figure 3-18: Struers Unitom-2 Cut-off Machine and 26EXO Type Diamond Disc 89 Figure 3-19: View of Samples After Polishing .89 Figure 3-20: Nikon Upright Optical Microscope and its Accessories 91 Figure 3-21: View of an Alumina/Aluminum Interface after an Experiment 92 Figure 3-22: Macro Images of Aluchem type Alumina After Three Day Experiment 92 Figure 3-23: Analysis of the Alumina Gravel Samples After Experiments 93 Figure 4-1: A Schematic Description of the Experimental System-I: Early Design 101 Figure 4-2: Technical Drawings of the Experimental System-I: (a) Early and (b) Recent
Designs 102 Figure 4-3: The Modified Experimental Set-Up Geometry Used in the Model 103 Figure 4-4: General View of the Water Model of the Experimental Set-Up 103 Figure 4-5: Block Configuration of the Model (a) Overall View, (b) Top View 107 Figure 4-6: Mathematical Model Representations of (a) Top Plate (with 41% porosity), (b)
Bottom Plate (48% porosity), and (c) Additional Diffuser Plate (38% porosity) 108 Figure 5-1 : Experimental and Mathematical Model Results for Cases 5 and 6 115 Figure 5-2: Apparent Porosity (Open) Measurements of Lab-made Alumina Tablets 119 Figure 5-3: Apparent Porosity (Open) Measurements of Commercial Tabular Alumina ..120 Figure 5-4: Grain Size Measurements of Commercial Tabular Alumina Particles 121 Figure 5-5: Optical Microscope Images of Unused Commercial Alumina Particles
(a) Naigai, (b) Aluchem 126 Figure 5-6: Cross-sectional Appearance of Commercial Alumina Grades After Experiments
with Liquid Mg-Al Alloys (a) Naigai, (b) Aluchem. 126 Figure 5-7: Effect of Mg content on the Affected Zone Thickness for Alufin Tabular
Alumina Particles 128 Figure 5-8: Effect of Mg content on the Affected Zone Thickness for Naigai Tabular
Alumina Particles 129 Figure 5-9: Effect of Mg content on the Affected Zone Thickness for Alcoa T64 Tabular
Figure 5-10: Effect of Mg content on the Affected Zone Thickness for Aluchem Tabular Alumina Particles 130 Figure 5-11 : Effect of Velocity on the Affected Zone Thickness for Alufin Tabular
Alumina Particles 131 Figure 5-12: Effect of Velocity on the Affected Zone Thickness for Naigai Tabular
Alumina Particles 132 Figure 5-13: Effect of Velocity on the Affected Zone Thickness for Alcoa T64 Tabular
Alumina Particles 132 Figure 5-14: Effect of Velocity on the Affected Zone Thickness for Aluchem Tabular
Alumina Particles 133 Figure 5-15: Effect of Alumina Type on the Affected Zone Thickness Using 2%Mg-Al
Alloy.... ...134 Figure 5-16: Effect of Alumina Type on the Affected Zone Thickness Using 5%Mg-Al
Alloy .134 Figure 5-17: Effect of Alumina Type on the Affected Zone Thickness Using 7%Mg-Al
Alloy... 135 Figure 5-18: Average Apparent Porosity and Affected Zone Thickness Relation 136 Figure 5-19: Grain Size and Affected Zone Thickness Relation ..136 Figure 5-20: Effect of Temperature on Affected Zone Thickness - Alufin .138 Figure 5-21 : Effect of Temperature on Affected Zone Thickness - Naigai ...138 Figure 5-22: Effect of Temperature on Affected Zone Thickness - Alcoa T64 139 Figure 5-23: Effect of Temperature on Affected Zone Thickness - Aluchem 139 Figure 5-24: Alumina Surface Roughness Measurement Results 140 Figure 5-25 : Effect of Impurities in Alumina on Affected Zone Thickness 142 Figure 5-26: Effect of Molten Aluminum Temperature on Affected Zone Thickness 142 Figure 5-27: Results of Alcoa T64 -Dynamic Experiments with 1.8mm/s with (a) 2%Mg,
(b) 5%Mg? (c) 7%Mg-Al Alloy 144
Figure 5-28: A Schematic Description of Experimental System-II : Positions of Top and Bottom Discs 146 Figure 5-29: Experimental System-II: Comparison of Results for Top and Bottom Discs 146 Figure 5-30: Typical Appearance of Various Commercial Alumina Types in Raw State .148 Figure 5-31: Pore Size and Pore Number/mm2 Measurements using Metallographic
Investigation for Commercial Alumina Particles 149 Figure 5-32: Appearance of Alumina Samples Under (a) Day Light, (b) UV Light .150 Figure 5-33: Na-rich Phase in Alcoa T64 Particle (SEM-EDX Analysis Results) 153 Figure 5-34: SEM Mapping Study with Na-rich Phase in Naigai Particle 154 Figure 5-35: Na2Û-AI2O3 Phase Diagram - FactSage 155 Figure 5-36: Inter-granular Reactions in Na-rich Regions 157 Figure 5-37: SEM Mapping Study on Sample Shown in Figure 5.36 .158 Figure 5-38: SEM Image Showing Surface Reaction Zone on Alcoa Particle 162 Figure 5-39: SEM-EDX Analyses at (a) Reaction Zone, (b)Affected Zone on Alcoa T64
Particle 163 Figure 5-40: SEM Image of Unused Commercial Alumina Particle (a) 500x, (b) 2500x..l64
Figure 5-41: EDX Analysis Results of Non-polished Alcoa T64 Particle Surface After 3h of Contact Time at Various Magnifications (a-d), 5%Mg-Al Alloy-1.8mm/s metal
velocity-715°C and E D X Point Analysis Results for (e) Discrete Crystal, and (f) a-Alumina Surface Shown in (c).. 166 Figure 5-42: SEM Image of Non-polished Alcoa T64 Particle Surface After 12-hour
Contact Time 167 Figure 5-43: SEM Images of Non-Polished Alcoa T64 Particle Surface After 24-hour
Contact Time at Various Magnifications (a-f) 169 Figure 5-44: SEM Images of Non-polished Alcoa T64 Particle Surface After 48-hour
Contact Time at Various Magnifications (a) Mg-spinel Crystals and Na-rich Needle-like Structures on Alumina Particle Surface, (b) Single Mg-spinel Crystal with Na-rich Arms Attached on Alumina Particle 170 Figure 545: SEM EDX Point Analysis at Aluminum/Alumina Interface Reaction Zone
-Alcoa Particle ...171 Figure 5-46: SEM Mapping Study at Aluminum/Alumina interface -Alcoa Particle shown
in Figure 5-45 ...171 Figure 5-47: Appearance of a Large Reaction Zone at Alcoa Particle / 5%Mg-Al Alloy
Interface (a) 100x, (b) 200x Magnification Under Optical Microscope 173 Figure 5-48: Presence of Aluminum Metal in Cavities within the Alcoa T64 Reaction Zone
173 Figure 5-49: Dynamic Experiments using Alcoa T64 Type-5mm Particle Alumina with
5%Mg-Al Alloy After (a) 1st Day, (b) 2nd Days, (c)3rd Days at 715°C 174
Figure 5-50: Stages of Localized Alumina Surface Degradation (a) Initiation of
Degradation, (b) Magnesium Diffusion Through Particle, (c) Initiation of Aluminum Infiltration, (d), (e) and (f) Increased Aluminum Infiltration and Accelerated
Degradation 175 Figure 5-51 : Oxide Film Formation with (a) 7%Mg, (b) 5%Mg, and (c) 2% Mg-Al Alloy
177 Figure 5-52: Surface Reaction and Oxide Film Formation at Alumina/7%Mg-Al Alloy
Interface Alcoa T64. 178 Figure 5-53: Surface Reaction and Oxide Film Formation at Alumina Alcoa T64/7%Mg-Al
Alloy Interface (120-hour Contact Time) 179 Figure 5-54: SEM Images of the Oxide Film at the Alumina T64/Aluminum Interface at
Various Magnifications (7%Mg-Al, at 715°C) 180 Figure 5-55: Mg-spinel Crystals on Peeled Surface of Naigai Alumina (Static Experiment
Using 7%Mg-Al Alloy, 3 Day of Contact Time, at 715°C) ...183 Figure 5-56: Mg-Spinel Crystals on Peeled off (a) Aluchem Surface after 3 Day
Experiment with 5%Mg-Al Alloy (b) Bottom Part of Aluminum Skin ..183 Figure 5-57: Interface Reactions using 2%Mg-Al alloy at 715°C (a) Alcoa T64-7day
Dynamic Experiment, (b) Naigai-2day Dynamic Experiment 184 Figure 5-58: Appearance of Industrial Filter Media (Alumina)/Aluminum Interface 186 Figure 5-59: EDX Analysis of Interface Reaction Zone on Actual Filter Media .187 Figure 5-60: SEM Line Scan Investigation Conducted on Alumina Used in Industrial Filter
Figure 5-61: Appearance of (a), (b) and (c) Affected and Reaction Zone, (d) Localized Oxide Film at the Alumina/Aluminum Interface on Actual Filter Media 188 Figure 5-62: Magnesium Diffusion Through Pores of Tablets Made From Reference
Alumina (Alcoa T64) 190 Figure 5-63: Appearance of Reaction Zone on Reference Alumina Tablets with 5%Mg-Al
Alloy After 36-hour Contact Time.... . 191 Figure 5-64: SEM Analysis Made on Reaction Zone of Sample Shown in Figure 5.63.... 191 Figure 5-65: Magnesium Diffusion Through Pores of an Alumina Tablet with (a)High
Soda-0.33% Na2O, (b)High Silica-0.64%SiO2, (c)High Magnesia-0.53% MgO 192
Figure 5-66: Alumina/Aluminum Alloy/MgAl2O4 Triple Point Interaction Zone 193 Figure 5-67: Alumina at the Triple Point Interaction Zone 194 Figure 5-68: Investigation of MgO, AI2O3, and Aluminum Alloy Interactions (a)
Appearance of Sample After Experiment, (b) SEM Image of Triple Interaction Point,
(c) EDX Analysis Result of MgAl2O4. 196
Figure 5-69: (a) SEM Image of Aluminum Infiltrated Part of MgO Shown Figure 5-68, EDX Analysis Result of (b) Dark Phase-MgO, (b) Aluminum Metal Found in Between Dark Phases 197 Figure 5-70: Alumina/MgO Interface -Circled Area in Figure 5-68.a 198 Figure 5-71: Representation of Concentrations of a Diffusing Component Around the
Particle with External Mass Transfer Resistance 202 Figure 5-72: Representation of Concentrations of a Diffusing Component around the
Particle with Negligible External Mass Transfer Resistance 203 Figure 5-73: Calculated Diffusion Coefficient and Apparent Porosity of Commercial
Alumina Grades 206 Figure 5-74: Effect of Liquid Metal Velocity on Cs (Particle Surface Concentration) 208 Figure A l - 1 : First Experimental System Design (Reciprocal Motion) 224 Figure Al- 2: A Schematical Description of the Experimental System-I 227 Figure Al- 3: Second Experimental System Design-I with an Additional Diffuser Plate 228 Figure Al- 4: Excessive Oxide Formation Causes Filter Motion Blocked 229 Figure Al- 5: Experimental System-I with Additional Refractory Piece at Metal Line ....230 Figure Al- 6: Mixer Shaft Broken due to Oxide Formation on Metal Surface 231 Figure Al- 7: Different Sections of the New Experimental Set-up Cylindrical Body 235 Figure Al- 8: Assembled Experimental System-I (Version 4) 236 Figure Al- 9: Sample Holder Base Coated Using boron nitride Hardcoat used for 238 Figure Al- 10: Sample Holder Base with No Coating used for Testing of Tabular Alumina
Particles, (a) Graphite Base, (b) Alumina Base 238 Figure Al- 11 : Rotating Disc Type Experimental System: (a) a Schematic View, (b) Image
of a Disc used in the Experiments 240 Figure A2-1: Effect of Rotational Speed on the Flow Field for 242 Figure A2- 2: Effect of Rotational Speed for Case 2 243 Figure A2- 3: Effect of Rotational Speed for Case 3 244 Figure A2- 4: Effect of Rotational Speed for Case 4.... 245 Figure A2- 5: Comparisons of Flow Fields Between Experimental and Mathematical Model Results for Case4-30rpm 246
Figure A2- 6: Effect of Rotational Speed for Case 5 248 Figure A2- 7: Comparisons of Flow Fields between Experimental and Mathematical Model
Results for Case5-30rpm 249 Figure A2- 8: Effect of Rotational Speed for Case 6 251 Figure A2- 9: Effect of Mixer Diameter (Case 7) on Flow 252 Figure A2-10: Effect of Mixer Angle (Case 8) on Flow 253 Figure A2-11 : Effect of Distance Between Mixer and Top Plate (Case 9) on Flow 254 Figure A2-12: Effect of Mixer Blades (Case 10) on Flow 255 Figure A2- 13: Effect of Particle Size (Case 11) on Flow. 256 Figure A2- 14: Effect of Mixer Rotational Velocity on Surface Flow in the Crucible 257 Figure A3-1 : Alufin Static Experiment Results.... 258 Figure A3- 2: Naigai Static Experiment Results 258 Figure A3- 3: Alcoa Static Experiment Results 259 Figure A3- 4: Aluchem Static Experiment Results 259 Figure A3- 5: Alufin Dynamic Experiment Results 260 Figure A3- 6: Naigai Dynamic Experiment with 2%Mg-Al Alloy Results 260 Figure A3- 7: Alcoa Dynamic Experiment with 2%Mg-Al Alloy Results 261 Figure A3- 8: Aluchem Dynamic Experiment with 2%Mg-Al Alloy Results .261 Figure A3- 9: Alufin Dynamic Experiment with 5%Mg-Al Alloy Results 262 Figure A3-10: Naigai Dynamic Experiment with 5%Mg-Al Alloy Results .262 Figure A3-11 : Alcoa Dynamic Experiment with 5%Mg-Al Alloy Results 263 Figure A3- 12: Aluchem Dynamic Experiment with 5%Mg-Al Alloy Results 263 Figure A3-13: Alufin Dynamic Experiment with 7%Mg-Al Alloy Results 264 Figure A3- 14: Naigai Dynamic Experiment with 7%Mg-Al Alloy Results 264 Figure A3- 15: Alcoa Dynamic Experiment with 7%Mg-Al Alloy Results 265 Figure A3- 16: Alcoa Dynamic Experiment with 7%Mg-Al Alloy Results 265 Figure A3-17: Alufin Dynamic Experiment Results - 3.6mm/s Flow Velocity 266 Figure A3- 18: Naigai Dynamic Experiment Results - 3.6mm/s Flow Velocity 266 Figure A3-19: Alcoa Dynamic Experiment Results - 3.6mm/s Flow Velocity 267 Figure A3- 20: Aluchem Dynamic Experiment Results - 3.6mm/s Flow Velocity 267 Figure A3- 21: Alufin Dynamic Experiments at 750°C 268 Figure A3- 22: Naigai Dynamic Experiments at 750°C 268 Figure A3- 23: Alcoa Dynamic Experiments at 750°C 269 Figure A3- 24: Aluchem Dynamic Experiments at 750°C 269 Figure A4-1: Metallographic Investigation of Alufin - Raw state 270 Figure A4- 2: Metallographic Investigation of Naigai -Raw state 271 Figure A4- 3: Metallographic Investigation of Alcoa T64 - Raw state 272 Figure A4- 4: Metallographic Investigation of Aluchem -Raw state 273 Figure A4- 5: Metallographic Investigation of Aluchem - E7- 2%Mg-Al Alloy- Grain
boundary and Na-rich zone reaction 274 Figure A4- 6: Metallographic Investigation of Aluchem - E7-D1- 5%Mg-Al Alloy 274 Figure A4- 7: Metallographic Investigation of Aluchem - E7- 2%Mg-Al Alloy 275 Figure A4- 8: Metallographic Investigation of Naigai - E9- 3d- 5%Mg-Al Alloy 276 Figure A4- 9: Metallographic Investigation of Naigai - E9- 3d- 5%Mg-Al Alloy 277
Figure A4-10: SEM Mapping Study on Sample shown in Figure A4.9 277 Figure A4-11 : XRD Analysis of Scraped Black Alumina Surface Shown in Figure A4. .278 Figure A4-12: Na rich Alumina Surface (a) E D X Analysis of the spot shown in Figure
6.40.C, (b) optical microscope image of a similar structure found on a different alumina (crossection) ..279 Figure A4-13: EDX Analysis of Na rich Needles shown in Figure 5.43.fin a circled area
...280 Figure A4-14: EDX Analysis of Mg-spinel crystal and Na-rich needles shown in Figure
5.41.b 280 Figure A4-15: Surface and Sub-surface Degradation observed on Alufin Alumina after 1
day (5%Mg-Al Alloy-Dynamic Experiment at 715°C) 281 Figure A4- 16: XPS Analysis Results #1 - 5%Mg-Al Alloy, Alcoa, Static Experiment,
715°C 282 Figure A4- 17: XPS Analysis Results #2 - 5%Mg-Al Alloy, Alcoa, Static Experiment,
715°C 282 Figure A4-18: Appearance of Reaction Zone at Aluchem/5%Mg-Al Alloy Interface - 3
day long dynamic experiment (EDX microprobe results are shown in Figure A4.12 and Table A4.2) 283 Figure A4-19: Mapping study of Alcoa T64 Alumina/Aluminum Interface after 3 day
Dynamic Experiment with 5%Mg-Al Alloy (Red Color: Magnesium, Yellow:
Aluminum metal) 284 Figure A4- 20: 5% Aluchem, Interface Reactions Investigation-3 Day- 1.8mm/s- SEM
EDX Analyses 285 Figure A4- 21: Alcoa Interface- Line Scan- 2%Mg Al Alloy- 1.8mm/s- 3 days 287 Figure A4- 22: Alcoa Interface- Line Scan- 5%Mg Al Alloy- 1.8mm/s- 3 days ....288 Figure A4- 23: Alcoa Interface- Line Scan- 7%Mg Al Alloy- 1.8mm/s- 3 days 289 Figure A4- 24: MgA12O4 powder E D X Point Analysis - Inclusion study 290
Productivity, cost reduction, and quality are indispensable requirements for today's
Canadian aluminum industry in order to stay competitive in a global market. To be able to
meet increasing challenges and demands on productivity and quality of aluminum,
cleanliness of aluminum metal production has a great importance. The size, shape, number,
and distribution of inclusions in the final or semi-final metal products are the indicators of
the performance of aluminum producers and the quality of their alloys. It is obviously a
great advantage to eliminate these impurities, since they reduce the fluidity of the alloy,
increase the internal porosity of metal, change the mechanical properties, and deteriorate
the surface quality and machinability of final or semi-final solid metal products. They can
also be the source of holes or tears in the metal intended for the production of thin sheets or
wires. Therefore, the filtration process of liquid aluminum alloys prior to casting has a
crucial importance to fulfill cleanliness requirements of subsequent processes, in order to
avoid high rejection rates and productivity losses [1-8].
1.1 Deep Bed Filtering of Molten Aluminum
Filtration process is the last possible step for the purification of molten aluminum
metal prior to casting as shown in Figure 1-1. To ensure clean metal production, deep bed
alumina particles with various sizes, and inclusions are separated from the melt.
MOLT©? METAL FROM THE BATH OF FUSED SALT ELECTROLYSIS
TRANSPORTATION OF THE MOLTEN METAL
CHARGING TO THE ALLOYING FURNACE
ALLOYING
FLUXING
ADDITION OF TiCOR TixBy FOR GRAÎN REFINEMENT
INERT GAS DEGASSING + Cl2 Sr OR Sb MODIFICATION
INERT GAS M S ASSING ONLY
FÏLTRAITON 1 ' 1 -~
| CASTING j
Figure 1-1: Molten Aluminum Treatment Stages Before Casting [9-10]
Deep Bed Filter is made of a steel frame associated with a refractory lining, a
filtering material, an insulated lid, and heating units (Figure 1-2 and Figure 1-3). According
to Clement [11], a system of liquid aluminum filtration has a steel structure is divided into
two parts, a filling chamber and a filtering chamber. The first part is the space required for
filling and the second part is the section where the actual filtration is carried out. The
filtering chamber has an approximately height of 1.5 m and a global surface of 2.7 m2. This
particles (3-6 mesh gravel) from falling down through the supporting grids. They also help
distribute the liquid metal uniformly over the filtering surface.
INLET
OUTLET
î T î Î
î î î î
GRID BAR
Figure 1-2: A Schematic View of a Deep Bed Filter Process Before Casting [11, 12]
cast in the foundry lasts about 2-4 hours with a constant metal flow rate. Metal is filtered
continuously prior to casting. The casting period is followed by an inter-cast period of 2-4
hours. During this period, the metal filtration stops. The driving force for filtration is
generated using a gravity-pour principle.
It was reported by Clement [11] that the pore diameter in a deep filter is 100 times
the filtered particle (inclusion) diameter, thus inclusions are captured by adsorption on the
pore walls throughout the entire depth of the filter. The recommended filtration speed
varies from 1 to 4mm/s [11]. Several thousand tons of liquid molten aluminum could be
efficiently filtrated using deep bed filters.
1.2 The Statement of the Problem
An efficient filtration process requires a good quality filter media. However, the
quality of bed media changes from supplier to supplier as well as from shipment to
shipment coming from the same supplier. At this point, industry needs a method which can
predict the efficiency of the filtration. For this, it is important to know the nature of the
interactions between bed media, metal, and inclusions.
The physical simulation techniques and computer-based mathematical models
[13-27] were used in aluminum industry to have a fairly good understanding of the thermal and
hydrodynamic aspects of the filtration process during the last two decades. However, the
mathematical models relied on empirical model parameters obtained from plant data. The
physical and chemical mechanisms involved in aluminum filtration are not well known and
certain discrepancies between the actual filter performance and the one predicted by the
physical and mathematical models still exist. One major reason for this is that the
interactions between filter media, molten aluminum, and inclusions such as reactions taking
place during filter life have never been taken into account in these physical and
mathematical modelling studies.
A literature search [28-72] carried out on the chemical reactions taking place at the
Mg-Al alloy/alumina ceramics interface showed that there is no consensus on the interfacial
reactions occurring and the resulting reaction products. The final product on
aluminum/alumina interface could be either Mg-spinel (MgA^O^, magnesia (MgO), or a
mixture of both. It is evident that the interfacial reactions in all these studies are carried out
under different experimental conditions (differences in aluminum alloy composition,
impurity content of alumina, temperature, residence time, atmosphere control,
etc.).Therefore, the final product found in each study varies. It is pointed out by researchers
that not only the thermodynamics but also the kinetics of the reactions need to be
considered while examining the results.
The interfacial reactions taking place between aluminum and ceramics reported in
the literature are for different applications such as refractories and aluminum interface,
evaluation of refractory corrosion or conducted studies under dynamic conditions [59,
65-66, 73-76]. Jingguo Gao et al [65] reported that the corrosion of refractories under dynamic
conditions is more severe than those observed under static conditions.
No reported studies were found in the literature on the chemical interactions of
inclusions with filter media.
1.3 Objective
In this study, the objective is to investigate the interactions between alumina, liquid
Al-Mg alloys, and its inclusions under both flow (dynamic) and stagnant fluid (static)
conditions. The aim is to better understand the mechanism of interfacial reactions at filter
media/aluminum alloy interface which is not clear in the literature.
1.4 Scope
The characterization of commercial tabular alumina particles regarding grain size,
apparent porosity, chemical composition, and surface roughness properties was conducted.
Chemical interactions between alumina, aluminum alloys, and its inclusions were
investigated under both static and flow conditions. In order to study these interactions
under dynamic conditions, a knowledge of the velocity field in the vicinity of the alumina
particles is very important. Operating a small bed filter for a long period of time is difficult
and costly because metal should be melted and pumped continuously through the filter. In
55 and 7 wt% Mg addition) were conducted for various residence times (from 6 hours to
168 hours) using these experimental systems to determine the following:
Effect of molten aluminum velocity on the extent of aluminum/alumina interfacial
reactions
- Effect of impurities found in alumina (Na2O, SiC^, CaO, MgO) on
aluminum/alumina interfacial reactions
Effect of inclusion presence (such as MgO, MgA^C^) at aluminum/alumina
interface and its impact on interfacial reactions
Measuring the flow of molten aluminum at high temperatures is a real challenge;
therefore, a replica of the experimental system was fabricated using plexiglass and glass. A
visualization technique was used to measure the velocity field under different operating
conditions for various design parameters of the experimental system. A parametric study
was carried out, and tests were done under different conditions using the water model of the
experimental system.
A mathematical model was also developed to predict the flow field around particles
in the experimental system. The mathematical model was validated using the water model
results. This model was then used to conduct parametric studies to identify the design and
operating parameters for the actual experimental system using aluminum in which the flow
the optical microscope, the scanning electron microscope - energy dispersive X-ray
spectroscopy (SEM-EDX), electron micro probe analysis and the X-ray diffraction (XRD).
According to the results of these tests, reaction mechanisms were suggested.
1.5 Originality of the Study
As it is explained above, there are no reported studies in the literature on the
interfacial reactions taking place between alumina (filter media), inclusions, and aluminum
metal or its alloys under dynamic aluminum filtration conditions with long contact times.
One of the reasons for the lack of such studies is the difficulty and cost of laboratory
filtration experiments with molten aluminum.
In this study, an experimental system was designed which can be built at a
reasonable cost and operate under conditions similar to those of industrial filters. This
system is unique and is one of the main accomplishments of this study. It can be used not
only for kinetic studies, but also studies concerning other problems related to aluminum
filtration. In addition, the interfacial reactions taking place during aluminum filtration under
flow conditions and the nature of the reaction products formed were studied. The results
Literature review was focused on the subjects listed below:
i. Alumina products
ii. Inclusions in molten aluminum alloys
iii. Interfacial reactions between alumina ceramics and molten aluminum alloys:
Studies on MMC (Metal Matrix Composites);
Studies on refractories;
Studies on reaction kinetics of interfacial reactions.
As the filter media is made of graded tabular alumina particles, the information on
alumina chemicals which have a very wide variety in the market is of importance.
In the first section of the literature survey, the production methods of alumina
chemicals, especially the tabular alumina manufacturing process, were briefly reviewed in
order to understand better the differences in alumina chemicals as well as the physical and
chemical properties of tabular alumina.
In the second part, the studies on inclusions found in molten aluminum alloys were
summarized.
In the last section, the studies found in literature on alumina ceramics/molten
aluminum alloys interfacial reactions and the methods used to determine their reaction
2.1 Alumina
Aluminum oxide in various forms is used widely in our daily lives. Probably, most
of the people are not aware of the presence of alumina in a wide variety of products ranging
from toothpaste to spark plugs, from automobile motors and paper production to
microchips of TV sets. Figure 2-1 illustrates various forms of aluminum oxide and their
production starting from bauxite mine through various processing stages to a wide variety
of end uses.
BAUXITE M M ! Crusher Washer Dryer Metal Grade Bauxite
Rod mill BAYEH PROCESS
RAimERY ALUMHTOM TREffDRAÏE Fluid Flash Calciner CALCINED ALUMINA HÎIMAHY AMMETOM SMELTER CALCINING KILN
-E
Abbrasive Grade Bauxite — Chemical Grade Bauxite Refractory Grade Bauxite
- Electric Arc . Furnace
Crude Brown Fused " Aluminum Oxide Abrassive s
CHEMICAL " INDUSTRY — BaUmill-Felletizers (Spheres) Controlled Dehydydration Ballnull -Pelletizer (Spheres) Shaft Kiln (Sintering) TABULAR ALUMINA (Spheres) | Crusher I - Detergent
- Mordants, Dyes, Organic Lakes Paper manufacture Sewage treatment Cement Waterproofing Embalming Fluid Leather Tanning Water Treatment Glass and Ceramics
-Pharmaceuticals - Flame Retardants — ~ Fillers and Coating _ Pigments
,akes F
ACTTVATED ALUMINA
LOW SOBA ALUMMA HIGH PURITY ALUMSÎA
Fillers and Coating •
Toothpaste Deodorants Antacids Cosmetics i— Carpet Backing L Poam and Solid Plastics I— Platic Wire Insulation L Wallboard
i ~ Paints, Paper Adhesive, Rubber
r
Wallpaper, Waxes Ink, Paint, Paper, Rubber Claus Process Sulphur Recovery Adsorbent for gases, liquids De sic cantsPetroleum refining Catayst Support, auto exhaust Whiteware, Fine China Porcelain Insulators, Spark Plugs Kiln Furniture
— Synthetic rubies, Sapphires — Cutting tools
Polishing Compounds _ Substrates:Microchips, catalysts _ Translucent Alumina Products r- Glass, Ceramics
Refractories
r- Welding Electrode Coating
*— Epoxy, Silicone, Polyester
i— Catalyst support bed Electric
Arc "~ K «by Fus»» d Ahmûn aCrude White Fmk
Grinding Sizing
- E
1 Abrassives
White Fused abrassive grain Pink Fused abrassive grain Ruby Fused abrassive grain
2.1.1 Alumina Minerals
Aluminum is the most abundant metal and the third most abundant element in the
earth's crust, though it does not occur in the metallic state because of its strong affinity for
oxygen. Only a fraction of the aluminum containing raw materials is being used for the
production of alumina.
Aluminum oxide (AI2O3, alumina, corundum) is the most widely used inorganic
chemical for ceramics and is produced from bauxite mineral using the Bayer process.
Bauxite is the most important aluminum ore. It primarily contains various mixtures
of hydrated aluminum oxide minerals such as gibbsite, bayerite, boehmite, and diaspore.
Major impurities present in bauxite are iron oxides (as hematite, goethite or magnetite;
2-20%), titania (2-8%), and silica (0.5-10%). Other impurities can be listed as the oxides of
calcium, magnesium, gallium, chromium, manganese, and phosphorus. [78-81]
BAUXITE CALCINED ALUMINA REFINING Refractory Abrasive CHEMICAL USES Activated H Alums —* BAYER PROCESS SMTEREROCESS COMBINATION EROCESS METALURGICAL GRADE ALUMINA ALUMINUM METAL 1 ALUMINA CHEMICALS ALUMINUM HYROXIDE ACTIVATED ALUMINA CALCINED ALUMINA Ceramics R e f r a c t o r i e s Abrasives
Bauxites are typically classified according to their intended commercial application:
metallurgical, abrasive, cement, chemical, and refractory. The bulk of world bauxite
production (approximately 85%) is used as raw material for the manufacture of alumina via
a wet chemical caustic leach method commonly known as the Bayer
process. Subsequently, the majority of the resulting alumina produced from this refining
process is in turn used as the feedstock for the production of aluminum metal by the
electrolytic reduction of alumina in a molten bath of natural or synthetic cryolite (NasAlFô)
called the Hall-Héroult process (see Figure 2-2).
Aluminum, oxygen, and hydrogen form three crystalline compounds: AI2O3,
A100H, and Al(0H)3. Different phases of these compounds are given in Table 2-1.
Table 2-1: Comparison of Nomenclatures [78]
Mineral Name Gibbsite Bayerite Nordstrandite Boehmite Diaspore Corundum Chemical Composition Aluminum trihydroxide Aluminum trihydroxide Aluminum trihydroxide Aluminum oxide hydroxide Aluminum oxide hydroxide
Aluminum oxide Accepted Crystallographic Designation Y-A1(OH)3 p-Al(OH)3 A1(OH)3 Y-A1OOH a-AlOOH a -AI2O3 Alcoa (1930) Gamma alumina trihydrate
Beta alumina trihydrate
-Gamma alumina monohydrate
Alpha alumina monohydrate Alpha alumina
Gibbsite (y-Al(OH)y) occurs in huge quantities in bauxites, tropical soils, and clays.
Nearly 30 million tons of gibbsite are produced each year by the Bayer process. Largest
consumption of gibbsite is by the thermal decomposition to metallurgical alumina, which is
Bayerite (P-AKOHW) is rarely found in nature. It can be produced in several ways.
It is produced commercially as a precursor for catalysts, substrates, or adsorbents which
require an aluminum oxide with low sodium content.
Nordstrandite (Al(OH)y) is discovered by Van Nordstrand and his coworkers in
1956. It was found in tropical soils. It has not been commercialized because its structure
and properties are similar to those of gibbsite and bayerite, but its production process is
more complicated compared to theirs.
Diaspore (a-AlOOH) is a major constituent of bauxites of the Mediterranean type,
but also occurs in certain alumina clays and alumina rich metamorphic shales. Commercial
production of diaspore has been almost abandoned because of high temperature and
pressure conditions required for its formation. Gibbsite bauxites are abundant and have
considerably less harsh process conditions than those of diaspore bauxites.
Boehmite (y-AlOOH) is abundant in geologically younger bauxites. It can be
synthesized by treating aluminum trihydroxides or aluminum metal hydrothermally at
temperatures above 375K. Boehmite can be produced by the neutralization of aluminate
solutions at around 473K. Boehmite is an industrially important precursor for activated
aluminas used in the manufacture of catalysts and adsorbents.
Corundum (a-alumina) is the only thermodynamically stable form of aluminum
oxide. It is one of the most important ceramic raw materials in industry. Up to 1960s,
metallurgical alumina used in the Hall-Heraoult process contained high amounts of
a-alumina. In today's practice, products which are only partially transformed to the stable
The prefix a and y are used to designate the hexagonally packed structures and
cubically packed structures, respectively [78].
2.1.2 Bayer Process
Traditionally, 90% of the aluminum hydroxide is produced from bauxite in the
Bayer process which means it is the most important commercial route for the production of
aluminum hydroxide. It was invented almost 100 years ago, but it is still the most
economical way of manufacturing aluminum hydroxide. Consequently, the solubility of
AI2O3 in strongly alkaline solutions has attracted much interest due to its importance for the
Bayer process which is based on the reversibility of the reaction given by Eq. 2.1 between
aluminum hydroxide and an alkali [80-83].
Bayer process produces a nominal 99.5% AI2O3 product. The alumina can be
prepared in a range of grades to suit specific applications mentioned previously. The grades
differ by size and shape of the crystals and the impurity content. The dominant impurity is
with a maximum concentration of around 0.5%.
crushing T«15O-16O*C
Red Mod Separation of solid impuritiesSIO2, TÏO2, Fe2O3
Bauxite
partkk size C-Q.SOMPa)
NaOH
FikrsTion
Ai(OH)3 as
NaiAI(OH)4]
cooling
crystallization seed H > Crystallization - Water Rotary Kiln
The flow chart for Bayer process is shown in Figure 2-3. The steps in this process
are as follows:
Grinding: The bauxite is ground to a particle size of less than 1 mm. This is done to
increase the total surface area of the particles in order to reduce the processing time for
chemical reaction in the following step.
Digestion: Ground bauxite is treated with NaOH solution at 150-160°C. The system
pressure is held at 0.5 MPa. The following reaction takes place and most of the hydrated
alumina goes into solution as sodium aluminate [80-83]:
A1(OH)3 (s) + NaOH (aq) • Na+ (aq) + A1(OH)"4 (aq) (2.1)
Filtration: The solid impurities such as Si(>29 TiOi, and Fe2O3 cannot dissolve in
NaOH solution. Therefore, they are separated by filtration.
Precipitation: After cooling, the filtered sodium alumina solution is seeded with
very fine gibbsite. At lower temperature, aluminum hydroxide forms as the stable phase.
Precipitation rate increases with decreasing temperature and pH. CO2 bubbling is used to
decrease pH levels.
Washing: Precipitates are filtered and then washed. This reduces the sodium content
of aluminum hydroxide.
Calcination: Aluminum hydroxide is then calcined at 1100 - 1200°C to convert the
hydroxide to the oxide according to the reaction given by Eq.2.2 [80-83].
During this transformation, alumina passes though different crystalline phases as
shown below:
A12O3.3H2O -^Al2O3.H2O —*y-Al2O3 —•Ô-AI2O3—• 6-Al2O3 —• a-Al2O3
Milling: The powder produced in the previous step is milled to give the desired
particle size. This product is called "calcined alumina" which has 99.5% purity, and its
major impurity is Na2O (max.0.5%). Typical composition of calcined alumina is shown in
Table 2-2.
Table 2-2: Composition of Calcined Alumina [80]
A12O3 SiO2 Fe2O3 Na2O Normal Na2O (wt%) 98.9-99.7 0.02-0.05 0.04-0.05 0.3-0.6 Low Na2O (wt%) 99.5-99.8 0.07-0.12 0.04-0.06 <0.13 Reactive (wt%) >99.5 0.04-0.08 0.01-0.02 0.08
The presence of Na2O in alumina can be unacceptable for some applications. Na+
ion is mobile in an electric field and causes degradation of electrical insulation. During high
temperature processing, a sodium beta-alumina (Na20.11Al203) phase can form which
leads to a reduction in density, strength, thermal shock resistance, and corrosion resistance
of the final product [80, 84].
Calcined alumina is basically used in the production of metallurgical grade alumina
and alumina chemicals. It was reported in the literature [79] that almost 93% of the calcined
chemicals, which consist of tabular alumina, cover the remaining 7% of the calcined
alumina production.
Variations of alumina types depend on the changes in different process parameter
from plant to plant, although they are produced in a similar fashion.
2.1.3 Tabular Alumina
The name "tabular" comes from its crystal shape which is in a flat tablet-like form
of corundum crystals with 50 to 500 ixm in size. Tabular aluminas are highly-fired,
fully-shrunk recrystallized CX-AI2O3. Structural and chemical properties of tabular aluminas are
evidently different from other dense, fine-crystalline, sintered aluminas and fused aluminas.
Tabular alumina was first developed by ALCOA in the late 1930's. The original process is
extensively modified for over 60 years in order to have optimum product quality, economy,
and consistency of production [87-90].
The production process of tabular alumina contains basic unit operations such as
CALCINED ALUMINA
1
BALL MILL (AI2O3 GRINDING) SEED BALL FORMER GREEN BALL FORMER DRUM MAGNET TABULAR BALL CRUSHING BALL DRYER SCREEN PACKING MACHINE1
CONVERTER (SINTERING)Figure 2-4: Tabular Alumina Production Flow Sheet [88]
Calcined alumina is used for tabular alumina production. Fine crystalline a-alumina
feed goes through sintering and densification. It is fed into a ball mill in which dry a
grinding process is performed until 100-325 mesh Bayer agglomerates are obtained.
Finely ground calcined alumina is also preferred because it can easily be shaped to
balls. Green balls are produced by sequentially wetting the balls' surfaces with a fine
water/binder spray. They need to have sufficient strength to avoid breakage while handling
and transporting to the dryer chamber. Organic binders (starch) or H3BO3 is sometimes
used for enhancing the green strength.
Dryer chamber which is positioned above the converter is used for sintering. By
are removed. Thermal shock fracture is an important problem of this process; therefore,
temperature should be carefully controlled. Fractured balls can impede the uniform gravity
free flow through dryer since they cause channelling and non-uniform drying which further
worsens the thermal shock episodes.
Sintering operation is performed using continuous Curtis converters with natural
gas-air mixture or butane at sintering temperatures of 1815 to 1925°C. A discharge table
controls the alumina ball flow in converter so that proper drying rates and full conversion to
tabular alumina can be obtained. Flow of theoretical gas/air mixture is balanced with the
alumina ball throughput. Boric acid (H3BO3) addition helps to reduce Na2Û content during
alumina calcination at a temperature of about 1400 °C. It removes soda by volatilization as
sodium borate compounds. In addition, Na2Û content and the porosity of alumina are
reduced using the synergetic reaction of magnesium salt and boron compound with
calcined alumina during sintering for 1 -25 hours within the temperature range of about
1600°tol900°C,
Hot sintered alumina balls are stored in cooling bins. After cooling, they go through
the crushing, de-ironing, and sizing steps. Gyradisc crushers are used. After crushing, two
magnetic drum separators remove the metallic iron from the crushed tabular alumina. The
non-magnetic hardened alloy crushers are not eligible because of inability to remove
metallic contamination by de-ironing. Graded tabular sizes are stored in the needle bins.
Over-screened tabular alumina is fed back to the Gyradisc crusher for further size
In Japan and Europe, environmental emission control laws prevent the use of boric
acid additions for soda reduction in the tabular alumina T-60 grades since 1970's.
Therefore, typical T-60 tabular alumina contains 0.25 to 0.30% Na2O. The soda level
directly depends on the soda level of calcined AI2O3 feedstock.
Boric acid is very effective to reduce the soda level in sintered aluminas. It is
reported by MacZura [45-46] that tabular alumina T-61 grade with <0.01% Na2Û is
produced from 0.4-0.5% Na2Û containing calcined alumina feedstock. However, excess
usage of boric acid causes channelling problems at the cooler portion of the shaft furnace
because of condensation of sodium boride compounds. This might significantly increase
the rejection rates.
In 1980's, ALCOA carried out an economic study on tabular alumina process, and it
was reported that, even when moderate additions of boric acid is used, the rejects are in
excessive amounts. Consequently, new tabular alumina grade T-64 which has a typical
soda content of 0.15 to 0.20% can be produced from intermediate soda-content alumina
feedstock without the use of boric acid.
Product quality of T-64 is enhanced by eliminating boron additions. This resulted in
a more consistent microstructure than that of T-61 grade obtained during converter firing.
Desired properties of tabular alumina which define its quality can be listed as:
• large 0C-AI2O3 crystalline structure
• high closed porosity
• low open porosity
Table 2-3: Comparison of Tabular Alumina Grades [88-89] Typical Properties (Converter discharge) A12O3 (wt%) SiO2 (wt%) Fe2O3 (wt%)total Fe2O3 (wt%)acid soluble Na2O (wt%) CaO(wt%) MgO(wt%) B2O3(wt%)
Bulk density, packed, lb/ft3
Converter Discharge(CD) Granular, -14 mesh Powder, -325 mesh
Specific gravity, bulk, g/cm3
Apparent porosity(%) Water Absorption (%) Specifications for shipment Na2O (max) (wt%) Apparent porosity (CD mx) (%) Water Absorption (CD mx) (%) ALCOA T-64 99.7+ 0.04 0.06 0.01 0.16 0.04 O.001 O.001 128 138 143 3.50-3.65 3 0.8 0.22 7 2 Published Data ALCOA T-60 99.5 0.04 -0.02 0.30 0.05 -3.6 4.0 1.5 0.40 8.0 4.0 ALCOA T-61 99.5+ 0.06 0.06 -0.10 -125 135 140 3.40-3.60 5 1.5 0.20 10 4 KAISER T-1061 99.8 0.06 0.03 -0.03 -3.40-3.56 5 2 0.20 10 4
If the tabular alumina is over or under fired, excessive open porosity and high water
absorption rate can evidently be observed. In this case, also the grain strength values are not
consistent. The open porosity problem of underfired tabular aluminas can be solved by
small additions of MgO, which lowers the sintering temperature and improves the
densification. Although MgO enhances the densification and lowers the porosity of
alumina, it also reduces the grain size to <25 pm. The mechanical studies showed that
dense and finely grained sintered aluminas have poor thermal shock resistance compared to
that of the alumina with large grain size (50 to >400 \xm) and lower density crystalline
The physical and chemical properties of tabular alumina listed below indicate the
reason for their utilisation as a refractory line raw material [90].
• High chemical purity ( >99.5% A12O3 )
• Extreme hardness of the ultimate crystals
• Low apparent porosity ( AP~3%, H2O absorption~0.8%, 3.97 true density, 3.5 to
3.65 gr/cm3 particle density)
• High melting point (~ 2050°C)
• Chemical inertness (no reaction with most alkalies, mineral acids except
hydrofluoric and phosphoric acid)
• Relatively good thermal conductivity for ceramic materials
• Relatively good thermal conductivity
• High electrical resistivity
• Good volume stability ( they are fully shrunk )
• Highly reactive surface for ceramic, chemical, and cement bonding
• Absence of microcracks and gross internal porosity
• High individual grain strength
Tabular alumina is ideal base material for the 90-100% AI2O3 class of high alumina
brick and monolithic lining. Some of the major applications are [90] :
• Iron and steel industry: Injection lances, ladle lining, slide gate valves and nozzles,
shrouds, submerged nozzle, impact pads, snorkels, tap hole mixes, torpedo lining,
• Petrochemistry: Catalyst transfer lines in FCCU (Fluid Catalytic Cracking Unit)
regenerator vessels, slide valves.
• Waste incineration furnaces
• Kiln furnaces
• Molten metal filters
2.2 Inclusions in Molten Aluminum Alloys
Inclusions in aluminum might have an adverse effect on surface appearance and
severe effects on mechanical properties. They might also influence machining and forming
properties of the metal.
Inclusions generally fall into two classes, exogenous and indogenous. Exogenous
inclusions are imported to the molten metal stream from external sources, such as occluded
particles on and within primary and secondary ingot, major alloying elements and master
alloys as well as containment refractories. Indogenous inclusions form as a result of
chemical reactions within the metal handling system. These inclusions are formed by
oxidation and formation of aluminum carbide and halide salts.
In Table 2-4, the most common inclusion types found in unprocessed Al-Mg
alloys are listed. The observed inclusion sizes in unprocessed aluminum melts change from
MgO dispersoids of a few microns to AI2O3 films and clusters that extend to several
millimeters. Most products oblige an inclusion size of less than 50 ^m at concentrations in
Table 2-4: Most Common Inclusions in Al-Mg Alloy System [1-6, 22] Inclusions Aluminum oxide Magnesium oxide Spinel Aluminum carbide Complex oxides ( N a , K , C a , A l , O ) Titanium di-boride Form
Films or group of films
Polygonal particles Polygonal particles Films consisting of particles Truncated prymidical shaped particles Thick films Lumps of particles Rectangular or Hexagonal discs Thick films Clusters of hexagonal or rectangular discs Chemical formula A12O3 MgO MgAl2O4 AI4C3 TiB2 Density (g/cm3) 3.98 3.58 3.60 2.36 4.5 Size range* t= 0.1-5 jam d= 10-1000 [mi d= 0.2-30 jam d= 0.2-1 t= l-8|um d= 1-100 pin d= 0.1-5 Jim d= 1 -6 \xm t=10-1000Mm d=0.5-25^im t<l Jim t~10|nm d= 50-500|uim d=l-50 urn
"t" is thickness and "d" is the diameter.
The studies found in the literature [6-8, 11-14] on the deep bed filtration of
aluminum alloys and mechanisms of inclusion entrapment in the filter media underline the
effectiveness of deep bed filters in capturing small inclusions (<20(im) due to high media
surface area. In these studies, inclusion capture is considered to be the result of two
sequential events:
1. Transport of an inclusion to capture sites on the filter media surface by
![Figure 1-2: A Schematic View of a Deep Bed Filter Process Before Casting [11, 12]](https://thumb-eu.123doks.com/thumbv2/123doknet/7678029.241567/26.918.217.666.303.573/figure-schematic-view-deep-bed-filter-process-casting.webp)
![Figure 2-7: Effect of Initial Mg Concentration on the Rate of Mg Concentration Change During Mixing [43]](https://thumb-eu.123doks.com/thumbv2/123doknet/7678029.241567/57.918.235.757.176.438/figure-effect-initial-concentration-rate-concentration-change-mixing.webp)
![Figure 2-12: EDX Analysis Results for Needle-like Structure of the Reaction Product Formed at Refractory/Aluminum Alloy Interface [72]](https://thumb-eu.123doks.com/thumbv2/123doknet/7678029.241567/66.918.180.778.687.908/analysis-results-structure-reaction-product-refractory-aluminum-interface.webp)
![Figure 2-16: Loss of Mg Resulting from Spinel Formation for Alumina in Super Purity Aluminum-1 wt% Mg [33]](https://thumb-eu.123doks.com/thumbv2/123doknet/7678029.241567/72.918.299.715.605.904/figure-resulting-spinel-formation-alumina-super-purity-aluminum.webp)
![Figure 2-17: Cross-section of Refractory Samples after Different Times of Corrosion [65]](https://thumb-eu.123doks.com/thumbv2/123doknet/7678029.241567/74.918.268.701.651.917/figure-cross-section-refractory-samples-different-times-corrosion.webp)