The Finnish Society of Forest Science · The Finnish Forest Research Institute
Fire Regime and Old-Growth Boreal
Forests in Central Quebec, Canada:
An Ecosystem Management Perspective
Annie Claude Bélisle, Sylvie Gauthier, Dominic Cyr, Yves Bergeron and Hubert Morin
Bélisle, A.C., Gauthier, S., Cyr, D., Bergeron, Y. & Morin, H. 2011. Fire regime and old-growth
boreal forests in central Quebec, Canada: an ecosystem management perspective. Silva Fen-nica 45(5): 889–908.
Boreal forest management in Eastern Canada has caused depletion and fragmentation of old-growth ecosystems, with growing impacts on the associated biodiversity. To mitigate impacts of management while maintaining timber supplies, ecosystem management aims to narrow the gap between natural and managed landscapes. Our study describes the fire history and associated natural old-growth forest proportions and distribution of a 5000 km2 area located in
the black spruce-feather moss forest of central Quebec. We reconstructed a stand-origin map using archival data, aerial photos and dendrochronology. According to survival analysis (Cox hazard model), the mean fire cycle length was 247 years for the 1734–2009 period. Age-class distribution modelling showed that old-growth forests were present on an average of 55% of the landscape over the last 275 years. The mean fire size was 10 113 ha, while most of the burned area was attributable to fires larger than 10 000 ha, leading to old-growth agglomera-tions of hundreds of square kilometres. In regards to our findings, we propose ecosystem management targets and strategies to preserve forest diversity and resilience.
Keywords black spruce-feather moss, fire history, ecosystem management,
dendrochronol-ogy
Addresses Bélisle, Centre for Forest Research, Université du Québec à Montréal, Montréal,
Québec, Canada; Gauthier, Laurentian Forestry Centre, Canadian Forest Service, Natural Resources Canada, Sainte-Foy, Québec, Canada; Cyr, Institut Québécois d’Aménagement de la Forêt Feuillue, Université du Québec en Outaouais, Ripon, Québec, Canada; Bergeron, Centre for Forest Research, Université du Québec à Montréal, Montréal, Québec, Canada & NSERC-UQAT-UQAM Industrial Chair in Sustainable Forest Management, Université du Québec en Abitibi-Témiscamingue, Rouyn-Noranda, Québec, Canada; Morin, Département des Sciences Fondamentales, Université du Québec à Chicoutimi, Chicoutimi, Québec, Canada
E-mail annieclaude_b@hotmail.com
Received 18 April 2011 Revised 11 November 2011 Accepted 11 November 2011 Available at http://www.metla.fi/silvafennica/full/sf45/sf455889.pdf
1 Introduction
Boreal landscapes are shaped by disturbance
regimes (Van Wagner 1978, Johnson and Gutsell
1994, Wu and Loucks 1995, Angelstam and
Kuu-luvainen 2004). In North America, stand-initiating
fires create a mosaic of forest patches which differ
in their age, internal structure, and composition
(Dix and Swan 1971, Rowe and Scotter 1973,
Johnson 1992). Young forests form a dense and
uniform canopy composed of shade-intolerant or
semi-tolerant species that establish soon after a
fire. With time and under the action of secondary
disturbances, individuals in the canopy are replaced
and the forest passes from one undergoing changes
via successional processes, to one influenced by
gap dynamics (Bergeron 2000, Chen and
Popadi-ouk 2002, Angelstam and Kuuluvainen 2004). As
proposed by Kneeshaw and Gauthier (2003), once
die-back of the post-fire cohort is completed and
the establishment of a new cohort of canopy trees
has been initiated, these forests are then considered
to be in the first stages of old-growth. Old-growth
stands share features typically associated with gap
dynamics (Pham et al. 2004, St-Denis et al. 2010),
including uneven-aged structure (Kuuluvainen et
al. 2002, McCarthy and Weetman 2006), horizontal
and vertical heterogeneity (Kneeshaw and Bergeron
1998, Harper et al. 2002, Lecomte and Bergeron
2005), and the substantial presence and diversity of
deadwood (Siitonen 2001, Ekbom et al. 2006).
In addition to natural disturbances, forest
man-agement is an important component of forest
dynamics, with consequences for landscape
complexity (Östlund et al. 1997, Axelsson et al.
2002, Kuuluvainen 2009), ecological processes
(Siitonen 2001, Kuuluvainen and Laiho 2004),
and diversity (Berg et al. 1994, Rassi et al. 2001).
In Eastern Canada, extensive management of the
boreal forest started circa 1930, and intensified
during the 1970’s (Boucher et al. 2009).
Even-aged management (clear-cutting) then became a
major process, together with stand-initiating fires,
by which forest succession was reinitiated. Hence,
the boreal forest is now undergoing a period of
transition, from a state where the forest was mainly
primeval a few decades before, to a forest managed
for timber production (Brassard et al. 2009).
Ecosystem-based management, which is now
embedded in the Forest Act (Quebec 2011), is
a strategy that has been developed to maintain
healthy and resilient ecosystems by focusing on
narrowing the differences between natural and
managed landscapes (Grumbine 1994, Landres et
al. 1999, Gauthier et al. 2009a). The approach is
based on the coarse filter principle, the rationale
being that conservation of most species is assured
by preserving habitat diversity (Franklin 1993,
Hunter 1999, Bergeron et al. 2002). It requires
a thorough understanding of ecosystem key
functions and processes, including disturbance
regimes (Christensen et al. 1996). Research may
thus provide scientific knowledge on natural
land-scapes to underline the differences with the
man-aged landscapes (Niemelä 1999, Lindenmayer et
al. 2008, Gauthier et al. 2009b).
To uncover pre-industrial forest age-structure,
fire regimes of the last 300 years have been
stud-ied in several regions of Eastern Canada (Grenier
et al. 2005, Bergeron et al. 2006, Bouchard et al.
2008, Senici et al. 2010). It was shown that fire
frequency is spatially variable, with historical
burn rates varying form 0.781 (Waswanipi,
West-ern Quebec), to < 0.002 (North Shore of the St.
Lawrence River) (Bouchard et al. 2008, Bergeron
et al. 2006). Moreover, compared to continental
Canada where high fire frequency has created
a matrix of young forests within which islands
of older forests are naturally isolated (Johnson
et al. 1998), the lower fire frequency of Eastern
Canada has allowed large expanses of forests to
grow for more than 150 years (Bouchard et al.
2008). Considering old-growth forests as
con-tributors to habitat diversity (Imbeau et al. 1999,
Komonen et al. 2000, Drapeau et al. 2003,
Cour-tois et al. 2004, St-Laurent et al. 2009),
rejuve-nation of the landscape by clear-cutting and the
associated scarcity of old-growth attributes are
major alterations of the boreal forests of Eastern
Canada (Didion et al. 2007, Cyr et al. 2009,
Shorohova et al. 2011).
In a context where ecosystem management is
being implemented rapidly across the forests of
Eastern Canada, we propose a way to bridge
the gap between the scientific data that have
been gathered regarding the fire regime and the
establishment of simple and realistic management
targets. More precisely, our objectives are 1) to
estimate fire frequency over the last 300 years,
together with the associated age-class distribution
of central Quebec boreal forest, where knowledge
of the fire history is incomplete, 2) to describe the
fire size distribution for the region, and 3) to
char-acterise the spatial configuration of successional
stages in the landscape, especially for old-growth
forests. Management targets for old-growth based
on historical fire regime parameters will then be
proposed.
2 Methods
2.1 Study Area
The 540 300 ha study area (from 71°15´ to
72°45´ W, 49°36´ to 50°59´ N) is located in the
continuous boreal forest, on the Boreal Shield
geological formation (Fig. 1). Specifically, it is
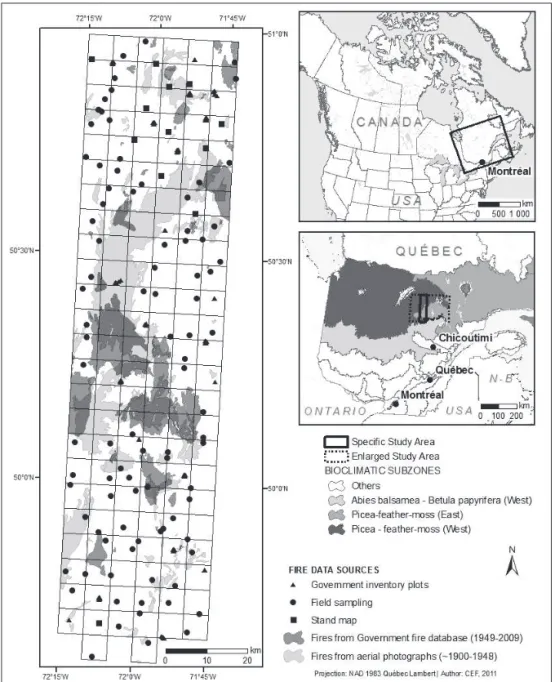
Fig. 1. Sampling design and fire map created from Government databases (1949–2009) and
photointerpreta-tion (~1900–1948). For each 3700 ha cell, a fire year (real or minimum) was attributed using different sources (points).
at the border of the western and eastern black
spruce (Picea mariana (Mill.) BSP) bioclimatic
subdomains (Saucier et al. 1998). The topography
has low relief, and is composed mainly of rounded
hills with surficial deposits that are dominated by
mesic glacial tills. Mean elevation ranges from
339 m to 535 m. Temperature averages between 6
to 10 °C and 21 to 25 °C in July and between –29
to –25 °C and –14 to –10 °C in January (Natural
Resources Canada 2011). Average annual
pre-cipitation is 900 mm to 1200 mm, with 30–35
% falling as snow (Robitaille and Saucier 1998).
Knowledge of the fire history is incomplete for the
study area, as it is located on the border between
two zones with contrasting stand-initiating canopy
fire frequencies; higher frequencies are typically
west of the study area (MRNQ 2000, Cyr et al.
2007, Le Goff et al. 2007).
Human impact on the landscape has been minimal
prior to the 1970s. Nomadic native communities
have been present in the region for the last 3000
years at a very low density (0.005 individual/
km
2) (Helm 1981, Laliberté 1987, Moreau and
Langevin 1991). Moreover, nothing in the
ethno-graphic literature mentions deliberate forest fire
ignition in the culture of native Innu populations
from northern Quebec (Moreau, Jean-François,
pers. comm.). The closest villages to our study
area, which are located more than 70 km to the
south, were settled between 1870 and 1930. In the
1950s, initial timber harvests in the region were
limited by technology and access, being restricted
to the edges of a few lakes and rivers. Their effects
regarding the occurrence of large fires are generally
admitted as being very low until the beginning of
mechanised harvesting in the 1970s (Lefort et al.
2003). The study area, which is located on public
lands, has been dedicated to timber production
since 1986 (Coulombe 2004). We have therefore
considered the fire regime of our study area as
near-natural (Haila et al. 1997) before the
begin-ning of mechanised logging.
2.2 Experimental Design
Several strategies have been developed to assess
fire history in different ecological and scientific
contexts. Charcoal collection from lake sediments
(e.g. Carcaillet and Richard 2000, Carcaillet et al.
2001, Carcaillet et al. 2007, Ali et al. 2009), and
the dendrochronological analysis of trees bearing
multiple fire scars (e.g., Niklasson and
Draken-berg 2001, Drobyshev et al. 2008, Niklasson et al.
2010) have allowed fire intervals to be recorded at
a single-point in space. In contrast, stand-origin
maps (Niklasson and Granström 2000, Niklasson
and Drakenberg 2001, Grenier et al. 2005,
Walle-nius et al. 2005, Bergeron et al. 2006, Bouchard et
al. 2008, Senici et al. 2010) cover a shorter
time-scale, but they provide spatially explicit data and
are not limited by the availability of multiple fire
scars or suitable lakes for sediment collection.
The stand-origin map methodology was first
described by Heinselman (1973) and improved
by Johnson and Gutsell (1994). It is based on
the partitioning of a landscape into a number of
spatial units, or points, for which a time-since-fire,
real or minimum, is attributed. When fire severity
and forest type allow the presence of fire-resistant
species, such as Pinus sylvestris (L.) in
Fenno-scandia and Pinus resinosa (Ait.) in northeastern
America, time-since-fire can be precisely derived
from fire scars. In the case of our study area, we
were limited by a high severity fire regime and the
absence of resistant species. We thus focussed our
time-since-fire reconstruction on the composition
and age-structure of the forest stands.
To conduct systematic random sampling
(John-son and Gutsell 1994), the study area was divided
into a grid of 146 square cells, each of 3700 ha
(Fig. 1). All were represented by a randomly
chosen stand. The size and location of the study
area were chosen to represent adequately the
spe-cific fire regime of the landscape, considering the
specific fire size distribution (Johnson and Gutsell
1994) and to minimise statistical uncertainties
(Cyr 2011). A time-since-fire had to be attributed
to each cell. Many data sources were used to best
deal with cells’ specific constraints, involving fire
databases and maps, archived aerial photos and
field sampling.
1) For the recent fire history (1949–2009), we used the Quebec Ministry of Natural Resources and Wildlife (MRNFQ) database (Direction de
l’environnement et de la protection des forêts), which holds fire records since 1920. Fires were precisely mapped with aerial inventories since the 1970s. Accuracy of previous fire mapping is less clear, especially for small fires, since these areas
were derived from observation tower networks (Blanchet 2003). We limited our use to data from 1949 to 2009, where the smallest fire size that had been recorded was 2 ha. However, our method was designed to ensure that any significantly sized fire that was missed in the fire records would be detected by other data sources, such as field sampling.
We overlaid the 1949–2009 fire map and the grid in a GIS (ESRI ArcGIS 9.3). All cells that were covered at least 50% by one or several fires were dated according to the year of the fire event. If more than one fire occurred, a random point was generated in the burned area of the 2009 fire-map. The cell was dated according to the fire year at the random point location.
2) To map fires that occurred before 1949, we used the photo-interpretation technique described by Lefort et al. (2003). Aerial photographs (1948) covering the entire study area were available from the National Air Photo Library of Canada (aver-age scale is 1:35 000). Fires were recognised by their generally elliptical shape, their jagged bor-ders, and by the presence of visible snags. We hand-mapped fires on 1:250 000 topographical maps and digitised them into ArcGIS 9.3. Again, when more than 50% of an undated cell of the grid was covered by a fire, the year of the fire event was attributed, this time using field sampling and dendrochronology (see information below). Overall, fire records (fire database and archived photographs) allowed us to attribute a fire year to 29 cells (about 20% of the grid). The gap between 1948 (aerial photographs) and 1970 (aerial fire mapping) is prone to fire delineation mistakes. Nonetheless, field sampling was performed in areas where no fire was recorded and validated that no large fire had been missed.
3) Cells where more than 50% of the surface was not occupied by fires recorded from the two previous sources (i.e. last fire occurred before ~1900; 117 cells, 80%) were attributed a date based on the age of the dominant tree-cohort. For each of these cells, a random point which had to be visited on the field was generated with Arc GIS 9.3 (Hawth’s
Tools). To minimise bias related to fire breaks, stands located at a distance < 100 m from a water body, road, or bog were avoided. We performed field sampling to collect tree-rings data for all accessible cells (82 cells, 56%).
Thirty-five cells were inaccessible by road or
had been totally harvested. We attributed a
time-since-fire to these cells using the Government of
Quebec’s field inventory plots (1970–2000) when
available. These 400 m
2plots, which are organised
in transects of 2 to 7 plots, were distributed over a
large part of the study area. In each plot, the age
of three dominant trees was derived from dating
cores (taken at 1.3 m above the ground). For our
purposes, the closest transect (inside the cell) from
the random point was considered. Twenty-two cells
(15%) were dated this way. Some uncertainties
are linked to the choice of which trees were to
be sampled, based on dominance status instead
of apparent age. This may not be a problem for
post-fire cohort stands (< 150-years-old), where
all trees have approximately the same age.
How-ever, for older stands, this could have led to an
under-estimation of the minimum time-since-fire
compared with estimates from the field sampling
we performed ourselves. A second problem with
Government inventory plots is that the trees were
not cored at ground level. We estimated this error
to be less than 10 years, comparing data from
inventory plots to data from our field sampling
for a single fire polygon.
Finally, thirteen cells (9%) were impossible
to reach in the field and had no inventory plots
that had been sampled by the Government of
Quebec.
2.3 Determination of Time Since Fire
2.3.1 Field Sampling
For all cells that had to be visited in the field, we
sampled the forest stand that was both closest to
the random point and accessible from the road
(100 m). Cross-sections at the base of 10
domi-nant and co-domidomi-nant trees were collected; snags
and logs, when the heartwood was still present,
were also sampled (Johnson and Gutsell 1994).
The trees from which we collected data were
chosen according to the following criteria:
1) Trees bearing fire scars were selected first. They were identified by their triangular shape originat-ing from the ground and by the presence of burned bark or wood (Molnar and McMinn 1953, Johnson and Gutsell 1994).
2) Pinus banksiana Lamb. was prioritised as well because, in a mesic context, its recruitment is limited to post-fire succession, with the majority of individuals (85%) establishing less than 20 years after a severe fire (Gauthier et al. 1993). 3) When Pinus banksiana was absent, other potential
pioneer species were sampled in the following order of priority: 1. Populus tremuloides Michx., 2. Betula papyrifera Marsh., and 3. Picea mariana (cf. Gauthier et al. 2000, Lecomte and Bergeron 2005).
4) In the absence of post-fire potential species, Abies
balsamea (L.) Mill., and Picea glauca (Moench) Voss were sampled.
2.3.2 Dendrochronology
To estimate the age of collected trees,
cross-sec-tions were dried and sanded, and tree-rings were
counted under a dissection microscope. Dead and
difficult trees were cross-dated using
pointer-years when evident (Yamaguchi 1991) and using
chronologies when equivocal. Cross-dating
accu-racy was then validated with COFECHA
(Gris-sino-Mayer 2001). To build regional chronologies
for cross-dating, two radii (when possible) were
measured on at least 15 trees. For evergreen
species, cross-sections were scanned and
tree-rings were measured using the software Cybis
CooRecorder 7.2
(Cybis Elektronik & Data AB,
Saltsjöbaden, Sweden). For hardwood species,
with a less defined contrast between tree-rings,
tree-rings were measured using the Velmex
meas-uring system (Velmex Incorporated, Bloomfield,
New York, USA). Chronologies were built in the
software R (R Development Core Team 2010,
package dplr
). Overall, 897 tree cross-sections
were collected and analysed (see Table 1 for the
species counts).
2.3.3 From Tree Ages to Time-Since-Fire
Fire years (real or minimum) were attributed
according to the composition and age-structure
of the stands. If some P. banksiana individuals
or fire scars were present (n = 16), the year of the
fire, which was validated with the age-structure
of the dominant tree cohort, was attributed. In the
absence of this direct fire evidence, we turned to
stand composition and age-structure to assign
a time-since-fire. If the stand was dominated
with potential post-fire species (B. papyrifera, P.
tremuloides, P. mariana
) and the age-structure
was even-aged (maximum variation of 20 years),
the date of origin of the oldest tree of the cohort
was defined as the fire year. If the sampled stand
had an uneven-aged structure, the origin year of
the oldest tree was considered as the minimum fire
year (or censored information, as it is referred to
using survival analysis terminology) (Hosmer et
al. 2008). The time-since-fire was then defined as
the time elapsed between 2009 and the fire year.
The same principle was followed to date the
cells with the Government inventory plots (266
trees, Table 1). According to the age-structure
and composition of all sampled trees along a
transect, we first determined if the dated trees
originated from the post-fire cohort and, thus, if
the time-since-fire should be considered as real or
censored. If the approximated year of the last fire
could not be found, we then systematically dated
and censored the cell according to the age of the
oldest tree in the second plot along the transect.
A minimum time-since-fire of 109 years (2009–
1900) was attributed to the thirteen cells where no
information was available, according to the
time-scale covered by aerial photos (~1900 to 1948).
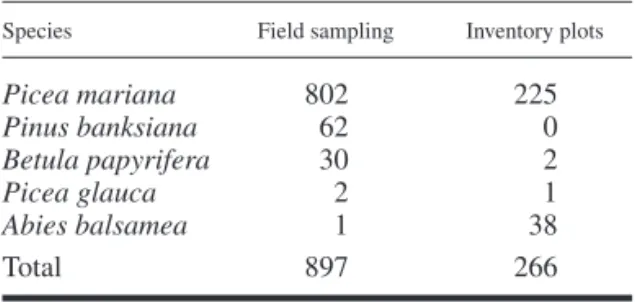
Table 1. Count of individual trees collected during the
field sampling campaign and analysed with dendro-chronology, and counts of trees analysed from the Government inventory plots databases, selected to complete the determination of time-since-fire for all the grid cells.
Species Field sampling Inventory plots
Picea mariana 802 225 Pinus banksiana 62 0 Betula papyrifera 30 2 Picea glauca 2 1 Abies balsamea 1 38 Total 897 266
2.4 Fire Frequency Estimation
Fire frequency can be expressed by the fire cycle
concept, which is defined as the time that is
required to burn an area equal to that of the
study area (Johnson and Gutsell 1994, Li 2002).
It is mathematically defined as the inverse of
the mean annual burn rate and fits the mean age
of the forest (Johnson and Gutsell 1994). Fire
cycle is not a perfect mathematical concept to
estimate fire frequency, especially for point-based
designs, as burn rates are generally not constant
in time and space and because fire acts more like
a random than a constant process (Reed 2006).
However, our area-based design is suitable for
burn rate calculations, and consequently, for fire
cycle estimation (Li 2002).
Moreover, the fire cycle concept can be
com-pared with that of stand rotation and allows a
simple bridge to be built between natural and
anthropogenic disturbance regimes. In a
theo-retical landscape where the fire cycle equals 100
years, 1% of the landscape burns every year.
Assuming that the fire hazard is independent
of stand-age, after 100 years, a portion of the
landscape will have burned once, a portion will
have burned more than once, and a portion will
have not burned at all. The process leading to
old-growth depletion in managed landscapes can
be understood by comparing the concepts of fire
cycle and stand rotation. Again, in a theoretical
managed landscape with a stand rotation of 100
years, 1% of the landscape would be harvested
every year. Nevertheless, after 100 years, the
whole landscape will have been harvested once
and only once. Thus, for two stand-initiating
disturbance regimes with a same annual rate, i.e.,
fires and harvests, the first will release space for
some forests to grow for a time longer than the fire
cycle, while the second will not allow forests to
grow for longer than the stand-rotation time.
To derive the fire cycle directly from the burned
area, we would need a complete fire record. In
the present case, we were unable to date the last
fire for 44% of the area. Thus, we used survival
analysis, a statistical technique that has been
adapted to deal with censored data such as the
minimum time-since-fire. Cox
proportional-haz-ards is a semiparametric survival model that does
not assume survival to fit a parametric distribution
(negative exponential or Weibull) (Cox 1972,
Hosmer et al. 2008). We applied the Cox model
using R software (Survival package, R
Develop-ment Core Team, 2010)
and the function coxph.
The baseline hazard function was then extracted
using basehaz. The fire cycle was calculated by
dividing the time-since-fire associated with the
maximum cumulated hazard by this maximum
hazard (Therneau 2011). A 95% confidence
inter-val on the fire cycle was calculated by
bootstrap-ping (1000 resamplings with replacement from
the original dataset, n = 146).
To estimate the influence of human activities
on the fire frequency, we compared the fire cycle
prior to 1948, a period for which no sign of human
activity was noticeable on the aerial photos, and
the recent fire cycle (1949–2009), which was
calculated by inverting the mean annual burn rate
for this period.
2.5 Fire Size
The fire size analysis required more fires than
were available in the study area. Hence, we used
an enlarged study area (Fig. 1) of 28 931 km
2,
including 176 fires (1949–2009) that were
selected to maintain the proportions of the
East-ern and WestEast-ern Picea mariana-feather moss
bioclimatic sub-domains. We first analysed the
size distribution and frequencies of fires that were
considered as having their ignition point inside
the boundaries of the enlarged study area. For the
burned area analysis, all fires that intersected the
enlarged study area were considered, although
only the area contained inside the limit of our
enlarged study area was integrated.
We calculated the mean fire size and estimated the
95% confidence interval with bootstrapping (1000
resamplings with replacement from the original
dataset, n = 176) on the log-transformed fire size
distribution. We then back-transformed the mean
and confidence intervals to their original scale.
2.6 Age-Class Distribution and Management
Targets
The age-structure of a forest landscape can be
mathematically derived from the fire cycle (Van
Wagner 1978). In a theoretical landscape where
fire occurs randomly and its probability is
inde-pendent of stand age, the time-since-fire
distribu-tion follows a negative exponential distribudistribu-tion
(see Eq. 1) (Johnson and Wagner 1984). This
model which has the advantage of integrating
the variability of the last 300 years, was used to
calculate the historical mean age-class
distribu-tion for our study area.
A(T) = e–(t/b) (1)
where A(T) is the proportion of the landscape that
escaped fire during a time T with a fire cycle b.
Fire hazard may be influenced by local
fac-tors (Mansuy et al. 2010), although these are
poorly documented and only partly understood.
We judged appropriate to make no assumptions
regarding their effects and consider that model
validity is not compromised. In addition, we know
that large scale factors, such as weather, influence
fire hazard and behaviour to a greater degree than
the fuel when the landscape is dominated by
conifers (Bessie and Johnson 1995).
To make some concrete and simple
manage-ment targets, four age-classes were defined
according to the succession models described
for the neighboring regions of the black
spruce-feather moss forest. Forests from 0–30 years
after a fire were considered to be in the
regen-eration phase, 31–80 years post-fire were
con-sidered as young, 81–150 as mature (Harper
et al. 2002), and > 150 as old-growth (Harper
et al. 2003, Lecomte and Bergeron 2005). The
mean proportions of each successional stage
in the landscape were calculated by running
Eq. 1 with the corresponding time intervals.
The confidence intervals on the successional
stage proportions were calculated by running
Eq. 1 with the limits of the fire cycle 95%
con-fidence interval.
3 Results
Between 1949 and 2009, 12.5% of the landscape
was encompassed by stand-replacing fires.
More-over, for 20.7% of the area, fire boundaries could
be drawn from the aerial photographs of 1948,
where the earliest fire that could be mapped was
dated to 1892, as confirmed by our field sampling.
Overall, 27.6% of our study area burned at least
once between ~1890 and 2009.
Fires from ~1900 to 2009 were mapped and
dated either directly from the archives (1949–
2009) or with field sampling. Regarding the period
prior to 1949, the fire perimeter data come from
our interpretation of aerial photos. The accuracy
of delineating fire boundaries decreased with
increasing time-since-fire; some fires may have
been missed in the initial fire map, especially the
old and small ones. However, these earlier fires
were detected by the systematic field sampling
design. Overall, we are confident that all fires of a
significant size for our purposes (i.e. > 2 ha) were
recorded from ~1890 to 2009.
Fire and tree-ring data were analysed for each
of the 146 cells (3700 ha) of the grid and a
time-since-fire, real or minimum, was assigned. For
82 cells (56%), we were able to assign a
time-since-fire with an accuracy of about 10 years.
However, for the 64 other cells (43%), only a
minimum-time-since-fire (censored) was assigned
because there was no clear sign of a post-fire
cohort, (n = 36) or because of the impossibility of
reaching the site in the field (n = 28).
Fig. 2 presents the stand-origin year
distribu-tion in the 2009 landscape (without considering
harvests). We observed that a few fire-decades
(1820, 1860, 1920 and 2000) strongly influenced
the age-class abundances over the study area
(30% of the grid cells). Considering the censored
data, for which we were unable to find sufficient
evidence to determine a time-since-fire, we noted
that their distribution exhibited two peaks, i.e., the
decades 1900 and 1750. We explained this
pat-tern respectively, by the minimum age available
according to aerial photos, which led to many
cells being censored in 1900, and by the apparent
longevity of black spruce (~250 years).
By grouping time-since-fire into the successional
stages presented in the methodology, we can draw a
portrait of the 2009 landscape age structure
(exclud-ing the effect of harvest(exclud-ing). Roughly, forests in
regeneration (0–30 yr) represented 10% of the
landscape, while young forests (31–80 yr) were
less than 1%. Including stands for which only a
minimum age is known, mature forests (81–150 yr)
accounted for a maximum of 38% of the landscape,
while over-mature forests (> 150 yr) represented
at least 51% of the landscape.
Survival analysis (Cox regression model) led to
the estimation of a fire cycle of 247 years for the
period from 1734 to 2009. The 95% confidence
interval about this mean ranged from 187 to 309
years. Fig. 2 presents the Cox fire hazard
varia-tions over time. As noted in the age-class
distri-bution, fire hazard peaked in the decades 2000,
1920, 1860 and 1820, and was low between 1930
and 2000. Because the effect of settlement on fire
frequency remains ambiguous, we calculated the
fire cycle before and after settlement (Table 2).
The fire cycle after settlement (375 yrs) was
sig-nificantly longer than before settlement (209 yrs),
according to confidence intervals calculated for
the pre-settlement fire cycle.
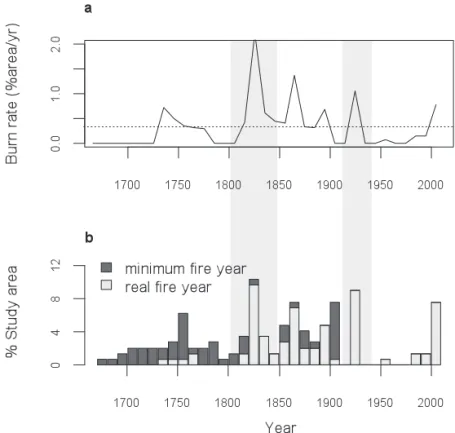
Fig. 2. a) Fire hazard variation from 1734 to 2009 grouped into 10 year classes, estimated by the
Cox regression model. The dotted line represents the mean burned area per year (0.4%), or the inverse of the fire cycle (247 yr). Peaks over this line indicate high fire frequency decades while troughs indicate low fire frequency decades. b) For the distribution of stand initiation (or fire) year, real or minimum, each cell of the grid presented in Fig. 1 accounts for one unit of the landscape (n = 146). The shaded rectangles were identified by Girardin et al. (2006) as periods where the occurrence of years with fire-prone weather patterns was high.
Table 2. Fire cycles of the entire period covered (1734–
2009), the pre-management period (1734–1948), and the management period (1949–2009). Fire cycles were calculated with the Cox regression model when involving censored data and using the inverse of the burn rate when complete fire records were available. The 95% confidence inter-vals were then calculated by bootstrapping. Fire cycle for 1949–2009 was derived from the effective burned area and, hence, does not have a confidence interval.
Period 2.5% Fire cycle 97.5%
1734–2009 187 247 309 1734–1948 157 209 273 1949–2009 - 375
-The fire size analysis for the original study area
showed that large fires were responsible for most
of the burned area. From all fires mapped ~1900
to 2009, those that were more than 3800 ha in
area, which roughly fits the cell size of the grid
(3700 ha), were responsible for 77% of the burned
area (8 fire years: ~1871, ~1924, ~1927, ~1948,
1986, 1991, 2005, and 2007). The maximum fire
size was 75 231 ha (~1924) and was responsible
for 42% of the total burned area.
Fig. 3 depicts fire size frequency and
distribu-tion, and associated burned areas for the enlarged
study area. Overall, mean fire size was estimated
at 10 113 ha, with a 95% confidence interval
ranging from 5796 ha to 17 530 ha. The fire
size distribution followed a negative exponential
shape (Fig. 3b). This meant that the number of
fires decreased with size (except for small fires)
on a log-scale (Fig. 3a). Otherwise, regarding
the burned area on Figs. 3c and 3d, the relation
is inverted, where large fires (> 10 000 ha), even
if infrequent, were responsible for 74.7% of the
burned area.
Fig. 4 illustrates the spatial distribution of the
stand-origin years and associated successional
stages in 2009. Regenerating, young, mature, and
old-growth forests are grouped in large tracts (> 2
cells of 3700 ha), forming vast areas of the same
Fig. 3. Fire size distribution (> 2 ha), from fire data recorded by the Government of Quebec between
1949 and 2009. For the a) absolute and b) cumulative relative frequencies, only fires for which the ignition point was located inside the enlarged study area were considered (n = 161). For the c) absolute and d) cumulative relative burned areas, the size of all fires that intersect the enlarged study area was considered, but the associated burned area was limited to the boundaries of the enlarged study area (n = 176). For b) and d), the mean fire size (10,113 ha) is represented by the vertical lines and the 95% confidence intervals by the shaded areas.
successional stage. Moreover, censored data, for
which we could solely attribute a minimum
time-since-fire, seem to be agglomerated within the
landscape.
The mean proportions of successional stages
in the landscape between 1734 and 2009 are
presented in Table 3. According to the negative
exponential model, old-growth forests (> 150 after
a fire) represented the most important group (45%
to 61% of the landscape). We noted that only 1%
of young forests were observed in the 2009
rep-resentation of the un-managed landscape, which
is outside of the range defined by the confidence
interval of our model. We attribute this gap to low
fire activity observed between 1930 and 2000 and
to the age-class lower limit (80 yr), which fits with
the transition between high and low fire activity
periods (~1930).
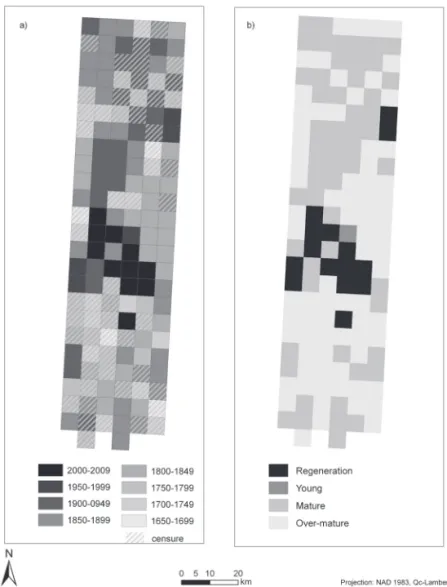
Fig. 4. a) Spatial distribution of stand origin years, grouped in 50-year classes. Fire years were
determined with a precision of about 10 years and are illustrated by the fully colored squares, while the minimum time-since-fires are represented by the hatched cells. The same grid is pre-sented in b) but time-since-fire is grouped into structural age-classes: regeneration (0–30 yr), young (31–80 yr), mature (81–150) and over-mature (> 150 yr). 1 cell = 3700 ha.
4 Discussion
4.1 Historical Fire Regime
4.1.1 Fire Cycle
The 247-year historical fire cycle that we
cal-culated for the black-spruce-feather moss forest
of Central Quebec is consistent with the fire
cycle gradient observed between western (128,
189, 141 yr; Bergeron et al. 2004, Le Goff et al.
2007) and eastern (281 yr, 270 yr, > 500 yrs, Cyr
et al. 2007, Bouchard et al. 2008) neighbouring
regions of Quebec. In addition, the observations
for our study area seem more similar to the
situ-ation in the East, associated with a lower fire
fre-quency, although the 95% confidence intervals
(187–309 yr) are broad. The fire cycle value
involves important temporal variability at the
cen-tury- and decade-scales. Our results show a fire
hazard peak around 1825 and a general decrease
thereafter. Such long-term trends are not
uncom-mon for boreal forests. In some regions, changes
around 1850 have been attributed to the end of the
Little-Ice-Age (Bergeron and Archambault 1993,
Bergeron et al. 2004), an era characterised by
dryer decades (Girardin et al. 2004). On a shorter
time-scale, a few fire-decades have strongly
influ-enced the age-class distribution in 2009 (1820,
1860, 1920, and 2000). As Girardin et al. (2006)
indicated 1920–1940 and 1800–1850 as periods
of enhanced occurrence of a high drought index
over the Boreal Shield, we may at least partly
attribute these fire decades to similar dry
condi-tions. Overall, as elsewhere in the boreal forest
of North America, it appears that temporal
varia-tion in fire frequency is mainly driven by climate
(Bergeron and Archambault 1993, Larsen 1996,
Gillett et al. 2004, Le Goff et al. 2007, Flannigan
et al. 2009).
The fire cycle that was calculated after 1949,
from the beginning of industrial human
activi-ties in our region, is significantly longer than the
fire cycle prior to settlement (1734–1948). The
impact of land-use changes on the fire regime
is probably not the main reason for this trend,
notably when the only activity in the area was
logging (Lefort et al. 2003). This period also
corresponds with the beginning of active fire
control in Quebec, which started around 1930
(Blanchet 2003). Although fire control may have
had some effect on the observed low fire
fre-quency, the effectiveness of control strategies
on the occurrence of large fires is questionable
(Bridge et al. 2005), especially regarding the
large fires that occurred in 2005 and 2007 and
despite having much more advanced technology.
As unfavorable climate trends for fire occurred
during the second half of the 20th C in the region
(Lefort et al. 2003, Girardin et al. 2006, Girardin
and Wotton 2009), it is probable that the low fire
frequency is attributable to a period where the
climate was not conducive to large fires.
The fire frequency variation previously
described is partly responsible for the broad
confidence interval associated with fire cycle
calculation (187–309 years). A portion is also
attributable to the gradual loss of information
that is caused by aging of the forest, when traces
of the initial post-fire cohort gradually disappear,
making it impossible to date the last fire event
from within-stand age-structure. Moreover, in the
context of high fire severity and in the absence of
fire-resistant species, re-burning of some areas
erases the traces of past events.
4.1.2 Fire Size
The fire size distribution roughly fitted a truncated
negative exponential curve (e.g., Cumming 2001).
However, Fig. 3a showed that small fires (10–100
Table 3. Theoretical age-class distribution in the
land-scape (% of the landland-scape), modelled with the negative exponential distribution associated with a fire cycle of 247 years and its 95% confidence interval (CI) i.e., 187 yrs to 309 yrs. Values for 2009 would represent the age-class distribution if the territory had remained un-managed.
Tsf 2.5% (CI) FC =247yr 97.5% (CI) In 2009
% % % %
0–30 9.2 11.4 14.8 10 31–80 13.5 16.2 20.0 1 81–150 15.6 17.9 20.3 < 38 > 150 44.9 54.5 61.6 > 51
ha) should be more frequent to perfectly fit the
distribution. We suspect underestimation of this
size class, either because of the lower efficiency
of detection techniques for small fires, or because
of human influence on the fire size distribution.
Regarding the burned area, most of it was
attribut-able to fires larger than 10 000 ha.
The fire size distribution was of the same order
of magnitude as those for other black
spruce-feather moss regions in Quebec (Belleau et al.,
2007). Otherwise, while size distribution
fol-lowed a curve similar to that found for Western
Canada (Cumming 2001), it is 10 times lower in
magnitude.
4.1.3 Fire Regime and Old-Growth Forests
At the time of the study, in 2009, regardless
of harvests, the study area was mainly
repre-sented by forests older than 150 years (more
than 51%), followed by a maximum of 38% for
mature forests (81–150 years). Young forests and
regeneration accounted for 11% of the landscape.
However, as shown in Fig. 2a, the study was
conducted following a period of low fire activity
(1930–2000), which explains the quasi-absence
of young forests (31–80 years). The associated
age-class spatial configuration of the landscape is
characterised by large areas of contiguous forests
that differ in their successional stage. A few fire
events (~1820, ~1860, 1924, 2005, 2007) have
successively created large areas of regeneration
forests. Moreover, their spatial contingency has
resulted in old-growth agglomerations of
hun-dreds of square kilometres.
Although our portrayal of 2009 is an example
of a realisation of the fire regime that has occurred
over the last three centuries, it is not accurate for
describing the historical variability of age-class
proportions in the landscape (Armstrong 1999).
Therefore, we turned to the fire cycle, which
includes the variability of the last 300 years.
Average proportions of each age-class that are
associated with a fire cycle of 247 years and its
confidence interval (187–309 years) have been
calculated for the entire 1734–2009 period. After
modelling, old-growth forests still represent most
of the study area with an average of 55% of the
landscape.
Given the importance of providing clear
numer-ical targets for ecosystem-based management
(Angelstam 1998, Lindenmayer et al. 2008), the
question arises: how much old-growth is enough?
We found that fire hazard has been variable over
the last 300 years, as has the proportion of
old-growth forests. Despite this evidence of
impor-tant natural variability, we propose a single-value
target of 55% of the landscape that should be
managed to maintain the specific composition
and structure of old-growth stands. We used this
average value being aware that extreme events
(e.g., fires of the 1920’s) are an important part of
the natural variability that can drive a natural
land-scape outside the management target described
here. Three main reasons justify our decision to
present targets based on average mean values.
First, unlike in Fennoscandia where fires have
been practically excluded, such extreme events
are still occurring in eastern North America (for
example, the great fires of 2005 and 2007), and
even more considering climate changes (Amiro
et al. 2009, Flannigan et al. 2009, Girardin et al.
2010). As successive disturbances such as fires,
insect outbreaks, and harvesting lead to loss of
ecosystem resilience (Payette and Delwaide 2003,
Girard et al. 2008), we argue that, even if large fire
events are an important part of natural variability,
ecosystem management should avoid going to
these extremes. Second, for socio-economic
cerns, forest-dependent communities need a
con-stant timber-supply. Finally, if the emulation of
extreme-natural-events could be justified by
eco-system management, the occurrence of
extreme-management-events may be prone to happening
simultaneously over extended regions, following
market fluctuations. Such regional standardisation
of the boreal forest may be desirable for neither
diversity nor resilience of the forest.
Regarding spatial configuration of successional
stages, Fig. 4 shows that, as a consequence of a
regime of large fires, burned areas are to a great
extent contiguous, and so are the old-growth
for-ests. The ability of old-growth forests to meet
their ecological functions is closely linked to their
size and their connectivity (Harris 1984,
Saun-ders et al. 1991, Lindenmayer et al. 2008). Yet
remnant forests, as provided in traditional
man-agement plans, tend to be left as strips or islets
(Doucet et al. 2009); they are highly susceptible
to wind-throw, further decreasing the amount of
interior forest (Ruel et al. 2001). To respect the
landscape pattern that originates from the natural
fire regime, ecosystem management should plan
to include large contiguous areas of old-growth
forests. Fig. 4b provides an order of magnitude
of the target sizes, where three contiguous cells
correspond to patches > 100 km
2.
4.2 Management Strategies
To reach the objective of maintaining diversity
and resilience associated with old-growth
for-ests, ecosystem management strategies should
be oriented towards both natural processes and
feature conservation and restoration (Lahde et
al. 1999, Franklin et al. 2002, Vanha-Majamaa
et al. 2007). We propose a brief overview of four
complementary strategies to reach the 55% of
old-growth’s objective.
1) Extending rotation time: Currently, stand rota-tions truncate the succession process that leads to the natural development of old-growth stands. Simply extending the rotation-time, as described by Burton et al. (1999), would allow stands to reach an old-growth stage before they get har-vested. Taken this strategy alone, according to the fire regime of our study area, rotation time should be extended over 300 years, which may be hardly reconcilable with industrial and economic requirements. Alternatively, Seymour and Hunter (1999) proposed adopting variable rotation lengths for the same landscape. For example, some stands would be harvested every 100 years, while others were allowed to grow for 300 years before being harvested, in order to re-create an age-structure similar to the natural one generated by fires. In all cases, extending the rotation time in our study area as elsewhere in the eastern boreal forest, to be efficient and realistic, may be used in addition to other strategies.
2) Integral conservation: Along with the idea of pre-serving succession and gap formation processes, the integral conservation of some key areas may be an effective way of preserving a part of the primeval landscape. In parallel, Bengtsson et al. (2003) introduced the concept of spatially and temporally dynamic reserves. These could be selected according to specific old-growth features
(Timonen et al. 2011) and moved in time and space to make sure they keep their specific ecological functions. Dynamic reserves are already being implemented for a woodland caribou preservation strategy (Équipe de rétablissement du caribou forestier du Québec 2008).
3) Cohort management: Along with these process-oriented strategies, feature-process-oriented strategies focus on preserving or restoring old-growth attributes (composition, structure). They involve greater alteration of ecosystems but reduced costs in relation to timber supply (Harvey et al. 2002). For example, partial cuttings that are designed to emulate secondary disturbances such as spruce-budworm outbreaks and wind-throw have proved effective in emulating old-growth structure and composition (Harvey et al. 2002, Harvey and Brais 2007, Kneeshaw et al. 2011), especially when improved by special attention being paid to deadwood supply (Harmon 1986, Siitonen 2001, Harvey et al. 2002).
4) Landscape deployment: Ecosystem management addresses the problem of forest fragmentation (Fahrig 2003) by creating harvest agglomerations (adjacent cutovers aggregated over a 5–15 year period) rather than dividing them sporadically in space and time through the landscape (Bel-leau et al. 2007), which better mimics the spa-tial pattern generated by the natural fire regime. Aggregated harvests can thus minimise habitat fragmentation provided that large tracks of mature and over-mature forest (managed or natural) are interspersed among them (Perron et al. 2009).
5 Conclusion
We conclude from our results that 1) old-growth
forests (> 150 yr) represented an average of 55%
of the study area during the last 300 yrs. 2)
Because of the regime of large fires, the spatial
pattern of these forests is organised into large
patches of several hundred square kilometres. 3)
In order to preserve diversity associated with
old-growth forests, a critical portion of the landscape
should be dedicated to preservation/restoration
of old-growth structure and composition, with a
focus on connectivity. Considering the variability
of fire frequencies throughout the boreal forest,
the data should not be extrapolated to
neighbour-ing regions as a whole but should contribute to
specifying the spatial variation of fire frequency
in the Eastern boreal forest of North America.
Acknowledgements
We greatly thank Alain Leduc for his valuable
contribution to analysis and manuscript revision.
We wish to underline the work of William F.J.
Parsons, David Gervais, and Jessie and Sophie
Kulaga for English revision, of Mélanie
Desroch-ers and Daniel Lesieur for technical support, and
of Élisabeth Turcotte, Myriam Jourdain, David
Gervais, Léa Langlois, Alexandre Turcotte,
Nico-las Fauvart, Jean-Guy Girard, as well as UQAC
plant ecology lab members for their assistance
in the lab and on the field. We also acknowledge
the NSERC-UQAT-UQAM Industrial Chair in
Sustainable Forest Management
for material and
scientific support.
This project was funded by the Fonds de la
Recherche Forestière du
Saguenay-Lac-Saint-Jean
and the Fonds de Recherche Nature et
Technologies du Québec. We used forest
inven-tory and fire data from the Ministère des
Res-sources Naturelles et de la Faune du Québec. We
also underline the financial contribution of the
Natural Sciences Engineering Research Council
of Canada
. Finally, we thank Resolute Forest
Products
for their partnership in the project and
accommodation during field work.
References
Ali, A.A., Carcaillet, C. & Bergeron, Y. 2009. Long term fire frequency variability in the eastern Canadian boreal forest: the influences of climate vs. local factors. Global Change Biology 15(5): 1230–1241.
Amiro, B., Cantin, A., Flannigan, M. & De Groot, W. 2009. Future emissions from Canadian boreal forest fires. Canadian Journal of Forest Research 39(2): 383–395.
Angelstam, P. 1998. Maintaining and restoring biodi-versity in European boreal forests by developing
natural disturbance regimes. Journal of Vegetation Science 9(4): 593–602.
— & Kuuluvainen, T. 2004. Boreal forest disturbance regimes, successional dynamics and landscape structures – a European perspective. Ecological Bulletins 51: 117–136.
Armstrong, G.W. 1999. A stochastic characterisation of the natural disturbance regime of the boreal mixedwood forest with implications for sustainable forest management. Canadian Journal of Forest Research 29(4): 424–433.
Axelsson, A.L., Östlund, L. & Hellberg, E. 2002. Changes in mixed deciduous forests of boreal Sweden 1866–1999 based on interpretation of historical records. Landscape Ecology 17(5): 403–418.
Belleau, A., Bergeron, Y., Leduc, A., Gauthier, S. & Fall, A. 2007. Using spatially explicit simula-tions to explore size distribution and spacing of regenerating areas produced by wildfires: recom-mendations for designing harvest agglomerations for the Canadian Boreal forest. Forestry Chronicle 83(1): 72–83.
Bengtsson, J., Angelstam, P., Elmqvist, T., Emanuels-son, U., Folke, C., Ihse, M., Moberg, F. & Nyström, M. 2003. Reserves, resilience and dynamic land-scapes. Ambio 32(6): 389–396.
Bergeron, Y. 1993. Decreasing frequency of forest fires in the southern boreal zone of Québec and its rela-tion to global warming since the end of the «Little Ice Age.» The Holocene 3(3): 255–259.
— 2000. Species and stand dynamic in the mixed woods of Quebec’s southern boreal forest. Ecology 81(6): 1500–1516.
— , Cyr, D., Drever, C.R., Flannigan, M., Gauthier, S., Kneeshaw, D., Lauzon, È., Leduc, A., Goff, H.L., Lesieur, D. & Logan, K. 2006. Past, current, and future fire frequencies in Quebec’s commer-cial forests: implications for the cumulative effects of harvesting and fire on age-class structure and natural disturbance-based management. Canadian Journal of Forest Research 36: 2737–2744. — , Flannigan, M., Gauthier, S., Leduc, A. & Lefort, P.
2004. Past, current and future fire frequency in the Canadian boreal forest: Implications for sustainable forest management. Ambio 33(6): 356–360. — , Leduc, A., Harvey, B.D. & Gauthier, S. 2002.
Natural fire regime: A guide for sustainable man-agement of the Canadian boreal forest. Silva Fen-nica 36(1): 81–95.
Bessie, W.C. & Johnson, E.A. 1995. The relative importance of fuels and weather on fire behavior in subalpine forests. Ecology 76(3): 747–762. Blanchet, P. 2003. Feux de forêt, l’histoire d’une
guerre. Éditions trait d’union and Patrick Blan-chet, Montréal.
Bouchard, M., Pothier, D. & Gauthier, S. 2008. Fire return intervals and tree species succession in the North Shore region of eastern Quebec. Canadian Journal of Forest Research 38: 1621–1633. Boucher, Y., Arseneault, D., Sirois, L. & Blais, L.
2009. Logging pattern and landscape changes over the last century at the boreal and deciduous forest transition in Eastern Canada. Landscape Ecology 24(2): 171–184.
Brassard, F., Bouchard, A. R., Boisjoly, D., Poisson, F., Bazoge, A., Bouchard, M.-A., Lavoie, G., Tardif, B., Bergeron, M., Perron, J., Balej, R. & Blais, D. 2009. Portrait du réseau d’aires protégées au Québec – 2002–2009. Ministère du développement et des Parcs du Québec (ed.). Québec. 39 p. Bridge, S.R.J., Miyanishi, K. & Johnson, E.A. 2005.
A critical evaluation of fire suppression effects in the boreal forest of Ontario. Forest Science 51(1): 41–50.
Burton, P.J., Kneeshaw, D.D. & Coates, K.D. 1999. Managing forest harvesting to maintain old growth in boreal and sub-boreal forests. Forestry Chronicle 75(4): 623–631.
Carcaillet, C., Bergeron, Y., Richard, P.J.H., Fréchette, B., Gauthier, S. & Prairie, Y.T. 2001. Change of fire frequency in the eastern Canadian boreal forests during the Holocene: Does vegetation composi-tion or climate trigger the fire regime? Journal of Ecology 89: 930–946.
— , Bergman, I., Delorme, S., Hornberg, G. & Zackris-son, O. 2007. Long-term fire frequency not linked to prehistoric occupations in northern Swedish boreal forest. Ecology 88(2): 465–477.
— & Richard, P.J.H. 2000. Holocene changes in sea-sonal precipitation highlighted by fire incidence in eastern Canada. Climate Dynamics 16: 549–559. Chen, H.Y.H. & Popadiouk, R.V. 2002. Dynamics of
North American boreal mixedwoods. Environmen-tal Reviews 10: 137–166.
Christensen, N.L., Bartuska, A.M., Brown, J.H., Car-penter, S., D’Antonio, C., Francis, R., Franklin, J.F., MacMahon, J.A., Noss, R.F. & Parsons, D.J. 1996. The report of the Ecological Society of America committee on the scientific basis for
eco-system management. Ecological Applications 6(3): 665–691.
Coulombe, G. 2004. Commission d’étude sur la gestion de la forêt publique québécoise.
Courtois, R., Ouellet, J.-P., Dussault, C. & Gingras, A. 2004. Forest management guidelines for forest-dwelling caribou in Quebec. Forestry Chronicle 80(5): 598–607.
Cox, D.R. 1972. Regression models and life-tables. Journal of the Royal Statistical Society. Series B (Methodological) 34(2): 187–220.
Cumming, S. 2001. A parametric model of the fire-size distribution. Canadian Journal of Forest Research 31(8): 1297–1303.
Cyr, D. 2011. Cycle des feux, vieilles forêts et aménagement en forêt boréale de l’est du Canada. Ph.D. thesis, Université du Québec à Montréal, Montréal, QC.
— , Gauthier, S. & Bergeron, Y. 2007. Scale-depend-ent determinants of heterogeneity in fire frequency in a coniferous boreal forest of eastern Canada. Landscape Ecology 22(9): 1325–1339.
— , Gauthier, S., Bergeron, Y. & Carcaillet, C. 2009. Forest management is driving the eastern North American boreal forest outside its natural range of variability. Frontiers in Ecology and the Environ-ment 7(10): 519–524.
Didion, M., Fortin, M.J. & Fall, A. 2007. Forest age structure as indicator of boreal forest sustainability under alternative management and fire regimes: a landscape level sensitivity analysis. Ecological Modelling 200(1–2): 45–58.
Dix, R.L. & Swan, J.M.A. 1971. The roles of distur-bance and succession in upland forest at Candle Lake, Saskatchewan. Canadian Journal of Botany 49: 657–676.
Doucet, R., Jutras, S., Lessard, G., Pineau, M.P., Guy, Ruel, J.-C. & Thiffault, N. 2009. Sylviculture appliquée. In: É. MultiMonde (ed.). Manuel de foresterie. p. 1147–1186.
Drapeau, P., Leduc, A., Bergeron, Y., Gauthier, S. & Savard, J.-P.L. 2003. Bird communities of old spruce-moss forests in the Clay Belt region: prob-lems and solutions in forest management. Forestry Chronicle 79(3): 531–540.
Drobyshev, I., Goebel, P.C., Hix, D.M., Corace, R.G. & Semko-Duncan, M.E. 2008. Pre- and post-Euro-pean settlement fire history of red pine-dominated forest ecosystems of Seney National Wildlife Refuge, Upper Michigan. Canadian Journal of
Forest Research 38(9): 2497–2514.
Ekbom, B., Schroeder, L.M. & Larsson, S. 2006. Stand specific occurrence of coarse woody debris in a managed boreal forest landscape in central Sweden. Forest Ecology & Management 221(1–3): 2–12. Équipe de rétablissement du caribou forestier du
Québec. 2008. Plan de rétablissement du caribou forestier (Rangifer tarandus) au Québec – 2005– 2012. Ministère des Ressources naturelles et de la Faune, Faune Québec & Direction de l’expertise sur la faune et des habitats (eds.). 78 p. Québec. Fahrig, L. 2003. Effects of habitat fragmentation on
biodiversity. Annual Review of Ecology Evolution & Systematics 34: 487–515.
Flannigan, M., Stocks, B., Turetsky, M. & Wotton, M. 2009. Impacts of climate change on fire activity and fire management in the circumboreal forest. Global Change Biology 15(3): 549–560.
Franklin, J.F. 1993. Preserving biodiversity: species, ecosystems or landscapes? Ecological Applications 3(2): 202–205.
— , Spies, T.A., Pelt, R.V., Carey, A.B., Thornburgh, D.A., Berg, D.R., Lindenmayer, D.B., Harmon, M.E., Keeton, W.S., Shaw, D.C., Bible, K. & Chen, J. 2002. Disturbances and structural devel-opment of natural forest ecosystems with silvicul-tural implications, using Douglas-fir forests as an example. Forest Ecology & Management 155(1–3): 399–423.
Gauthier, S., Bergeron, Y. & Simon, J.-P. 1993. Cone serotiny in jack pine: ontogenetic, positional, and environmental effects. Canadian Journal of Forest Research 23(3): 394–401.
— , De Grandpré, L. & Bergeron, Y. 2000. Differences in forest composition in two boreal forest ecore-gions of Quebec. Journal of Vegetation Science 11: 781–790.
— , Vaillancourt, M.-A., Kneeshaw, D.D., Drapeau, P., De Grandpre, L., Claveau, Y. & Pare, D. 2009a. Forest ecosystem management: Origins and founda-tions. In: S. Gauthier, M.A. Vaillancourt, A. Leduc, L. De Grandpre, D.D. Kneeshaw, H. Morin, P. Dra-peau & Y. Bergeron (eds.). Ecosystem management in the boreal forest. Les Presses de l’Université du Québec. p. 13–38.
— , Vaillancourt, M.-A., Leduc, A., De Grandpré, L., Kneeshaw, D.D., Morin, H., Drapeau, P. & Bergeron, Y. 2009b. Ecosystem management in the boreal forest. Québec: Presses de l’Université du Québec.
Gillett, N., Weaver, A., Zwiers, F. & Flannigan, M. 2004. Detecting the effect of climate change on Canadian forest fires. Geophysical Research Let-ters 31(18): L18211.
Girard, F., Payette, S. & Gagnon, R. 2008. Rapid expan-sion of lichen woodlands within the closed-crown boreal forest zone over the last 50 years caused by stand disturbances in eastern Canada. Journal of Biogeography 35: 529–537.
Girardin, M.P. & Wotton, B.M. 2009. Summer mois-ture and wildfire risks across Canada. Journal of Applied Meteorology and Climatology 48(3): 517–533.
— , Tardif, J., Flannigan, M.D., Wotton, B.M. & Bergeron, Y. 2004. Trends and periodicities in the Canadian Drought Code and their relation-ships with atmospheric circulation for the southern Canadian boreal forest. Canadian Journal of Forest Research 34(1): 103–119.
— , Bergeron, Y., Tardif, J.C., Gauthier, S., Flan-nigan, M.D. & Mudelsee, M. 2006. A 229-year dendroclimatic-inferred record of forest fire activ-ity for the Boreal Shield of Canada. International Journal of Wildland Fire 15(3): 375–388. — , Ali, A.A. & Hély, C. 2010. Wildfires in boreal
eco-systems: Past, present and some emerging trends. International Journal of Wildland Fire 19(8): 991– 995.
Grenier, D.J., Bergeron, Y., Kneeshaw, D. & Gauthier, S. 2005. Fire frequency for the transitional mixed-wood forest of Timiskaming, Quebec, Canada. Canadian Journal of Forest Research 35(3): 656– 666.
Grissino-Mayer, H.D. 2001. Research report evaluat-ing crossdatevaluat-ing accuracy: a manual and tutorial for the computer program COFECHA. Tree-Ring Research 57(2): 205–221.
Grumbine, R.E. 1994. What is ecosystem manage-ment? Conservation Biology 8(1): 27–38. Haila, Y., Comer, P.J., Hunter, M., Samways, M.J.,
Hambler, C., Speight, M.R., Hendricks, P., Herrero, S., Dobson, F.S. & Smith, A.T. 1997. A natural «benchmark» for ecosystem function. Conserva-tion Biology 11(2): 300–307.
Harmon, M.E. 1986. Ecology of coarse woody debris in temperate ecosystems. Advances in Ecological Research 15: 133–302.
Harper, K.A., Bergeron, Y., Gauthier, S. & Drapeau, P. 2002. Post-fire development of canopy structure and composition in black spruce forests of Abitibi,