A
c
c
e
p
te
d
P
r
e
p
r
in
t
This article is protected by copyright. All rights reserved
Environmental Toxicology
Organic Selenium, Selenate and Selenite Accumulation by Lake Plankton and
the Alga Chlamydomonas reinhardtii at Different pH and Sulfate
Concentrations
Dominic E. Ponton, Claude Fortin and Landis Hare
Environ Toxicol Chem., Accepted Article • DOI: 10.1002/etc.4158
Accepted Article
"Accepted Articles" are peer-reviewed, accepted manuscripts that have not been edited, formatted, or in any way altered by the authors since acceptance. They are citable by the Digital Object Identifier (DOI). After the manuscript is edited and formatted, it will be removed from the “Accepted Articles” Web site and published as an Early View article. Note that editing may introduce changes to the manuscript text and/or graphics which could affect content, and all legal disclaimers and ethical guidelines that apply to the journal pertain. SETAC cannot be held responsible for errors or consequences arising from the use of information contained in these manuscripts.
A
c
c
e
p
te
d
P
r
e
p
r
in
t
This article is protected by copyright. All rights reserved
Environmental Toxicology Environmental Toxicology and Chemistry
DOI 10.1002/etc.4158 D.E. Ponton et al.
Accumulation of Se species by plankton
Organic Selenium, Selenate and Selenite Accumulation by Lake Plankton and the Alga Chlamydomonas reinhardtii at Different pH and Sulfate Concentrations
Dominic E. Ponton,* Claude Fortin, and Landis Hare
Institut National de la Recherche Scientifique – Centre Eau, Terre et Environnement
(INRS-ETE), Université du Québec, Quebec City, Quebec, Canada
* Address correspondence to Dominic.ponton@umontreal.ca
This article contains online-only Supplemental Data
This article is protected by copyright. All rights reserved
Submitted 21 November 2017; Returned for Revision 10 January 2018; Accepted 18 April 2018
A
c
c
e
p
te
d
P
r
e
p
r
in
t
This article is protected by copyright. All rights reserved
Abstract: Selenium (Se) concentrations measured in lake planktonic food chains (microplankton < 64 µm, copepods and Chaoborus larvae) were strongly correlated with the concentrations of
dissolved organic Se. These correlations were strengthened slightly by adding the concentrations
of dissolved selenate to those of organic Se. To better understand the role of Se species and the
influence of water chemistry on Se uptake, we exposed the green alga Chlamydomonas
reinhardtii to selenite, selenate or selenomethionine at various H+ ion and sulfate concentrations under controlled laboratory conditions. At low sulfate concentrations, inorganic Se species
(selenate >> selenite) were more readily accumulated by this alga than was selenomethionine.
However, at higher sulfate concentrations the uptake of selenite was higher than that of selenate
while the uptake of selenomethionine remained unchanged. While pH of the exposure water did
not influence the uptake of selenate by this alga, the accumulation of selenomethionine and
selenite increased with pH because of their relative pH-related speciation. The Se concentrations
that we measured in C. reinhardtii exposed to selenomethionine were 30 times lower than those
that we measured in field-collected microplankton exposed in the same laboratory conditions.
This difference is explained by the taxa present in the microplankton samples. Using our
laboratory measurements of Se uptake in microplankton and our natural Se concentrations in
lakewater allowed us to model Se concentrations in a lake pelagic food chain. This article is
protected by copyright. All rights reserved
A
c
c
e
p
te
d
P
r
e
p
r
in
t
This article is protected by copyright. All rights reserved INTRODUCTION
Aquatic systems can be contaminated by selenium (Se) from agricultural irrigation, metal
mining and refining as well as fossil fuel extraction and combustion (Lemly 2004). Aquatic
animals living in Se-contaminated ecosystems can accumulate this element to high
concentrations. For example, very high Se concentrations ([Se]) were reported in chironomids
(139 µg/g dry weight (dw)) and Se-tolerant mosquitofish (170 µg/g dw) from Kesterson Refuge
in the San Joaquin Valley of California (Presser and Ohlendorf 1987). At this and other sites,
high [Se] have caused severe deformities in fish and aquatic birds (Presser and Ohlendorf 1987;
Lemly 1993). In Canada, recent measurements of Se in yellow perch (Perca flavescens)
collected from lakes in mining regions of Ontario and Quebec showed [Se] to be high in the
muscle (5 to 40 µg/g dw; Ponton and Hare 2015) and liver (8 to 48 µg/g dw; Ponton et al. 2016)
of this fish species.
Aquatic animals take up Se mainly from their food (Luoma and Rainbow 2008) and thus
their [Se] are determined in large part by those of organisms at lower trophic levels. In the
pelagic zone of lakes, [Se] in zooplankton are likely to be determined by those in planktonic
algae and bacteria (Stewart et al. 2010) that are in turn controlled by the concentrations of
various dissolved Se species (Ponton and Hare 2013). This linkage explains the strong
correlation reported between [Se] in lakewater and those in a zooplankton-feeding insect
(Croteau et al. 2003; Ponton and Hare 2013).
The chemical speciation of Se in freshwater varies depending on the contamination
source as well as the retention time and chemistry of the water body (Bowie 1996; Ponton and
Hare 2013). Selenium in natural waters is present in several oxidation states including selenate
A
c
c
e
p
te
d
P
r
e
p
r
in
t
This article is protected by copyright. All rights reserved
2010). Se(VI) is at higher proportions and concentrations near contamination sources because
although its reduction to Se(IV) and Org-Se is possible, its re-oxidation to Se(VI) is
thermodynamically improbable under natural conditions (Cutter and Bruland 1984). Org-Se
species in water are produced through the biological reduction of inorganic Se species by
microorganisms (Cutter 1982). The most common forms of Org-Se in natural waters are
selenomethionine (Se-Met) and selenocysteine (Conde and Sanz Alaejos 1997).
Various Se species are reported to differ in their propensity for accumulation in aquatic
food chains. In the laboratory, investigators have reported either greater bioaccumulation of
Se(VI) than Se(IV) by planktonic green algae (Neumann et al. 2003; Fournier et al. 2006;
Simmons and Wallschläger 2011), or no difference in bioaccumulation between these inorganic
species in periphyton (Conley et al. 2013), or greater accumulation of Se(IV) compared to Se(VI)
(Luoma and Rainbow 2008) by the green alga C. reinhardtii (Vriens et al. 2016). Although there
are exceptions (Baines et al. 2001), Org-Se is generally thought to be the Se species with the
highest accumulation potential (Besser et al. 1993; Fournier et al. 2006; Stewart et al. 2010). In
the field, Ponton and Hare (2013) reported that the Org-Se concentrations in lakewater best
predicted those in larvae of the phantom midge Chaoborus; although adding Se(VI)
concentrations raised slightly the strength of the correlations for some lakes. At high sulfate
(SO4) concentrations, the accumulation of inorganic Se species is reported to be reduced in the
field (Ponton and Hare 2013) and in the laboratory for both Se(IV) (Morlon et al. 2006) and
Se(VI) (Fournier et al. 2010). These observations can be explained by the chemical similarities
between inorganic Se and SO4 ions (Reich and Hondal 2016) that can lead to competition at
A
c
c
e
p
te
d
P
r
e
p
r
in
t
This article is protected by copyright. All rights reserved
protonation state of Se(IV) and its bioaccumulation (Riedel and Sanders 1996; Morlon et al.
2006), although this hypothesis remains to be rigorously tested.
The relationship between [Se] in adjacent links of food chains have been characterized
using trophic transfer ratios (TTF = [Se]consumer/[Se]prey), whereas [Se] at the base of food chains
have been described using partition coefficients (kd) representing the ratio of [Se] in primary
producers and those in water (Presser and Luoma 2010). However, kds could vary widely among
sites due to variations in Se speciation in water, ambient physico-chemical conditions and the
occurrence of various types of primary producers. Such variations are not generally considered.
To better understand the influence of Se speciation on Se bioaccumulation by lake
planktonic food chains, we compared the accumulation of Se(IV), Se(VI) and Org-Se at various
H+ ion and SO4 concentrations by the freshwater green alga Chlamydomonas reinhardtii in the
laboratory. We used this algal species because it is tolerant of high [Se] (Morlon et al. 2005),
easy to culture and grows over a wide range in H+ concentrations (Lustigman et al. 1995). To
determine whether our laboratory results for this algal species are representative of Se
accumulation by mixed plankton in the field, we also exposed uncontaminated field-collected
microplankton (< 64 µm) to various Se species under conditions that were similar to those used
for C. reinhardtii. Lastly, we used our Se-uptake measurements on field-collected microplankton
exposed to Se in the laboratory to predict [Se] in a lake planktonic food chain comprising
microplankton, zooplankton (copepods) and their predators, that is, larvae of the phantom midge
Chaoborus. This predator has been used as a trace element biomonitor in lake plankton in part
because it is tolerant to trace elements and thus persists in many lakes impacted by acidic
A
c
c
e
p
te
d
P
r
e
p
r
in
t
This article is protected by copyright. All rights reserved METHODS
Lake sampling
We collected water, microplankton, crustacean zooplankton and larvae of the phantom
midge Chaoborus in late May and early June in 2010 and 2011 from 12 to 18 lakes located on
the Precambrian Shield in the mining areas of Sudbury (Ontario) and Rouyn-Noranda (Quebec),
Canada. Lake locations and information on their Se sources (Figure 1), pH, SO4 and dissolved
organic matter concentrations as well as the different Se species concentrations (Org-Se, Se(IV)
and Se(VI)) are given in Supplemental Data (Supp. Data; Table S1). Uncontaminated
microplankton was collected from Lake Bedard (47o16´N,71o07´W), which is located 70
kilometers north of Quebec City (Quebec, Canada) on the Precambrian Shield.
Lakewater collection
We used diffusion samplers to collect lakewater by in situ filtration. In the laboratory, the
acid-cleaned, Plexiglas or polypropylene, diffusion samplers were filled with ultrapure water and
covered with a 0.2 µm pore-size polysulfone membrane (Gelman HT-200) before being sealed
individually in plastic bags. In each lake, three diffusion samplers were anchored 1 m below the
surface, that is, in the epilimnion where Chaoborus larvae feed on zooplankton (Carter and Kwik
1977; Hare and Carter 1987). Equilibration times in lakewater varied depending on the volume
of sampler cells, that is, from 3 d (4 mL cells) to 10 d (125 and 250 mL cells; our unpublished
data showed that 5 d is sufficient). Water samples were removed immediately upon retrieval of
the samplers.
Samples (4 mL) for major anions (Cl-, NO3-, SO42-) were removed using a pipette with an
unused plastic tip that had been rinsed in ultrapure water. These samples were injected into new
A
c
c
e
p
te
d
P
r
e
p
r
in
t
This article is protected by copyright. All rights reserved
water. Concentrations of anions (Cl-, NO3-, SO42-) in lakewater were measured by ion
chromatography (Dionex, system ICS-2000; AS-18 column).
The water to be used for Se speciation measurements (a minimum of 30 mL) was stored
in acid-washed HDPE or polypropylene bottles, on ice, for a maximum of 10 days to prevent
changes in Se speciation. Wang (1994) showed that there were no measurable losses of Se(IV),
Se(VI) or selenomethionine following storage of purified tap-water for 15 days at 4 oC. Since
most bacteria and algae exceed the pore size of the sampler membrane (0.2 µm), they could not
have influenced Se speciation in the water samples.
Selenium speciation measurements in lakewater
We measured Se speciation in lakewater by hydride generation of Se(IV) followed by
detection using atomic fluorescence spectrometry (HG-AFS; Millennium Excalibur System, PS
Analytical) in the laboratory of N. Belzile and Y. Chen at Laurentian University in Sudbury,
Ontario. These researchers (Chen et al. 2005a, 2005b) developed the speciation measurement
method, which they describe as being simple, precise and not subject to interference due to other
elements.
We measured Se(IV) by acidifying a 10 mL subsample of lakewater with HCl to a final
concentration of 3.0 M (Cutter 1978). A second subsample (20 mL) was used to determine
Org-Se and Org-Se(VI) by acidification with HNO3 and HCl to a final matrix of 1 and 2%, respectively
(volume/volume), and exposure to ultraviolet radiation (wavelength of 300 nm) for 2 h in a
quartz tube sealed with Parafilm. Irradiated samples were cooled on ice for 1 h and then acidified
to 3.0 M with HCl. This UV treatment creates OH radicals that oxidize organo-Se to Se(IV), and
oxidation of Se(IV) to Se(VI) is prevented by HCl. Chen et al. (2005b) describe in detail the
A
c
c
e
p
te
d
P
r
e
p
r
in
t
This article is protected by copyright. All rights reserved
transformed to Se(IV) using this method. Subtracting the first measurement (Se(IV)) from the
second (Se(IV) + Org-Se) gives the Org-Se concentration. The remaining 10 mL of UV-treated
sample was acidified to 3.0 M with HCl and submitted to a microwave digestion in closed vials
(MicroSYNTH, Milestone; MLSeasyWAVE 3.5.4.0 software) at 110 oC for 15 min to reduce
Se(VI) to Se(IV). These samples were cooled on ice before measuring total Se. Using this
method, Chen et al. (2005a) reported 91% recovery of Se(VI) spiked into lakewater. The
concentration of Se(VI) is obtained by subtracting Se(IV) + Org-Se (post UV) from the
concentration of total Se (post-microwave). Our Org-Se recovery was 100 ± 7% and between 97
and 107% for Se(VI) at a concentration of 0.1 µg/L. Mean values (n = 3) per site that were lower
than the detection limit of 21 ng/L were set as half the detection limit, that is, 10.5 ng/L.
Microplankton collection
We used a 2-meter long, 3-cm diameter, plastic tube to collect integrated samples of
epilimnetic water in the center of each lake. These samples were immediately filtered through a
64 µm mesh-aperture plastic sieve, to remove macro-zooplankton (see section Zooplankton
collection), and put in plastic containers. In the laboratory, Lake Bédard subsamples (500 mL
glass bottles; 1% Lugol’s; n = 3) were taken for the identification and counting of microplankton
and bacteria using an inverted microscope (Axiovert, 200; Axio Vision 3.0 software) and a flow
cytometer (BD FACSCalibur, BD Biosciences), respectively. Cell volume and surface area were
measured according to the methods of Hillebrand et al. (1999). Filtered lakewater (˂ 0.64 µm;
~40 L) was then centrifuged (Westfalia Separator LWA 205, Centrico Inc.) to concentrate
microplankton. The centrifugation process was efficient since algal cell counts in centrifuged
samples were two orders of magnitude lower than those prior to centrifugation. Three samples of
A
c
c
e
p
te
d
P
r
e
p
r
in
t
This article is protected by copyright. All rights reserved
in an acid-washed 1.5 mL polypropylene centrifuge tube and frozen at -20 oC until drying,
digestion and Se analysis. Field microplankton samples from some lakes had refractory inorganic
matter still present after digestion that was removed by centrifugation before analysis.
Uncontaminated microplankton from Lake Bédard (for the laboratory experiment) that had been
concentrated by flow-through centrifugation was resuspended in about 100 mL of Se-free
exposure medium prior to inoculation of the exposure medium.
Zooplankton collection
We collected crustacean zooplankton and Chaoborus larvae at night by hauling a 64 μm
mesh-aperture plankton net horizontally in the water column of each lake. Crustaceans were
separated from Chaoborus larvae using a 0.5 mm mesh-aperture sieve and both were held in
lakewater at field temperatures for transport to the laboratory.
Chaoborus larvae were sorted according to species (Saether 1972), and five samples per
lake were prepared by pooling 10-20 similar sized fourth-instars (Carter and Kwik 1977) per
sample. Chaoborus punctipennis was the only Chaoborus species present in all lakes, with the
exception of Lakes Kelly and Rouyn in which Chaoborus flavicans was the only species present.
Since [Se] in these two species are reported to be similar (Ponton and Hare 2013), we assumed
that Se data for the two could be combined.
Planktonic crustaceans held in a plastic bag were subject to a period of anoxia over the
first night at 4oC. This anoxia allowed us to eliminate cladocerans (not tolerant to anoxia) from
copepods by flotation, decantation and filtration on a 125 µm mesh-aperture plastic sieve. We
verified under a microscope that plankton fractions were composed of at least 90% copepods by
volume. For each lake, three samples of copepods (a major prey of Chaoborus; Croteau et al.
A
c
c
e
p
te
d
P
r
e
p
r
in
t
This article is protected by copyright. All rights reserved
polypropylene, microcentrifuge tubes and frozen at -20 oC until drying and analysis. The
maximum delay between collection and freezing was 1 day, during which time samples were
stored at 4 oC.
Algal cultures
All labware was soaked for 1 day in 15% HNO3 (volume/volume; Omni Trace Grade)
and rinsed five times with demineralized water and two times with ultrapure water (> 18 MΩ
cm). An agar culture of C. reinhardtii (CPCC 11 wild strain) was obtained from the Canadian
Phycological Culture Centre at the University of Waterloo, Waterloo, Ontario. Algae were
grown in an axenic modified high-salt medium with an ionic strength of 8.4 mEq/L (Fortin et al.
2004). One-liter Erlenmeyer flasks and the culture medium (without trace elements) were
sterilized at 121 oC for 15 minutes in an autoclave (Sanyo). After sterilization and cooling,
sodium hydroxide, trace elements and algae were added using sterilized pipette tips under a
sterile Class 100 laminar flow hood. A sterile piece of cotton (USP Sterile Cotton Roll, U.S.
Cotton) was put in the opening of each flask to prevent bacterial contamination. Cultures were
held in an environmental growth chamber (Conviron, CMP3023) at 20 ± 0.2 oC under constant,
cool-white, fluorescent lighting (100 µE m−2 s−1) and flasks rotated at the rate of 50 rotations per
minute. We used ~2 L of algae (separated into six 1-L sterile Erlenmeyer flasks) growing
exponentially for each experiment. One hour before each experiment, the 2 L of culture was
centrifuged (Sorval RC50 Plus, Du Pont) twice at 4,000 x g for 5 minutes; algae were rinsed
between centrifugations with Se-free exposure medium (see section Algae and microplankton
selenium exposure) and resuspended in about 100 mL of Se-free exposure medium. This rinsing
step allowed the removal of algal exudates that can influence Se speciation. The concentrated
A
c
c
e
p
te
d
P
r
e
p
r
in
t
This article is protected by copyright. All rights reserved
Algae and microplankton selenium exposure
Algae were exposed to Se at a cellular density of 125,000 cells/mL under the same light
and rotation conditions as the stock culture. At the end of the exposure periods, the [Se] in the
exposure medium had changed little (data not shown). Reagent-grade ACS salts were used to
prepare the exposure medium, the final concentrations of which were: NH4NO3 (30 µM), KNO3
(20 µM), MgCl2 (80 µM), CaCl2 (70 µM) and NaCl (100 µM). This exposure medium represents
the average concentrations of major ions in Rouyn-Noranda and Sudbury lakes (unpublished
results). Experiments were carried out in 400 mL of exposure medium held in 1 L sterile,
polypropylene, Erlenmeyer flasks (in triplicate, except where mentioned).
The nominal [Se] of all Se species used was 63 nM (5 µg/L), which was the previous
U.S. criterion for the protection of aquatic life in freshwater (US EPA 2016) and approximates
[Se] encountered in contaminated water bodies (Conde and Sanz Alaejos 1997; Lemly 2004;
Luoma and Rainbow 2008). According to the new criterion, if no fish tissue is available, the
30-day average water [Se] should not exceed 1.2 µg/L more than once every three years (US EPA
2016). The [Se] used was not toxic to C. reinhardtii since very high Se(IV) concentrations (50
µM, 4 mg/L) are needed to reduce the growth of C. reinhardtii (Morlon et al. 2005) and plants
are generally insensitive to Se (Young et al. 2010). The pH of the exposure medium was
maintained constant using 5 mM trishydroxymethylaminomethane buffer (TRIS, OmniPur
Grade, EM Science), and adjustments were made using hydrochloric acid (HCl, AristarUltra
Grade, VWR) to maintain the pH at 7.5 for experiments in which pH was not the studied
variable. This buffer was used because its effective pH range is 6.5 to 9.7. Sulfuric acid (ACS
A
c
c
e
p
te
d
P
r
e
p
r
in
t
This article is protected by copyright. All rights reserved
concentrations are different according to each treatment and are then specified in each figure
titles.
Following Se exposure, algae were centrifuged two times and rinsed between
centrifugations with alkaline (pH 8.5), Se-free, exposure medium to both remove Se adsorbed
onto cell membranes and remaining exposure medium. Since inorganic Se is reported to desorb
more readily at high pH (Lemly 2004), we rinsed algae with an alkaline solution to remove
adsorbed Se. Each algal pellet was removed using a micropipette and placed in an acid-washed
1.5 mL, polypropylene, centrifuge tube and centrifuged (Micromax, Thermo IEC) to remove all
remaining water. Pellets were frozen at -20 oC until drying and analysis.
Selenium concentration measurements in organisms
Frozen organisms were freeze-dried (FTS Systems), weighed using a microbalance
(Sartorius M2P PRO 11) and placed in acid-washed, high density, polyethylene bottles where
they were digested for 2 days at room temperature in concentrated HNO3 (Aristar grade; 100 μL
per mg sample dry weight) followed by 1 day in concentrated 30% (w/w) hydrogen peroxide
(Trace Select Ultra grade; 40 μL per mg sample dry weight); digestate volume was brought up to
1 mL per mg sample dry weight using ultrapure water. Certified reference material (lobster
hepatopancreas, TORT-2, National Research Council of Canada) was submitted to the same
digestion procedure. Selenium of mass 82 g/mol (82Se) was measured using Inductively Coupled
Plasma - Mass Spectrometry (ICP-MS; Thermo Elemental X Series) and interferences with
bromine (81Br + 1H) were corrected using a standard curve of several Br concentrations.
Selenium in the reference material (5.7 ± 0.1 (SD) µg/g; n = 4) was within the certified range
(5.6 ± 0.7 (± 95% confidence interval) µg/g). The ICP-MS detection limit for Se was 0.2 µg/L or
A
c
c
e
p
te
d
P
r
e
p
r
in
t
This article is protected by copyright. All rights reserved
limit used for water analysis. All organism [Se] are reported on a mass and dry weight basis for
better general comprehension and water chemistry in molar units.
RESULTS AND DISCUSSION
Selenium concentrations in natural planktonic food chains
Selenium concentrations in the members of planktonic food chains, composed of
microplankton (< 64 µm), copepods and Chaoborus (Figure 2), were highly correlated with the
sum of dissolved Org-Se and Se(VI) concentrations in lakewater (Figure 2A,B,C). No
correlations were observed (P ˃ 0.05) between Org-Se concentrations alone (that is, without
Se(VI) concentrations) and [Se] in copepods or microplankton (Supp. Data, Figure S1). These
results suggest that both Org-Se and Se(VI) drive Se accumulation in these planktonic food
chains (Figure 2). Of these two Se species, Org-Se concentrations predicted most of the
variability in Chaoborus [Se] among lakes (Figure 2; Supp. Data, Figure S1; Ponton and Hare
2013). Kelly Lake (Figure 1) differed somewhat from the other lakes in that adding Se(VI)
concentrations (solid triangle in Figure 2A,B,C) to Org-Se concentrations (solid square in Figure
2A,B,C) over-predicted [Se] in organisms from this lake. The high SO4 concentrations in this
lake (4 mM) likely competed with those of inorganic Se thereby reducing the accumulation of
inorganic Se species at the base of the food chain (Figure 2C; Ponton and Hare 2013; Fournier et
al. 2010; Morlon et al. 2006). To explain these trends seen in nature, we measured the influence
of Se speciation, SO4 and H+ on [Se] in the green alga Chlamydomonas reinhardtii.
Influence of sulfate on the uptake of Se species by Chlamydomonas reinhardtii
We measured a [Se] of 225 µg/g (dw) in C. reinhardtii exposed to 63 nM (5 µg/L) of
Se(VI) for 12 h without the addition of SO4 (dashed lines in Figure 3). This algal [Se] is very
A
c
c
e
p
te
d
P
r
e
p
r
in
t
This article is protected by copyright. All rights reserved
a SO4 concentration of 1.00 ± 0.06 µM (± SE) reduced this value by 50% (Figure 3A). This SO4
concentration is 16 times higher than the Se(VI) concentration, which suggests a higher affinity
of algal membrane transporters for Se(VI) than for SO4. This result contrasts with those obtained
for the bacterium Escherichia coli, which has a higher affinity for SO4 compared to Se(VI)
(Lindblow-Kull et al. 1985; Aguilar-Barajas et al. 2011). C. reinhardtii [Se] continued to
decrease up to the highest SO4 treatments (500 compared to 2000 and 4000 µM; inset in Figure
3A). Other studies on green algae (C. reinhardtii, Pseudokirchneriella subcapitata and Chlorella
spp.; Fournier et al. 2010; Vriens et al. 2016; Williams et al. 1994; Neumann et al. 2003,
respectively) have also reported competition between SO4 and Se(VI) at shared transporters. The
present study is the first to measure the influence of SO4 on Se(VI) uptake by a freshwater alga
over the wide range of SO4 concentrations encountered in mining regions (30 to 4,230 µM in the
present study lakes; Supp. Data, Table S1). These results suggest that the high SO4
concentrations measured in Lake Rouyn and Kelly Lake reduced Se(VI) accumulation in
planktonic organisms from those lakes.
When exposed to 63 nM Se(IV) without added SO4, [Se] in C. reinhardtii were 4 µg/g
dw (dashed line in Figure 3B). This [Se] is 56 times lower than that of algae exposed to Se(VI)
(225 µg/g dw; Figure 3A), which indicates that the uptake rates for Se(VI) are much higher than
those of Se(IV). These results agree with those from a field study in which, at low SO4
concentrations, Se(IV) was a less important contributor to Se bioaccumulation in lake plankton
than was Se(VI) (Ponton and Hare 2013).
In the laboratory, investigators have reported either greater bioaccumulation of Se(VI)
than Se(IV) by planktonic green algae (Neumann et al. 2003; Fournier et al. 2006; Simmons and
A
c
c
e
p
te
d
P
r
e
p
r
in
t
This article is protected by copyright. All rights reserved
(periphyton: Conley et al. 2013), or greater Se(IV) accumulation compared to Se(VI) (marine
phytoplankton: Hu et al. 1997; C. reinhardtii: Vriens et al. 2016; book review: Luoma and
Rainbow 2008). In the four cases that reported similar or higher bioaccumulation of Se(IV)
compared to Se(VI), SO4 was present in the exposure water. In some of these cases, only the
concentration of added SO4 was considered rather than the total including the initial SO4
concentration in the exposure medium. In these studies, investigators did not report competitive
effects of SO4 on Se(IV) (Vriens et al. 2016) or found higher Se accumulation when algae were
exposed to Se(IV) compared to Se(VI) (Hu et al. 1997; Luoma and Rainbow 2008; Vriens et al.
2016). In fact, Chlamydomonas reinhardtii exposed to high SO4 concentrations (>10-4; Figure 3)
accumulate less Se when exposed to Se(VI), as opposed to Se(IV), as has been reported in other
investigations conducted in seawater or at high SO4 concentrations (Hu et al. 1997; Luoma and
Rainbow 2008; Vriens et al. 2016). These inorganic Se species are likely to be taken up less
readily by marine algae because of the very high SO4 concentrations in seawater (28 mM; Hu et
al. 1997) compared to those in fresh waters. For example, SO4 concentrations in seawater are
seven times those measured in Kelly Lake (4 mM) in which the uptake of inorganic Se species is
already low compared to lakes with low SO4 concentrations (Ponton and Hare 2013). Of the two
inorganic Se species, Se(IV) would thus contribute more to lake food chain Se when SO4
concentrations are high, probably because of the high adsorption capacity of Se(IV) (Li et al.
2015) compared to Se(VI) (Chan et al. 2009).
Neither selenomethionine pre-exposure nor the concentrations of either SO4 or phosphate
influenced selenomethionine uptake by C. reinhardtii (data not shown). This result suggests that
A
c
c
e
p
te
d
P
r
e
p
r
in
t
This article is protected by copyright. All rights reserved
Se (see section Temporal patterns of Se uptake by Chlamydomonas reinhardtii in the presence of
sulfate).
Influence of pH on the uptake of Se species by Chlamydomonas reinhardtii in the absence of sulfate
Se(VI) accumulation was not significantly influenced over the pH range that we tested
(Figure 4A). Although high H+ concentrations can alter the surface charge of cells and increase
the uptake of Se(VI) anions by terrestrial plants (Kinraide 2003), pH did not influence the uptake
of Se(VI) in the present study. Since the acidity constant of Se(VI) (pKa = 1.9) falls outside of
the pH range that we tested (7 to 9), pH induced protonation of Se(VI) could not have influenced
uptake of this Se species.
In contrast to Se(VI), pH related changes in the speciation of Se(IV) influenced Se uptake
by C. reinhardtii. We measured a significant (P < 0.05) pH effect on Se accumulation by C.
reinhardtii (Figure 4B) following 12 h of exposure to 63 nM Se(IV). In contrast, two other
studies on this algal species reported no clear influence of pH on Se(IV) accumulation (Morlon
et al. 2006 (pH 5-8); Riedel and Sanders 1996 (pH 5-9)). The pH effect that we measured can be
explained by the fact that Se(IV) speciation changes markedly as pH increases from 7 to 9, since
the protonated form (HSeO3-) is progressively replaced by the deprotonated form (SeO32-) up to
pH 8.4 (pKa) at which point ~50% of each Se(IV) species is present (thermodynamic calculation
using MINEQL+; Schecher and McAvoy 1992). Our results suggest that this alga’s anionic
transporters may have a much higher affinity for the deprotonated form of Se(IV), that is SeO32-,
such that concentrations of this Se(IV) species are highly correlated with those of C. reinhardtii
[Se] (Figure 4B) at a constant total Se(IV) of 63 nM. Greater bioavailability of the deprotonated
A
c
c
e
p
te
d
P
r
e
p
r
in
t
This article is protected by copyright. All rights reserved
species (-1) and thus has greater electrostatic attraction to anionic transporters in biological
membranes. At pH 9, Se(IV) accumulation was five times higher than at pH 7 (Figure 4B). This
phenomenon can be important in natural systems where Se is present mainly as Se(IV), as well
as where pHs are high, such as in oceans (pH 8.2) or downstream from water bodies such as
Kelly Lake and Lake Rouyn that have been treated with lime to neutralize acidic effluents
(Lemly 2004; Ponton and Hare 2013). Although the Se(IV) concentration was constant in our
experiment, in nature, Se(IV) concentrations could increase with increasing pH because of its
tendency to adsorb to particles at acidic pH (Lemly 2004; Ponton and Hare 2013), which would
also favor Se uptake of SeO32-. Those results, and the evidence that at high SO4 concentrations,
Se(IV) uptake is more important than Se(VI), suggest that in Lake Rouyn (high SO4
concentrations and high pH), Se(IV) uptake could be favored over that of Se(VI).
C. reinhardtii accumulated significantly more Se (P < 0.05) when exposed for 12 h to
selenomethionine at either pH 8.5 or 9.0 compared to that at pH 7.0 or 7.5 (Figure 4C). To
observe if this pH-related effect was, as for Se(IV), a consequence of the charge of the Se
species, we calculated the net Se-Met charge at different pHs. Se-Met uptake was highly
correlated with the charge of Se-Met, which changed as a function of the pH (Figure 4C). Se-Met
has two pKas, that is, 1.6 and 9.5 (ChemAxon website). At natural pHs from 4 to 7, the charge of
the molecule is neutral but gradually becomes more negative as the pH increases from 7 to 10
(Supp. Data, Figure S2). Again, as for Se(IV), higher pH could favor the uptake of Se-Met in
nature.
Temporal patterns of Se uptake by Chlamydomonas reinhardtii in the presence of sulfate
When exposed to selenomethionine for 4 days (Figure 5), [Se] in C. reinhardtii were
A
c
c
e
p
te
d
P
r
e
p
r
in
t
This article is protected by copyright. All rights reserved
3B). It took 30 h for the alga to reach a steady state in its [Se] when exposed to
selenomethionine, whereas it took only 12 h to reach a steady state when exposed to the two
inorganic species (Figure 5). Note that the apparent decline in algal [Se] when the alga was
exposed to Se(VI) (between 12 and 48 h) was likely caused by dilution due to algal growth. The
inorganic and Org-Se species also differed because there was an initial lag in the uptake of the
selenomethionine whereas this was not the case for the inorganic species (Figure 5). After two
days, the algae exposed to Org-Se had [Se] about three times higher than those exposed to the
inorganic Se species (Figure 5), which is explained in part by the fact that SO4 (100 µM) in the
exposure medium reduced the accumulation of the inorganic Se species (as shown in Figure 3)
but not that of Org-Se. Fournier et al. (2006) reported similar results for the same algal species
and the same SO4 concentrations (100 µM). In their study, selenomethionine uptake after 1 h was
much greater than with Se(VI) (16×) and Se(IV) (100×) at their lowest aqueous concentrations
tested (2530 nM). To explain the lag in Se accumulation by the alga when exposed to
selenomethionine we hypothesize that C. reinhardtii used a non-specific deaminase to use the
methionine from the Se-Met as a source of nitrogen (Munoz-Blanco et al. 1990). Munoz-Blanco
et al. (1990) showed that between 20 and 48 h, there was an important decline in L-methionine
concentrations in the C. reinhardtii growth medium and that algal growth was proportional to
this decline. We also observed a rise of C. reinhardtii [Se] during a similar time period (20 to 48
h; Figure 5). Se-Met deamination could have resulted in the formation of Se(IV) that would have
been absorbed. In fact, the [Se] of C. reinhardtii exposed to Se-Met after 30 h is similar to that
A
c
c
e
p
te
d
P
r
e
p
r
in
t
This article is protected by copyright. All rights reserved
Microplankton selenium accumulation in the laboratory
There was a substantial difference in the absolute [Se] measured in cultured C.
reinhardtii exposed to selenomethionine (4 µg/g dw at 63 nM; Figures 4C and 5) and those
measured in field microplankton (30 µg/g dw) where ambient Org-Se concentrations were lower
than 10 nM (Figure 2C). To investigate this large difference, we exposed microplankton (< 64
µm) collected from an uncontaminated lake to selenomethionine under the same exposure
regime that we used for C. reinhardtii. As expected from our field measurements, the steady
state microplankton [Se] (Figure 6) was ~30 times higher than that attained by C. reinhardtii
(Figures 4 and 5). This result suggests that the difference we measured between C. reinhardtii
[Se] in the laboratory and those in field microplankton are not explained by a difference in the
species of organic Se to which algae are exposed (selenomethionine rather than selenocysteine)
but by the types of organisms that make up field microplankton community.
To explain this difference between algae in the laboratory and field-collected
microplankton, we identified the algae in our samples of field microplankton and found that 80%
of the biovolume was composed of Chrysophyceae, Dinophyceae, Euglenophyceae and
Cryptophyceae (Supp. Data, Figure S3), whereas only 10% were green algae (Chlorophyceae, of
which C. reinhardtii is a part). Baines and Fisher (2001) reported that some of the algal groups
that were important in our microplankton samples (Dinophyceae and Cryptophyceae) accumulate
higher [Se] in the laboratory than do many others. Another second major difference between the
laboratory algal cultures and field microplankton was that bacteria were absent in the former
whereas in our field samples they were more numerically abundant than were algae, that is,
15,500 ± 3,580 bacterial cells/µL compared to 2.5 algae cells/µL (n = 3). Bacteria are reported to
A
c
c
e
p
te
d
P
r
e
p
r
in
t
This article is protected by copyright. All rights reserved
2004). When expressed as cell volumes, there was no significant difference between bacterial
and algal biovolumes in our field microplankton (1.6×10⁶ ± 0.4×106 µm3/µL and 1×106 µm3/µL).
However, in terms of surface area, bacteria in our microplankton samples greatly exceeded algae
(30,000 ± 7000 versus 1,150 µm2/µL, respectively), which suggests that the total number of
bacterial uptake sites may be much higher in number than those of algae. This factor may explain
the difference in Se accumulation between field microplankton samples and C. reinhardtii. We
conclude that Se uptake in nature varies among taxa, since organic Se uptake by the green alga
C. reinhardtii is 30 times lower than that of microplankton composed of several algal types and
bacteria exposed to the same Se-Met concentration (63 nM).
Field-collected microplankton took up less Se (35 µg/gdw; Figure 7) than did C.
reinhardtii (225 µg/g) when exposed to 63 nM Se(VI) (without added SO4). The lower uptake of
Se by microplankton than by algae when exposed to Se(VI) without sulfate also suggested that a
low proportion of green algae was present in the lake microplankton. A SO4 concentration of 0.2
µM (10-6.7 M) reduced microplankton Se(VI) accumulation by 50% (Figure 7), whereas the
comparable value for C. reinhardtii was 1 µM, which suggests a higher affinity of Se(VI) for this
alga’s Se transporters than for those of lake microplankton. At the highest SO4 concentration (4
mM) tested, the microplankton [Se] (~5 µg/g) was higher than those measured in C. reinhardtii
exposed to Se(VI) (< 0.2 µg/g) (Figure 3A).
When exposed to Se(IV) for 12 h in the laboratory (without added SO4), the
microplankton [Se] was 51 µg/g (Figure 7) which was much higher than that of C. reinhardtii (4
µg/g). In contrast to our results obtained with C. reinhardtii, we measured no significant
A
c
c
e
p
te
d
P
r
e
p
r
in
t
This article is protected by copyright. All rights reserved
results with natural microplankton suggest again that Se(IV) uptake is less influenced by SO4
concentrations than Se(VI) uptake is.
Estimation of Se concentrations in field plankton from modeled parameters
We used our laboratory data to estimate [Se] in indigenous planktonic organisms.
Because Se accumulation by microplankton better represented field values than did that of C.
reinhardtii, we used the data from our microplankton Se exposures in the laboratory as input to
the equation below (modified from Presser and Luoma 2010). Steady state [Se] in microplankton
or particulate organic matter ([Se]microplankton; µg/g) can be expressed as:
[Org Se] 63 Se(VI) ) 63 . 0 4 . 5 ( ] Se(IV) [ Se (Org-Se) ) 43 . 0 ( (IV) ton microplank 4 kd e SO kd (1)where kd(IV) and kd(Org-Se) are partition coefficient constants (L/Kg) obtained from our
measurements of uptake by microplankton of dissolved Se(IV) and Org-Se, respectively. The kd
for these two Se species were obtained by dividing the steady state microplankton [Se] exposed
to Se(IV) (Figure 7; mean = 0.633 x 10⁶ nmol/Kg dw) or to selenomethionine (Figure 6; 1.38 x
106 nmol/Kg) by the dissolved [Se] in the exposure medium (63 nM). The calculated kd for
Se(IV) (kd(IV)) was 1.01 x 10⁴ L/Kg whereas the kd for selenomethionine (kd(Org-Se)) was 2.19 x 10⁴
L/Kg. In the Se(VI) term of equation 1 (second term), the kd (kd(VI)) was replaced by the equation
for the curve presented in Figure 7 (which includes the competitive effect of SO4 on Se(VI)
uptake) divided by the dissolved [Se] (63 nM). These high kds (especially for Org-Se) obtained
from our laboratory experiments are similar to the one calculated from Figure 2C (3.4 x 10⁴ ± 1.3
x 104 L/Kg; ± SD; n = 12) and those reported for sites in California (Salton Sea Estuary, 1.74 x
A
c
c
e
p
te
d
P
r
e
p
r
in
t
This article is protected by copyright. All rights reserved
Bay, Fujian Province, China and are among the highest cited in the literature review of Presser
and Luoma (2010).
Using equation 1, along with the estimated values of the partition coefficient constants
(equation 1), the concentrations of the three Se species and SO4 concentrations in lakewater
(Ponton and Hare 2013; Supp. Data, Table S1), we estimated field microplankton [Se] from each
lake. To estimate copepod [Se], we multiplied the estimated values obtained for microplankton
by the trophic transfer factor (TTFcopepods = [Se]copepods/[Se]microplankton) of 1.0 ± 0.7 (± SD; n = 12;
Supp. Data, Figure S4A). Note that this TTF value for copepods is similar to that reported by
Presser and Luoma (2010) for marine copepods (TTF of 1.35). We then multiplied the estimated
copepod [Se] by the TTF of Chaoborus ([Se]Chaoborus/[Se]copepods), which is 0.6 ± 0.2 (±SD; n =
13; Supp. Data, Figure S4B), to obtain the estimated Chaoborus [Se] from each lake. This TTF
value for Chaoborus is somewhat lower than those for other predators (0.8 and 1.5; Presser and
Luoma 2010). These consumer-prey relationships were highly significant at P < 0.01 (Supp.
Data, Figure S4).
Estimated Chaoborus [Se] are in good agreement with those measured in the field, as
indicated by the similarity of the regression line to the 1 to 1 line in Figure 8. Note that this
model takes into account many independent measurements that could have large uncertainties
and therefore careful application and interpretation are needed. Comparing the contributions of
the three Se species to the predicted microplankton [Se] (equation 1), and extrapolating up the
food chain to Chaoborus larvae, suggests that the majority (74 ± 19 %) of the Se accumulated by
the food chain is explained by the dissolved Org-Se concentrations in lakewater. Our model
predicted that dissolved Se(VI) concentrations do not explain any (0 ± 1 %) of the Se
A
c
c
e
p
te
d
P
r
e
p
r
in
t
This article is protected by copyright. All rights reserved
concentrations are very low in our lakes (Supp. Data, Table S1), microplankton accumulated less
Se when exposed to Se(VI) than Se(IV) and Se(VI) uptake only was influenced by SO4 in the
laboratory (Figure 7). In contrast, Se(IV) explains 26 ± 19 % of the predicted Chaoborus [Se].
Figure 8 shows that model predictions are improved by considering Se(IV) along with
Org-Se accumulation, especially for the highly contaminated lakes Rouyn (2010 and 2011) and
Kelly (2011). This result appears to contradict the trend in Figure 2 where considering Se(VI)
and not Se(IV) improved the prediction of Se accumulation in nature. This apparent
contradiction could be the result of a difference in plankton community composition between the
lakes located in mining areas and the microplankton we collected from Lake Bedard as well as
the fact that in Lake Rouyn (high pH and high SO4 concentrations), Se(IV) uptake could have
been higher than Se(VI) uptake, as suggested by our laboratory results.
CONCLUSION
The results of our study suggest that caution should be used when extrapolating from
measurements of Se uptake by single algal species to the complex phytoplankton communities
present in the field. Furthermore, the influences of SO4 and pH on Se uptake by algae and
bacteria need to be considered. Overall, organic Se appears to be the main Se species responsible
for Se uptake by plankton in oligotrophic Canadian Shield lakes impacted by mining activities.
Of the two inorganic Se species, Se(IV) uptake will be favored over Se(VI) in either high pH or
high SO4 environments. At low SO4 concentrations and low pH, Se(VI) uptake could be more
important than Se(IV) uptake for the same dissolved [Se].
Supplemental Data—The Supplemental Data are available on the Wiley Online Library at DOI:
A
c
c
e
p
te
d
P
r
e
p
r
in
t
This article is protected by copyright. All rights reserved
Acknowledgment—We thank A. Crémazy for assistance on algae exposures, A.
Przytulska-Bartosiewicz for algae identification and Y.W. Chen and N. Belzile for their help with Se
speciation measurements. We are also thankful to M. Rosabal, N. Fabien-Ouellet and A. Clerqc
for their assistance in the field. The present study was supported by the Natural Sciences and
Engineering Research Council of Canada.
Data Availability—Electronic supplemental data are available on the Wiley Online Library.
Please contact the corresponding author (Dominic.ponton@umontreal.ca) for unpublished data
A
c
c
e
p
te
d
P
r
e
p
r
in
t
This article is protected by copyright. All rights reserved REFERENCES
Aguilar-Barajas E, Díaz-Pérez C, Ramírez-Díaz MI, Riveros-Rosas H, Cervantes C. 2011.
Bacterial transport of sulfate, molybdate, and related oxyanions. BioMetals 24:687–707.
Baines SB, Fisher NS. 2001. Interspecific differences in the bioconcentration of selenite by
phytoplankton and their ecological implications. Mar. Ecol. Prog. Ser. 213:1–12.
Baines SB, Fisher NS, Doblin MA, Cutter GA, Cutter LS. 2004. Light dependence of selenium
uptake by phytoplankton and implications for predicting selenium incorporation into food webs.
Limnol. Oceanogr. 49:566–578.
Baines SB, Fisher NS, Doblin MA, Cutter GA. 2001. Uptake of dissolved organic selenide by
marine phytoplankton. Limnol. Oceanogr. 46:1936–1944.
Besser JM, Canfield TJ, Lapoint TW. 1993. Bioaccumulation of organic and inorganic selenium
in a laboratory food chain. Environ. Toxicol. Chem. 12:57–72.
Bowie GL, Sanders JG, Riedel GF, Gilmour CC, Breitburg DL, Cutter GA, Porcella DB. 1996.
Assessing selenium cycling and accumulation in aquatic ecosystems. Water, Air and Soil
Pollution 90:93–104.
Carter JCH, Kwik JK. 1977. Instar succession, vertical distribution, and interspecific competition
among four species of Chaoborus. J. Fish. Res. Board Can. 34:113–118.
Chan YT, Kuan WH, Chen TY, Wang MK. 2009. Adsorption mechanism of selenate and
selenite on the binary oxide systems. Water Res 43:4412–4420.
Chen YW, Zhou M, Tong J, Belzile N. 2005a. Application of photochemical reactions of Se in
natural waters by hydride generation atomic fluorescence spectrometry. Anal. Chim. Acta
A
c
c
e
p
te
d
P
r
e
p
r
in
t
This article is protected by copyright. All rights reserved
Chen YW, Zhou XL, Tong J, Truong Y, Belzile N. 2005b. Photochemical behavior of inorganic
and organic selenium compounds in various aqueous solutions. Anal. Chim. Acta 545:149–157.
Conde JE, Sanz Alaejos M. 1997. Selenium concentrations in natural and environmental waters.
Chem. Rev. 97:1979–2003.
Conley JM, Funk DH, Hesterberg DH, Hsu L, Kan J, Liu Y, Buchwalter DB. 2013.
Bioconcentration and biotransformation of selenite versus selenate exposed periphyton and
subsequent toxicity to the mayfly Centroptilum triangulifer. Environ. Sci. Technol. 47:7965–
7973.
Croteau MN, Hare L, Marcoux P. 2003. Feeding patterns of migratory and non-migratory fourth
instar larvae of two coexisting Chaoborus species in an acidic and metal contaminated lake:
Importance of prey ingestion rate in predicting metal bioaccumulation. Arch. Hydrobiol. 158:57–
74.
Cutter GA. 1978. Species determination of selenium in natural waters. Anal. Chim. Acta 98:59–
66.
Cutter GA. 1982. Selenium in reducing waters. Science 217:829–831.
Cutter GA, Bruland KW. 1984. The marine biogeochemistry of selenium – A re-evaluation.
Limnol. Oceanogr. 29:1179–1192.
Fortin C, Dutel L, Garnier-Laplace J. 2004. Uranium complexation and uptake by a green alga in
relation to chemical speciation: The importance of the free uranyl ion. Environ. Toxicol. Chem.
23:974−981.
Fournier E, Adam-Guillermin C, Massabuau JC, Garnier-Laplace J. 2006. Selenium
bioaccumulation in Chlamydomonas reinhardtii and subsequent transfer to Corbicula fluminea:
A
c
c
e
p
te
d
P
r
e
p
r
in
t
This article is protected by copyright. All rights reserved
Fournier E, Adam-Guillermin C, Potin-Gautier M, Pannier F. 2010. Selenate bioaccumulation
and toxicity in Chlamydomonas reinhardtii: influence of ambient sulphate ion concentration.
Aquat. Toxicol. 97:51–57.
Hare L, Carter JCH. 1987. Zooplankton populations and the diets of 3 Chaoborus species
(Diptera, Chaoboridae) in a tropical lake. Fresh. Biol. 17:275–290.
Hare L, Tessier A, Croteau MN. 2008. A biomonitor for tracking changes in the availability of
lakewater cadmium over space and time. Hum. Ecol. Risk Assess. 14:229–242.
Hillebrand H, Dürselen C, Kirschtel D, Pollingher U, Zohary T. 1999. Biovolume calculation for
pelagic and benthic microalgae. J. Phycol. 35:403–424.
Hu M, Yang Y, Martin J, Yin K, Harrison PJ. 1997. Preferential uptake of Se(IV) over Se(VI)
and the production of dissolved organic Se by marine phytoplankton. Mar. Environ. Res.
44:225–231.
Kinraide TB. 2003. The controlling influence of cell-surface electrical potential on the uptake
and toxicity of selenate (SeO42–) Physiol. Plant. 117:64–71.
Lemly AD. 1993. Teratogenic effects of selenium in natural fish populations of freshwater fish.
Ecotoxicol. Environ Saf. 26:181–204.
Lemly DA. 2004. Aquatic selenium pollution is a global environmental safety issue. Ecotoxicol
Environ. Saf. 59:44–56.
Li Z, Man N, Wang S, Liang D, Liu J. 2015. Selenite adsorption and desorption in main Chinese
soils with their characteristics and physicochemical properties. J Soils Sediments 15:1150–1158.
Lindblow-Kull C, Kull FJ, Shrift A. 1985. Single transporter for sulfate, selenate, and selenite in
A
c
c
e
p
te
d
P
r
e
p
r
in
t
This article is protected by copyright. All rights reserved
Luoma SN, Rainbow PS. 2008. Selenium: dietary exposure, trophic transfer and food web
effects. In: Luoma SN, Rainbow PS, Eds, Metal contamination in aquatic environments: science
and lateral management. Cambridge University Press, Cambridge, U.K. pp 327–351.
Lustigman B, Lee LH, Weiss-Magasic C. 1995. Effects of cobalt and pH on the growth of
Chlamydomonas reinhardtii. Bull. Environ. Contam. Toxicol. 55:65−72.
Morlon H, Fortin C, Floriani M, Adam C, Garnier-Laplace J, Boudou J. 2005. Toxicity of
selenite in the unicellular green alga Chlamydomonas reinhardtii: Comparison between effects at
the population and sub-cellular level. Aquat. Toxicol. 73:65–78.
Morlon H, Fortin C, Adam C, Garnier-Laplace J. 2006. Selenite transport and its inhibition in the
unicellular green alga Chlamydomonas reinhardtii. Environ. Toxicol. Chem. 25:1408–1417.
Munoz-Blanco J, Hidalgo-Martinez J, Cardenas J. 1990. Extracellular deamination of L-amino
acids by Chlamydomonas reinhardtii cells. Planta 182:194 –198.
Neumann PM, De Souza MP, Pickering IJ, Terry N. 2003. Rapid microalgal metabolism of
selenate to volatile dimethylselenide. Plant Cell 26:897–905.
Ponton DE, Caron A, Hare L, Campbell PGC. 2016. Hepatic oxidative stress and metal
subcellular partitioning are affected by selenium exposure in wild yellow perch (Perca
flavescens). Environ. Poll. 214:608–617.
Ponton DE, Hare L. 2009. Assessment of nickel contamination in lakes using the phantom midge
Chaoborus as a biomonitor. Environ. Sci. Technol. 43:6529–6534.
Ponton DE, Hare L. 2015. Feeding behavior and selenium concentrations in yellow perch (Perca
flavescens). Environ. Sci. Technol. 49:7633–7640.
Ponton DE, Hare L. 2013. Relating selenium concentrations in a planktivore to selenium
A
c
c
e
p
te
d
P
r
e
p
r
in
t
This article is protected by copyright. All rights reserved
Presser TS, Luoma SN. 2010. A methodology for ecosystem-scale modeling of selenium. Int.
Environ. Assess. Manag. 6:685–710.
Presser TS, Ohlendorf HM. 1987. Biogeochemical cycling of selenium in the San Joaquin
Valley, California, USA. Environ. Manag. 11:805–821.
Reich HJ, Hondal RJ. 2016. Why nature chose selenium. ACS Chem. Biol. 11:821−841.
Riedel GF, Sanders JG. 1996. The influence of pH and media composition on the uptake of
inorganic selenium by Chlamydomonas reinhardtii. Environ. Toxicol. Chem. 15:1577–1583.
Saether OA. 1972. Nearctic and Palaearctic Chaoborus (Diptera: Chaoboridae). In: Das Zooplankton der Binnengewässer; Schweizerbart’sche Verlagsbuchhandlung. Stuttgart,
Germany, pp 257–304.
Schecher WD, McAvoy DC. 1992. MINEQL+: A software environment for chemical
equilibrium modeling. Comput. Environ. Urban 16:65–76.
Simmons DBD, Wallschläger D. 2011. Release of reduced inorganic selenium species into
waters by the green fresh water algae Chlorella vulgaris. Environ. Sci. Technol. 45:2165–2171.
Stewart AR, Grosell M, Buchwalter D, Fisher N, Luoma SN, Mathews T, Orr P, Wang WX.
2010. Bioaccumulation and trophic transfer of selenium. In: Chapman PM, Adams WJ, Brooks
ML, Delos CG, Luoma SN, Maher WA, Ohlendorf HM, Presser TS, Shaw DP, Eds, Ecological
assessment of selenium in the aquatic environment. CRC Press 2010, New York, USA, pp 93–
139.
US EPA. 2016. Aquatic life ambient water quality criterion for selenium – freshwater. 2016.
United States Environmental Protection Agency. Office of Water, Office of Science and
A
c
c
e
p
te
d
P
r
e
p
r
in
t
This article is protected by copyright. All rights reserved
Vriens B, Behra R, Voegelin A, Zupanic A, Winkel LHE. 2016. Selenium uptake and
methylation by the microalga Chlamydomonas reinhardtii. Environ. Sci. Technol. 50:711–720.
Wallschläger D, Feldmann J. 2010. Formation, occurrence, significance, and analysis of
organoselenium and organotellurium compounds in the environment. Metal Ions Life Sci. 7:319–
364.
Wang D. 1994. Loss of selenium in water samples at natural levels during storage. Microchim.
Acta 116:33–39.
Williams MJ, Ogle RS, Knight AW, Burau RG. 1994. Effects of sulfate on Se(VI) uptake and
toxicity in the green-alga Selenastrum capricornutum. Arch. Environ. Contam. Toxicol. 27:449–
453.
Young TF, Finley K, Adams W, Besser J, Hopkins WA, Jolley D, McNaughton E, Presser TS,
Patrick-Shaw D, Unrine J. 2010. What you need to know about selenium. In: Chapman PM,
Adams WJ, Brooks ML, Delos CG, Luoma SN, Maher WA, Ohlendorf HM, Presser TS, Shaw
DP, Eds, Ecological assessment of selenium in the aquatic environment. CRC Press 2010, New
A
c
c
e
p
te
d
P
r
e
p
r
in
t
This article is protected by copyright. All rights reserved
Figure 1. Map showing the location of Rouyn-Noranda (Quebec) and Sudbury (Ontario), Canada
(stars), and our study lakes in these regions. The locations of major smelters are represented by
chimneys.
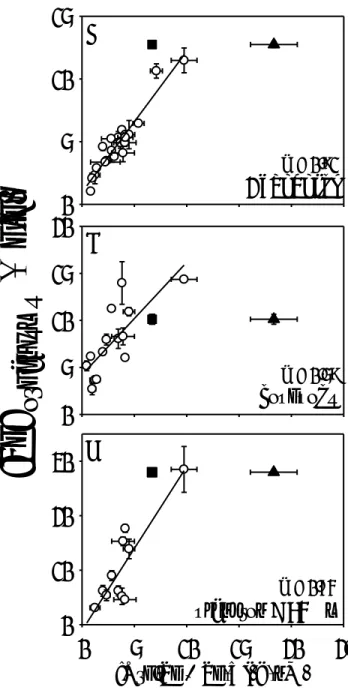
Figure 2. Relationships between Se concentrations (± SD; µg/g dry weight; n = 3-5) in
field-collected A: Chaoborus larvae (redrawn from Ponton and Hare 2013)); B: copepods; C:
microplankton (< 64 µm) and the concentrations of dissolved organic selenium (Org-Se) plus
Se(VI) (nM; n = 3). Triangles represents water Org-Se + Se(VI) concentrations and squares are
only water Org-Se concentrations. Data for Kelly Lake (solid symbols) were not included in the
regression. Regressions are significant at P = or ˂ 0.001.
Figure 3. Selenium concentrations in Chlamydomonas reinhardtii ([Se]C. reinhardtii; µg/g dry
weight) exposed for 12 h at a pH of 7.5 to 63 nM of either A: Se(VI) (means ± SD; n = 3) or B:
Se(IV) (n = 1) and at various concentrations of sulfate (log [SO4]; M). Dashed lines are C.
reinhardtii Se concentrations in treatments without added sulfate. Insert in panel A is Se uptake
at the highest sulfate concentrations. Curves of best fit have r2 > 0.99 and P < 0.001.
Figure 4. Mean (± SD, n = 3) selenium concentrations in Chlamydomonas reinhardtii ([Se]C.
reinhardtii; µg/g dry weight) exposed at various pHs (sulfate absent) for 12 h to 63 nM of either A: Se(VI), B: Se(IV) or C: selenomethionine. In B, the concentrations of the deprotonated Se(IV)
species (SeO32-, as calculated using MINEQL+) were varied by changing the pH of the exposure
solution (treatment pH is given above data points; the two dominant Se(IV) species are SeO32-
and HSeO3-; pKa = 8.4). In C, the selenomethionine negative charge is obtained from Supp. Data
Figure S2 and calculated from the pKas of 1.6 and 9.5 (treatment pH is given above data points).
A
c
c
e
p
te
d
P
r
e
p
r
in
t
This article is protected by copyright. All rights reserved
Figure 5. Selenium concentrations in Chlamydomonas reinhardtii ([Se]C. reinhardtii; µg/g dry
weight) exposed to 63 nM of either selenomethionine (solid squares), Se(IV) (open circles) or
Se(VI) (open triangles) for up to 100 h at a sulfate concentration of 100 µM and a pH of 7.5.
Values are means ± SD (n = 3) for selenomethionine (48, 72, 96 h), whereas those for Se(VI) and
Se(IV) are single samples. Both curves of best fit have r2 = 0.99 and P = 0.01.
Figure 6. Mean (± SD, n = 3) selenium concentrations of field-collected microplankton (< 64
µm; [Se]microplankton; µg/g dry weight) exposed for 0, 12 or 24 h to 63 nM of selenomethionine at a
sulfate concentration of 100 µM.
Figure 7. Selenium concentrations in field-collected microplankton (< 64 µm; [Se]microplankton;
µg/g dry weight; n = 1) exposed, at pH 7.5, to 63 nM Se(VI) (closed circles) or Se(IV) (open
triangles) at various sulfate concentrations.
Figure 8. Predicted selenium concentrations in Chaoborus larvae (µg/g dry weight) from 16
lakes as a function of predicted values (from equation 1) based on selenium concentrations in
lakewater (Ponton and Hare, 2013) and on laboratory measurements of Se uptake by
field-collected microplankton. Broken line is 1:1 relationship. Closed symbols are estimations
considering dissolved organic selenium (Org-Se) concentrations only and open symbols are
A
c
c
e
p
te
d
P
r
e
p
r
in
t
A
c
c
e
p
te
d
P
r
e
p
r
in
t
Figure 2: Ponton et al. 2018
0 5 10 15 20 25 0 10 20 30 0 5 10 15 20 0 5 10 15
Chaoborus
copepods
µplankton < 64 µm
A
B
C
[S
e]
or
gan
is
m
s
(
µ
g/g
)
[Org-Se + Se(VI)] (nM)
r2 = 0.74 r2 = 0.59 r2 = 0.91A
c
c
e
p
te
d
P
r
e
p
r
in
t
Figure 3; Ponton et al. 2018
0
50
100
150
200
250
[Se(VI)] = 63 nM [SO4] EC50= 1 µM-5
-4
-3
-2
0
2
4
6
[S
e]
C
. r
ei
nh
ar
dt
ii
(
µ
g/
g)
[Se(IV)] = 63 nM [SO4] EC50 = 0.15 µMlog [SO4
2-] (M)
-10
-8
-6
-4
-2
0
1
2
3
4
5
A
B
A
c
c
e
p
te
d
P
r
e
p
r
in
t
Figure 4; Ponton et al. 2018 pH 7.0 7.5 8.0 8.5 9.0
[S
e]
C. r
ei
nhar
dt
ii
(µ
g/
g)
0 50 100 150 200 7.0 [deprotonated Se(IV)] (nM) 0 10 20 30 40 50 60 0 5 10 15 20 25 7.5 8.0 8.5 9.0 9.0Se-Met negative charge
0.0 0.1 0.2 0.3 0 1 2 3 4 5 8.5 8.0 7.5 7.0 A B C
A
c
c
e
p
te
d
P
r
e
p
r
in
t
Figure 5; Ponton et al., 2018
Hours
0
20
40
60
80 100 120 140
0
1
2
3
4
5
Se-Met
Se(IV)
Se(VI)
[S
e]
C.
rei
nh
ar
dt
ii
(
µ
g/
g)
A
c
c
e
p
te
d
P
r
e
p
r
in
t
Figure 6; Ponton et al. 2018
Se-Met
Hours
0
5
10
15
20
25
30
[S
e]
mi
cr
op
la
nk
to
n
(
µ
g/
g)
0
20
40
60
80
100
120
A
c
c
e
p
te
d
P
r
e
p
r
in
t
Figure 7; Ponton et al. 2018
r2 = 0.96; p = 0.008
log [SO
42-] (M)
-10
-8
-6
-4
-2
[S
e]
mi cr op la nk to n(
µ
g/
g)
0
10
20
30
40
50
60
70
Se(IV) Se(VI)A
c
c
e
p
te
d
P
r
e
p
r
in
t
Figure 8; Ponton et al. 2018
Estimated [Se] Chaoborus (µg g-1)
0 2 4 6 8 10 12 14 16 Me ra su re d [S e]Ch ao bo ru s ( µ g g -1 ) 0 2 4 6 8 10 12 14 16 Org-Se Org-Se + Se(IV) RO11 RO11 KE KE RO10 RO10