R E S E A R C H
Open Access
Trees, fungi and bacteria: tripartite
metatranscriptomics of a root microbiome
responding to soil contamination
E. Gonzalez
1,2, F. E. Pitre
3,4, A. P. Pagé
5, J. Marleau
3, W. Guidi Nissim
6, M. St-Arnaud
3,4, M. Labrecque
3,4, S. Joly
3,4,
E. Yergeau
7and N. J. B. Brereton
3*Abstract
Background: One method for rejuvenating land polluted with anthropogenic contaminants is through phytoremediation, the reclamation of land through the cultivation of specific crops. The capacity for
phytoremediation crops, such as Salix spp., to tolerate and even flourish in contaminated soils relies on a highly complex and predominantly cryptic interacting community of microbial life.
Methods: Here, Illumina HiSeq 2500 sequencing and de novo transcriptome assembly were used to observe gene expression in washed Salix purpurea cv.‘Fish Creek’ roots from trees pot grown in petroleum
hydrocarbon-contaminated or non-hydrocarbon-contaminated soil. All 189,849 assembled contigs were annotated without a priori assumption as to sequence origin and differential expression was assessed.
Results: The 839 contigs differentially expressed (DE) and annotated from S. purpurea revealed substantial increases in transcripts encoding abiotic stress response equipment, such as glutathione S-transferases, in roots of contaminated trees as well as the hallmarks of fungal interaction, such as SWEET2 (Sugars Will Eventually Be Exported Transporter). A total of 8252 DE transcripts were fungal in origin, with contamination conditions resulting in a community shift from Ascomycota to Basidiomycota genera. In response to contamination, 1745 Basidiomycota transcripts increased in abundance (the majority uniquely expressed in contaminated soil) including major monosaccharide transporter MST1, primary cell wall and lamella CAZy enzymes, and an ectomycorrhiza-upregulated exo-β-1,3-glucanase (GH5). Additionally, 639 DE polycistronic transcripts from an uncharacterised Enterobacteriaceae species were uniformly in higher abundance in contamination conditions and comprised a wide spectrum of genes cryptic under laboratory conditions but considered putatively involved in eukaryotic interaction, biofilm formation and dioxygenase hydrocarbon degradation.
Conclusions: Fungal gene expression, representing the majority of contigs assembled, suggests out-competition of white rot Ascomycota genera (dominated by Pyronema), a sometimes ectomycorrhizal (ECM) Ascomycota (Tuber) and ECM Basidiomycota (Hebeloma) by a poorly characterised putative ECM Basidiomycota due to contamination. Root and fungal expression involved transcripts encoding carbohydrate/amino acid (C/N) dialogue whereas bacterial gene expression included the apparatus necessary for biofilm interaction and direct reduction of contamination stress, a potential bacterial currency for a role in tripartite mutualism. Unmistakable within the metatranscriptome is the degree to which the landscape of rhizospheric biology, particularly the important but predominantly uncharacterised fungal genetics, is yet to be discovered.
Keywords: Metatranscriptomics, Microbiome, Salix, Rhizosphere, Phytoremediation
* Correspondence:[email protected]
3Institut de recherche en biologie végétale, University of Montreal, Montreal, QC H1X 2B2, Canada
Full list of author information is available at the end of the article
© The Author(s). 2018 Open Access This article is distributed under the terms of the Creative Commons Attribution 4.0 International License (http://creativecommons.org/licenses/by/4.0/), which permits unrestricted use, distribution, and reproduction in any medium, provided you give appropriate credit to the original author(s) and the source, provide a link to the Creative Commons license, and indicate if changes were made. The Creative Commons Public Domain Dedication waiver (http://creativecommons.org/publicdomain/zero/1.0/) applies to the data made available in this article, unless otherwise stated.
Background
The observation of gene expression across multiple inter-acting organisms has the potential to better reflect the complex reality of biology than the observation of organ-isms in isolation [1]. By separating the assembly of RNA sequence data from annotation (identification) of assem-bled contigs, de novo metatranscriptome assembly allows for such observation without a prerequisite for, and there-fore bias from, reference genome sequences from organ-isms expected to be present within any biological system [2, 3]. A metatranscriptomic approach designed without constraint to any a priori defined organism, but open to annotation from any sequenced strata of life, should be powerful in biological systems already recognised as highly complex, such as the human digestive tract or rhizosphere microbiome (although such microbiome complexity could arguably be defined by the current extent of study in a biological field). Here, the rhizospheric microbiome of Salix purpurea cv. ‘Fish Creek’ was challenged using hydrocarbon-contaminated soil and differential gene expression observed.
Pervasive organic pollutants, such as polycyclic aro-matic hydrocarbons (PAHs), polychlorinated biphenyls (PCBs) and C10-C50 petroleum hydrocarbons, represent serious risk to human health and the environment [4]. There are thought to be greater than 400,000 contami-nated sites across North America [5, 6] and estimates are as high as 2.5 million sites across the EU [7]. Cur-rently, rehabilitation of such sites is constrained by the high costs (> 2 M$/ha, [8]) of standard restoration strat-egies such as excavation and transport (dig-and-dump), with the consequence that these sites are rarely restored. In recent decades, a consensus has grown that environmen-tally sustainable and economically viable land restoration methods should be developed; phytoremediation is one such green technology alternative [9,10]. Phytoremediation relies on the interaction between plants and their associated microorganisms to absorb, immobilise, volatilise, degrade, translocate or transform organic and inorganic contami-nants [11]. In trials across Canada, a wide range of fast growing short rotation coppice willow cultivars (Salix spp.) have been shown as highly tolerant to PAH, PCBs and other organic petroleum hydrocarbon contaminants [12], as well as inorganic contaminants [13]. While the societal, environmental and economic benefits of rehabilitating these sites can be extensive (estimated within Canadian metropolitan areas at 4.6–7 billion dollars annually [14]), an additional benefit of the use of crops such as willow is that the biomass yielded per hectare can also be utilised for several valuable end-uses, including lignocellulosic biofuels [15], renewable electricity and heat generation [16], as well as green phytochemical production. Cultivation of biomass is often seen as the most substantial hurdle for economic-ally feasible bioenergy production [17–19]. By aligning
feedstock production strategy with land decontamination, cultivation can serve as a positive value-stream, in terms of the financial profit as well as a clear local environmental benefit [14].
To achieve effective success as a phytoremediation crop, willow is thought to maintain and exploit intim-ate symbiotic relationships with fungi. Roughly 6000 species of fungi from Glomeromycota, Ascomycota, and Basidiomycota have been categorised to date as mycorrhizal [20]. Recent research has explored the symbiotic interaction of arbuscular mycorrhizal fungi (AMF, endomycorrhizal fungi currently exclusively cate-gorised within Glomeromycota) with willow [13, 21, 22] although trees and shrubs such as willow are characteris-tically known for interacting with ectomycorrhizal (ECM) fungi when mature [20,23]. Such interactions are thought to be predicated on the exchange of nutrients from the fungi to the plant, in particular phosphate and nitrogen attained by the fungi from soils, and a highly controlled amount of sugars exchanged from the plant to fungi. However, the comprehensive identification of fungi from an extra-laboratory environment, let alone delineating their roles in a complex biological system, is confounded by culturing difficulty and that, of the estimated 1.5 mil-lion fungal species, less than 600 have been currently (2016) sequenced and annotated (JGI MycoCosm [24]).
The peril of confounding bacterial community assess-ment by culturing methodology alone is also widely acknowledged, but the progression of contemporary sequencing techniques and extensive research advance-ment driven by fields relating to the human microbiome has led to an understanding of the ubiquitous, exceed-ingly diverse, presence and involvement of bacteria in eukaryotic biology. The importance of bacteria to mycor-rhizal fungi and/or plant health has been established even in conditions less challenging than anthropogenic soil contamination [25–28]. Bacteria whose presence and function is beneficial to mycorrhizal fungi and/or plants are often termed mycorrhizal helper bacteria MHB [29, 30] or plant growth-promoting bacteria (PGPB), such as the recently identified Enterobacter sp. 638, recognised as improving poplar growth on chal-lenging marginal soils by up to 40% [31]. In relation to the rhizosphere, the highly complex environment has been very well reviewed by Bonfante et al. [20] as compris-ing ‘tripartite’ interactions between plants, mycorrhizal fungi and bacteria. The distinction between the potential roles of bacteria within the rhizosphere, in terms of the level of host interaction (rhizospheric, extracellular inter-acting or intracellular) and the spectrum of interaction type (pathogeny, symbiosis or commensalism), is prob-lematic; however, metagenomics and metatranscriptomics can help to unravel this complexity by allowing gene func-tion to be observed.
Here, all the RNA assembled de novo from roots of 12 willow trees, pot-grown in either contaminated or non-contaminated soil from a former petroleum refinery, was annotated and differential gene expression from any and all organisms identified was explored to see if the func-tionality of a successful phytoremediation system can be elucidated.
Methods
Contamination composition, experimental design and sampling
Both contaminated and non-contaminated soils were gathered from the site of a former petrochemical re-finery at Varennes, Canada. Contaminated soil had an average C10-C50 petroleum hydrocarbon concentration of 912 mg kg− 1 (non-contaminated soil was below detection limit: < 100 mg kg− 1). Salix purpurea cv. ‘Fish Creek’ cuttings were established for 8 weeks in conven-tional potting media before being transferred to 20-l pots containing treatment soil within a larger experi-ment consisting of six blocks where randomised con-tamination effect was investigated (further soil and experimental information available from Yergeau et al. [27]). Growth conditions were 16 h 20 °C day and 8 h 18 °C night with excess watering and individual plant pot saucers to reduce leeching. After 6 months of growth, roots were harvested from six replicate trees per growth condition; soil was removed manually and roots samples were flash frozen in liquid nitrogen within 5 min of the initial perturbation.
RNA extraction and Illumina sequencing
A modified CTAB protocol [32,33] was used to extract RNA from roots with quality and quantity assessed using a BioAnalyser (Agilent, Mississauga, ON, Canada). Roots from 12 trees were sequenced: 6 from trees cultivated in contaminated soil and 6 from non-contaminated soil. Polyadenylated mRNA was amplified using Ambion’s MessageAmp™ II aRNA Amplification Kit. Amplified RNA was tested for genomic DNA content by PCR, using 18S rRNA gene primers and conditions described in Stewart et al. [34]. Indexing of cDNA samples for sequencing was performed in accordance with Meyer and Kircher [35]. The samples were sequenced (four separate runs) using an Illumina HiSeq 2500 platform.
De novo metatranscriptome assembly and differential expression
Trimmomatic [36] was used to trim nucleotides of poor quality and reads < 40 bp were removed. Reads from all 12 biological samples were assembled into a de novo transcriptome using Trinity software set to default pa-rameters [3]. Assembled contigs shorter than 200 bp were discarded. Bowtie2 [37, 38] was used to align the
RNA-seq reads back to the de novo transcriptome with -a -X 600 parameters on top of default parameters. Low count contigs, below 29 total counts across all libraries, were filtered out (corresponding to those contigs below the 80th percentile [39]). Read back-mapping rates were an average of 64.91% across all 12 root samples. Raw and normalised transcript abundance (tpm) was calcu-lated using eXpress [40] with default parameters. Differ-ential expression (DE) was estimated using EBSeq based on median normalisation [41] and on an empirical Bayes model framework [42, 43], keeping contigs with a pos-terior probability of differential expression (PPDE)≥ 0.95 (with target false discovery rate controlled at 5%). EdgeR [44] was used to generate MA plots based on trimmed mean of M-values normalisation method [45]. Extended quality control, assembly and normalisation information is provided in Additional file 1, and scripts are provided in Additional file2.
Annotation
The metatranscriptomic (unconstrained) annotation strategy, which queries a broad range of protein sequence repositor-ies, was performed as outlined by Gonzalez et al. [46]. Briefly, the de novo assembled contigs were annotated using three major protein databases (nr NCBI non-redundant pro-tein database, SwissProt and TrEMBL) as well as the S. pur-purea 94006 reference genome. During the informed annotation step, Populus trichocarpa reference genome was also added. UniProt Archive (UniParc) database was used to protein blast differentially expressed (DE) contigs that did not have a hit in any of the databases. NCBI nucleotide data-base was used to nucleotide blast all DE contigs. E values < 10−4(protein blast) and < 10−6(nucleotide blast) were used as cutoffs. A previously reported method for selecting anno-tation (based on the percentage of maximum potential bit-score) from blastx returns was used to help select the primary annotation given multiple high scoring alignments for a single sequence, all statistically characterised as non-random [2]. BLAST hits that were not selected but have a high comparable percentage of maximum potential bitscore (within 10%) were retained for each contig as (alternative) secondary annotation. Custom scripting (in Python, R, Shell, Javascript) and Krona [47] were used to generate images and figures (Additional file2).
Transdecoder
To find coding regions within bacterial polycistronic sequences, we used TransDecoder software (https:// transdecoder.github.io/). Protocol was followed accord-ing to the manual with default parameters. Precedence of transcriptional unit structure (putative operons) was verified in all cases against the database of prokaryotic operons (DOOR [48]) unless otherwise stated. A final hand curation step was included.
Interrogation of unknown contigs
Further annotation was undergone for contigs with no hit on any database. Nucleotide blast was carried out using non-coding RNA database (NONCODE2016 from www.noncode.org), Salix purpurea 94006 gen-ome, and NCBI ESTs database.
Results and discussion
Assembly, mapping and annotation
A total of 189,849 confident contigs were confidently as-sembled de novo from 456,182,049 sequence reads. Overall, 125,151 contigs (66%) were confidently annotated as poten-tial protein encoding transcripts, but 64,698 contigs (34%) had no protein homologue in SwissProt, Trembl or nr databases and are referred to as unknown henceforth (a substantial number of these were DE and investigated in greater detail in Additional files 1 and 3). The annotated
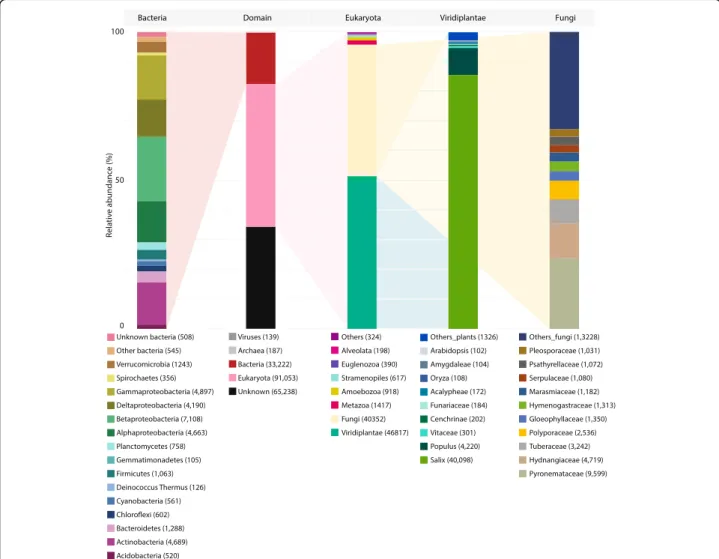
transcripts included 91,053 Eukaryota (48%), 33,222 Bac-teria (18%), 187 Archaea (0.01%) and 139 viral sequences (0.01%; including the common Illumina spike) (Fig. 1). Transcripts best annotated from eukaryotes were, as could be expected, mostly derived from Viridiplantae (46,817), although a close second was Fungi (40,352), with Metazoa (1417), Amoebozoa (918), Stramenopiles (617), Euglenozoa (390), Alveolata (198) and others (such as metagenomic or environmental samples) comprising only minor proportions of the transcript diversity (324).
Total community makeup
Comparative multi-omics analysis by Hultman [49] and Tveit et al. [50] has revealed some shortfalls in commu-nity assessment using internal transcribed spacer (ITS) and 16S ribosomal RNA (16S rRNA), even at the phylum level (discussed with additional Basidiomycota
Fig. 1 Total annotation. Annotation of the entire transcriptome assembly (including non-differentially expressed contigs). Bars representing Bacteria, Domain, Eukaryota, Viridiplantae and Fungi are selected as a useful overview of the diversity within the transcriptome. While bars represent data normalised to 100%, only ~ 65% of the sequenced reads were successfully mapped to the assembled transcriptome (so are overlooked here) and 34% of assembled contigs had no similarity to known sequences (so are again overlooked). Full annotation is provided in Additional file4and an interactive Krona of total annotation is avail-able at:https://github.com/gonzalezem/Tripartite_Metatranscriptomics_article
identification investigations in Additional file 1). Others have expressed even stronger scepticism, such as Bent et al. [51], who discussed the difficulties in providing reliable diversity indices from microbial fingerprinting method-ology [52–57]. An alternative, top-down approach is employed here which accepts uncertainty of the micro-biome community, assembling as many contigs as possible within the system and performing differential expression analysis on all retained contigs without any necessity for a priori sequence information before independent annota-tion using the world’s major protein repositories.
Transcripts clearly identified as deriving from Salix (the mass majority from the Salix purpurea 94006 gen-ome) made up 85.6% (40,098) of the contigs from plant species. While this was expected, it is perhaps more in-formative to recognise that 14.4% of plant transcripts were best annotated outside of Salix, mostly from the very close relative Populus (9.0%) but also from other genera (Vitaceae 0.6%; Cenchrinae 0.4%; Funariaceae 0.4; Acalypheae 0.4%; Oryza 0.2%; Amygdaleae 0.2%; Arabidopsis 0.2% and others 2.8%). This is roughly in line with previous research suggesting between 6 and 10% of Salix purpurea genes can be better identified by querying the broader protein repositories [2, 46] and that, importantly, over 10% of likely Salix gene expres-sion can be obscured by only mapping to a reference genome, even when species specific.
Extraordinary fungal diversity was found within the transcriptome. Although RNA was extracted from washed roots, this diversity is not surprising as the majority of plant species are thought to employ (widely diverse) below-ground fungal association in order to survive and compete in the biosphere [12, 58]. De novo sequencing provides a unique opportunity to observe such opaque below-ground genetics (Fig. 1, only fungal genera with over 1000 hits are presented, comprehensive annotation is provided in Additional file 4 and interactive Krona graphs). The fungal community comprised 40,352 distinct contigs by primary annotation, the majority were Pyrone-mataceae (23.8%), then Hydnangiaceae (11.7%), Tubera-ceae (8.0%), Polyporaceae (6.3%), Gloeophyllaceae (3.3%), Hymenogastraceae(3.3%), Marasmiaceae (2.9%), Serpula-ceae (2.7%), Psathyrellaceae (2.7%) and Pleosporaceae (2.6%) contigs as well as a very extensive quantity of others (13,228 contigs or 32.8%).
Bacterial diversity was extremely high, even at class level, with the 33,222 transcripts originating from Beta-proteobacteria (21.4%), Gammaproteobacteria (14.7%), Actinobacteria(14.1%), Alphaproteobacteria (14.0%), Del-taproteobacteria(12.6%), Bacteroidetes (3.9%), Verrucomi-crobia(3.7%) and Firmicutes (3.2%) as well as from other genera (Planctomycetes 2.3%; Chloroflexi 1.8%; Cyano-bacteria 1.7%; Acidobacteria 1.6%; uncharacterised bacteria 1.5%; Spirochaetes 1.1%; Deinococcus-Thermus
0.4%; Gemmatimonadetes 0.3%; others 1.6%). These bacterial contigs assembled from RNA extracted from roots very closely reflected the community reported in a previous experiment performed by Yergeau et al. [59] using 16S rRNA sequencing, where rhizospheric bacteria (from soil attached to roots), in association with the same willow cultivar grown in the same con-tamination, was also dominated by Betaproteobacteria (~ 39%) and Gammaproteobacteria (~ 38%). The au-thors used 16S rRNA sequencing to positively identify a wide spectrum of bacteria at the class level; while the meth-odology is not quantitatively comparable to that used here (Additional file 1), the proportions of the community makeup were roughly similar at a phylum and class level.
Differentially expressed contigs
Metaorganism patterning in gene expression
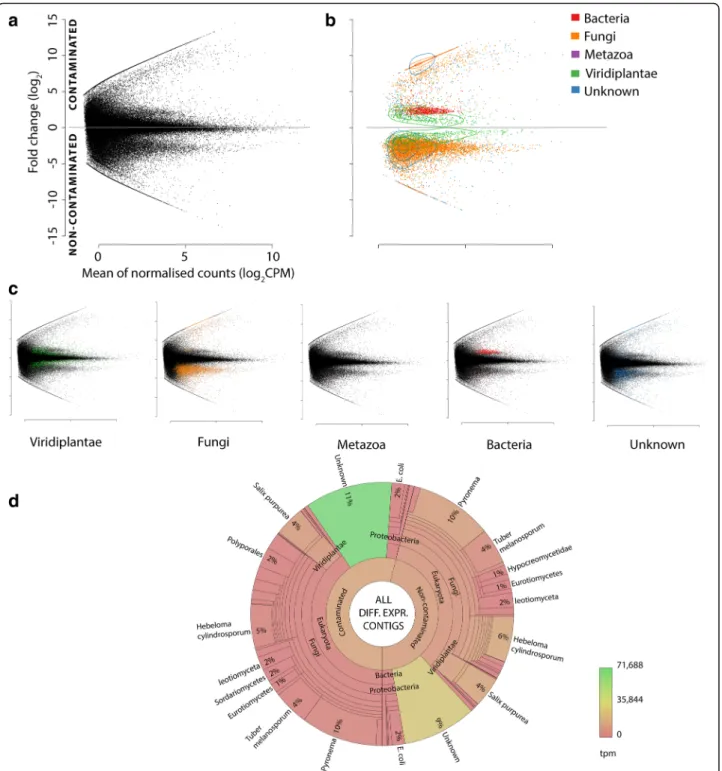
A total of 12,576 contigs were identified as DE between non-contaminated and contaminated soil conditions (Fig. 2). DE contigs (putative transcripts when annotated as protein encoding) may be responding directly to hydro-carbon toxicity or to environmental alterations due to the high soil concentrations of petroleum hydrocarbons, such as nutrient or water availability. Beyond this, differential expression could also be due to secondary responses representing the shift in the microbiome community or, indeed, expression of other organisms independent of the shift in community within the metaorganism. No se-quences were discarded based on annotation, especially since previous studies have demonstrated the potential for the removal of sequences (unexpected a priori) to bio-logically [60] and technically [2] confound data integrity and interpretation. The necessity for altering the paradigm of experimental approaches in light of a modern under-standing of metaorganismal complexity has recently been recognised as essential in mammals with respect to phenotypic assessment incorporating the microbiome [1]. In particular, bacterial DE sequences were retained for analysis (despite polyA enrichment prior to RNA-seq).
A substantial proportion of all the contigs assembled (including non-DE) were unknown (34%), bearing no confident homologous sequence in the major protein repositories. Although unknown sequences are often dis-carded, the strategy reported here very deliberately main-tains data where possible due to the potential for unknown DE sequences to represent novel organisms and functionality. Over 20% of the total DE sequences were in-deed unknown (Additional file 3); extended investigation into these sequences is discussed in Additional file1.
Pooling of highly complex gene expression data from non-model plants into ontology groups can give the impression of an overview of the biological system (GO terms are provided for query Additional file 4);
Fig. 2 Origin of differentially expressed contigs. MA plots (a–c) of de novo assembled transcriptome; y-axis represents fold change (FC, log2) between
contaminated (+ive) to non-contaminated conditions (−ive), and the x-axis represents mean normalised (EdgeR) counts per million (log2CPM). Plot a all
contigs (including non-DE) and b DE contigs only; coloured by annotation including contours to represent contig density relative within each group. c Individual MA plots of differentially expressed (DE) contigs annotated from Viridiplantae, Fungi, Metazoa, Bacteria and Unknown (no known similar sequences) are included for clarity. Data patterning from contamination-driven shifts in the community are observable (a) prior to any annotation. An epsilon factor is added in place of zero abundance where contigs are present in only one condition to allow visualisation and abundance comparison (as fold change would be infinite); the presence or absence of contigs (due to contamination) is biologically informative. d All DE contigs represented within a Krona graph [47]; the proportion of each taxonomic grouping is defined by the number of distinct contigs, whereas the colour represents the relative abundance (transcripts per million, tpm) of transcripts in each taxon. An interactive Krona graph to assist navigation of DE contig annotation origin is available at:https://github.com/gonzalezem/Tripartite_Metatranscriptomics_article. A full contig list including expression information, annotation (1° and 2°) and gene ontology is provided in Additional file4whereas DE only contigs are provided in Additional file9
however, an attempt to explore DE function at a tran-script level across all the organisms within the samples is presented here.
Salix purpurea
A total of 839 DE contigs were annotated as Salix pur-purea, representing 6.7% of all DE contigs from roots. The number of contigs up (45%) or down-regulated (55%) was similar in response to contamination (Figs.2and3). Des-pite the strain/cultivar studied here (S. purpurea ‘Fish Creek’) being the same species as that of the sequenced reference genome, S. purpurea 94006, 131 contigs (which we presume originate from Salix) were better annotated from other plant species. This is consistent with another study suggesting (top-down) de novo strategies can cap-ture more sequence variation than mapping to a single non-clonal reference genome alone [2]. Although the diversity of Salix DE contigs was relatively low within the system, with the exception of the unknown, they had the highest relative abundance (analysed as transcripts per million, TPM); perhaps unsurprisingly, given RNA was sampled from washed Salix roots.
Direct detoxification/stress responsesThe expectations for plant gene expression within a high hydrocarbon-contaminated environment would include an increase in
cytochrome P450 monooxygenases. Out of 26 DE tran-scripts identified as encoding cytochrome P450 family pro-teins, 18 were in higher abundance within control roots (cultivated in non-contaminated soil) (Additional file 5). Only two were annotated as putative monooxygenases (c585325_g1_i1 and c601406_g5_i2), with one upregulated and one downregulated with respect to contamination. An-other expected set of stress-induced detoxification equip-ment, known to be transcript abundance dependent, are glutathione S-transferases (GSTs), which catalyse glutathi-one conjugation to a broad range of xenobiotics in order to facilitate vacuolar loading (compartmentalisation of cellular pollutants). Only a single GST was downregulated in roots from contaminated soil, with 13 upregulated (8 tau class, including GSTU19, 37, 48 and 50) at consistently high rela-tive abundance levels (tpm) (Fig.2and Additional file5).
UDP-glucose:flavonoid 7-O-glucosyltransferase was the most abundant upregulated Salix gene in contaminated roots (c600230_g5_i1; 216.94 tpm), and two other putative isoforms were also highly upregulated (c600230_g5_i2, 90.71 tpm; c600230_g6_i1, 52.53 tpm; Fig.2).
Such increases in flavonoid glucosyltransferase ex-pression represent a common conjugation mechanism in plant detoxification metabolism [61]. Alternatively, UDP-glucose:flavonoid 7-O-glucosyltransferase, which allows symbiotic interaction with microorganisms in
Fig. 3 Salix purpurea differential expression (DE) transcript distribution and abundance (transcripts per million, tpm) weighted fold change (log2).
Top: fold change (FC log2) distribution of DE genes contaminated (black) and non-contaminated (gold). Bottom: mean transcript counts (tpm)
difference between conditions against fold change per DE contig. The highly abundant transcripts discussed within the text are labelled. A full DE transcript list including expression data, functional description (if available), gene ontology terms (if available) and secondary annotation (if available) is provided in Additional file5. PIP plasma membrane intrinsic protein (aquaporin), GST glutathione S-transferase
Glycine max [62], can be limiting for vacuolar loading of the isoflavone conjugates, and the corresponding conjugate-hydrolysingβ-glucosidase is localised to the plant root apoplast, intriguing in terms of the exten-sive interaction with microbes evidently ongoing within the roots.
Apart from the UDP-glucose:flavonoid 7-O-glucosyltr ansferase and glutathione transferases, the most highly expressed DE transcripts in contaminated roots were aquaporins and dehydrin. This could be expected given petroleum hydrocarbon contamination is likely to reduce access to water and thus induce osmotic stress in roots. Three PIP1.1 transcripts (c483320_g1_i2, 125.11 tpm; c589371_g5_i4, 88.10 tpm; c589371_g5_i8, 30.63 tpm), three PIP2.1 (c599604_g6_i1, 79.73 tpm; c576656_g7_i3, 70.73 tpm; c599604_g8_i6, 4.23) and PIP2.7 (c60220 3_g2_i9, 21.70 tpm) were all highly abundant in contam-inated conditions. Beyond a direct plant response to soil conditions, it has long been known that root-associated fungi, particularly ECM fungi, can improve not only nutrient uptake in trees, but also water [63–65]. It is interesting to note, in light of subsequent fungal gene expression, that extreme PIP upregulation has previously been observed as induced by the ECM fungi Amanita muscaria in fine ectomycorrhized roots of poplar (a close relative of Salix, sharing macrosynteny) [66] as well as in Salix by the AMF Rhizophagus irregularis [22].
Nitrogen and carbohydrate transport Five amino acid transporters were DE, two in higher abundance in non-contaminated trees and three in non-contaminated trees. Two were distinct cationic amino acid transporters, one in higher abundance in non-contaminated conditions (c598534_g2_i3, 6.65 tpm) and one higher in contami-nated conditions (c584679_g1, 18.25 tpm). Another of the transcripts higher in contaminated conditions (c594518_g1_i1) was most similar to AAP6 in poplar (87% identity, blastn e-value = 7e-29), and the two remaining transporters (one in higher abundance in each condition) were both similar to vacuolar amino acid transporter 1. AAP6, an acidic and neutral amino acid transporter known to be expressed in roots, is distinctive in having high substrate affinity (so could potentially be relevant to low amino acid concentration uptake) as well as having an affinity for aspartate [67]. Seven nitrate/ peptide transporters where DE with six in higher abun-dance in contaminated conditions, sharing close hom-ology with poplar NPF (NTR/PTR family) 5.4, 3.1 and 5.2 proteins. Alongside PIP expression, these are hall-marks of root symbiosis [68] in terms of differential expression and are thought to represent oligopeptide im-port of AM- and ECM-packaged nitrogen, the principal fungi to plant facet of resource exchange.
In terms of potential concomitant plant to fungi exchange of resources, differential expression of a puta-tive sucrose transporter (c582330_g6_i4) with high abundance in roots from contaminated soil was identi-fied, which would be expected if increased ECM inter-action were underway in these conditions. Three distinct trehalose-6-phosphate synthase transcripts were DE (c598745_g5_i1, c536396_g3_i1, c599008_g3_i2), all in higher abundance in roots cultivated in contaminate soil. While the role of trehalose synthesis in plants is some-what obscure [69], trehalose is the dominant storage carbohydrate in AMF hyphae and implicated in ECM abiotic stress tolerance [70,71], so expression here is in-triguing in light of concomitant fungal DE. Additionally, the sugar transporter SWEET2 (c555872_g1_i5) was in higher abundance in roots from contaminated soil. SWEETs (Sugars Will Eventually Be Exported Trans-porter) have only been identified relatively recently [72] but have already been strongly implicated in plant-fungal interactions [73], including Solanum tuberosum roots colonised by AMF [74]. In Arabidopsis, SWEET2 has been shown to accumulate in root hairs, cap and epidermis, and in cells in close contact with the rhizo-sphere [75]. Interestingly, the authors suggest that SWEET2 functions as a bidirectional glucose transporter that could control glucose secretion through limitation/ vacuolar loading as part of highly complex and co-ordinated interactions with rhizospheric microbes.
Community associationThe most abundant downregu-lated contigs in Salix roots from non-contaminated soil encoded two distinct organ-specific S2 proteins (Fig.2).
While these proteins are of unknown function, they have been found to be downregulated in a Medicago truncatula 1-deoxy-d-xylulose 5-phosphate synthase 2 (catalysing the beginning of the MEP pathway) knock-down, which also reduced AMF colonisation of roots [76]. An acidic endochitinase (EC 3.2.1.14, c583738_g7_i2) was upregulated in contamination-treated roots. While this would intuitively be associated with plant defence against pathogenic fungi, a number of studies have found that this endochitinase can encourage symbiotic association with ECM fungi, such as Hebeloma, Suillus, Wilcoxina, Piso-lithus, Paxillus and Amanita with spruce, birch and Eucalyptus; the suggested mode of action being that non-fungi-damaging apoplastic chitinase modifies ecto-mycorrhizal elicitors to facilitate symbiotic interaction [77–80]. When considered alongside the preceding data, Salix root DE reflects plant recognition of foreign molecular patterns [81], the non-recognition impact of effectors [82] as well as alterations in nutrient exchange and water availability known to be drastically altered by fungal interactions [65].
Fungi
Division by taxonomy Fungi represented the kingdom with the most diverse genetic response to contamination within the root samples, being the annotation source of the 8252 distinct DE contigs. The paradigm of direct up vs down-regulation collapses when multiple organisms and natural biological complexity are acknowledged in sequencing studies (when the dynamic nature of the metagenome is considered [2]), as the presence of an organism can vary as well as gene expression within or-ganisms. Therefore, DE contigs can represent direct or indirect responses to treatment within a given organism of stable presence (with respect to treatment), including responses to highly diverse, changeable and potentially hostile biological environment, but also represent baseline transcription and metabolism of newly present, absent, growing or diminishing organisms within the system. The contigs annotated as fungal had very distinct patterning in relation to contamination; of the contigs present in both conditions, 88.8% (6184 contigs) had higher abundance in non-contaminated trees while, in contrast to this, of the contigs only present in trees of one condition, 96.3% (1239 contigs) were in contaminated conditions (Figs. 2b, c; 4a and 5). These expression patterns, even before investigating gene function, can be interpreted as a general downregulation of constitutive fungal expression due to contamination and the arrival of a distinct, contamination specific, set of expressing genes potentially representing a shift in community makeup. By comparison, only seven Salix DE contigs were expressed in only trees of a single condition.
The two Ascomycota species most represented within DE transcripts were the closely related Pyronema omphalodes (a saprophyte) and Tuber melanosporum (an ECM fungi) (Fig. 4b and Additional file 6). These species both domi-nated fungal differential expression and had high enough levels of primary annotated contigs (2303 contigs and 1077 contigs) to merit very confident identification of these species, or of close relatives, within the system. Transcript levels were almost all more abundant within roots of non-contaminated trees (94.1 and 98.4% for P. omphalodes and T. melanosporum, respectively). While an alteration in gene expression in response to hydrocarbon conditions is pos-sible, the extremity of polar expression might also suggest a lower abundance for these organisms due to the impact of contamination stress and/or increased competition from more contamination-tolerant life forms. Tuber has been previously identified as associated with Salix [83,84]; non-constitutively expressed ECM high-abundance markers were DE in Tuber and were indeed in higher abun-dance in non-contaminated conditions, such as RAS protein (c594475_g3_i1) [85], implying successful Tuber ECM interaction was underway in non-contaminated con-ditions but was suppressed by hydrocarbon contamination.
Unlike Ascomycota, Basidiomycota expression was dy-namic with respect to contamination, as 1639 contigs annotated from three closely related species (from the Agaricoidfamily’s Hymenogastraceae and Strophariaceae [86]) Heboloma cylindrosporum (an ECM fungi), Galer-ina margGaler-inata (predominantly white rot) and Hypho-loma sublateritium (white rot) were downregulated, while 1745 contigs, with a highly distinctive expression pattern, were upregulated but broadly annotated from 61 genera (Fig. 4c and Additional files 6 and 7). These upregulated contigs were distinctive in the extreme di-versity of annotation origin and as the majority (71%) were present only in roots from contaminated soil. To investigate the origin of these phytoremediation respon-sive contigs, and provide additional evidence towards their species of origin, we explored the species diversity of equally good hits using ‘secondary annotation’ [2] (Fig. 4d; Additional file 1) as well as using nucleotide blastn (a strict blastn reduces observation of fungal data by 99.5%, Additional file8).
Secondary annotation By utilising secondary annota-tion, the retention of equally (statistically)‘good’ annota-tion hits, all 12,576 DE contigs can be more confidently assigned to an organism of origin by elucidating any ambiguity in annotation which is often overlooked. The set of 1745 Basidiomycota genes most often had second-ary annotation from known ECM (such as Scleroderma citrinum and Paxillus involutus) and saprophytes (such as Pleurotus ostreatus and Trametes versicolor), in agree-ment with the current awareness that the continuum of mutualism is complex [87]. Very little crossover was ob-served between Basidomycota and Ascomycota in terms of differential expression due to contamination response, as Basidomycota extensively dominated the increased expression in response to contamination conditions (Fig.4a–d). Secondary annotation provides an additional benefit in terms of mining useful functional description from across the world’s major data repositories (Additional files 2, 3, 4, 5, 6, 7, 8 and 9), but it is also interesting to note that retention of secondary annotation independently reflects classical Basidio-mycota phylogeny ([86]; Fig. 4d) (albeit with a crude thresholds limiting data retention to only the very closest homologues), particularly interesting is if this idea is considered in the context of the 189,839 total annotated contigs that include 491,505 secondary annotation (Additional file 4).
An important take home message here, when querying unknown sequences using BLAST, is the benefit of not taking the single top returns as fact. Pertsemlidis and Fondon [88] have detailed how differentiating proteins of high homology from BLAST scoring system should be performed with caution and others have outlined the
extensive risk of confounding biological interpretation by not acknowledging the uncertainty of annotation [2]. Sec-ondary annotation of Basidiomycota was spread widely across Agaricomycotina for upregulated contigs whereas downregulated contigs (> 95%) derived from a specific Agaricoid clade comprising the three closely related gen-era (Hypholoma, Galerina and Hebeloma) (Fig.4c) which,
understandably, shared the majority of secondary an-notation with each other (Fig. 4d). For the distinct, upregulated Basidiomycota, secondary annotation revealed no dominant source of annotation (hom-ology) to our contigs within Agaricomycotina (more detailed sequence origin investigation is presented in Additional files 1 and 8).
(See figure on previous page.)
Fig. 4 Taxonomy of fungal differential expression and secondary annotation. MA plots of de novo assembled transcriptome; y-axis represents fold change (FC, log2) between contaminated (+ive) to non-contaminated conditions (−ive), and the x-axis represents mean
normalised (EdgeR) counts per million (log2CPM). Contours representing relative DE contig density. a DE contigs annotated from fungi
with Ascomycota (red) and Basidiomycota (blue), b DE Ascomycota contigs with genera annotating > 20 contigs highlighted and c DE Basidiomycota contigs with genera annotating > 20 contigs highlighted. d Secondary annotation of each DE fungal contig illustrating alternative, equally valid annotation [2] from other species (presented as genera for clarity). Genera with correspondences > 20 are presented and coloured by DE direction (more abundant in contaminated roots = black; more abundant in non-contaminated roots = gold). Agaricles phylogeny (an order of Agaricomycetes) is provided to visualise expression profiles against relatedness, with clade II (Pluteoid), IV (Marasmoid), V (Tricholomatoid) and VI (Agaricoid) structure (taken from Matheny et al. [86]). An interactive chord diagram and Krona graph to assist more comprehensive navigation of taxonomy and fungal secondary annotation are available at:
https://github.com/gonzalezem/Tripartite_Metatranscriptomics_article. A full fungal DE contig list including expression information, annotation (1° and 2°) and gene ontology is provided in Additional file6whereas a full list of Basidiomycota DE contigs upregulated in roots of contaminated trees is provided in Additional file7
Fig. 5 Basidiomycota differential expression (DE) transcript distribution, abundance (transcripts per million, tpm) weighted fold change (log2) and contigs present in only one condition. Top: fold change (FC log2) distribution of DE genes contaminated (black) and
non-contaminated (gold). Middle: mean counts (tpm) difference between conditions against fold change per DE contig. The highly abundant transcripts discussed within the text are labelled. A full DE transcript list including expression data, functional description (if available), gene ontology terms (if available) and secondary annotation (if available) is provided in Additional file7. MST monosaccharide transporter, AMT ammonium transporter, PMP3 plasma membrane proteolipid 3. Bottom: contigs present in only one condition (termed infinity genes in Additional files)
Upregulated Basidiomycota function Given that the intricacy, or perhaps futility, in differentiating between sap-rophytes and ECM fungi has been well discussed [89,90], determining the fungal mode of action from expression study is problematic [91] and is further confounded by the generally accepted belief of multiple ECM evolutionary events in Basidiomycota ([92]). The scale of mycorrhizo-spheric complexity is very high; once DE genes have been sub-selected as best annotated from fungi (keeping in mind that 2575 DE contigs were unknown, having no known sequence similarity), further sub-selected based on Basidio-mycotaannotation and even further sub-selected based on response to contamination (just those contigs in higher abundance in contaminated conditions), 1745 DE-annotated transcripts remain to describe potential functionality (driven by positive expression) within the system. Of these 1745 DE transcripts, 70% (1227 con-tigs) had unknown function and were annotated as hypothetical, predicted, putative or uncharacterised pro-teins from Basidiomycota species. These poor functional description terms are selected against during annotation if an equally good hit is available in secondary annotation, in practice re-mining any confident functional descriptions available within the major protein data repositories.
In terms of recognisable gene function, the most abun-dant fungal contig expressed in contaminated conditions was the relatively cryptic plasma membrane proteolipid 3 (Pmp3), best annotated from Moniliophthora, with 301.42 tpm (c553133_g5_i1, 2128.20 FC) (Additional file7). The small hydrophobic Pmp3 (dissimilar to recognised hydro-phobin structure) has been characterised as highly con-served in fungi, is environmental stress induced (cryptic in yeast under standard laboratory conditions), involved in cytotoxic cation tolerance [93] and sphingolipid synthesis [94] so could be related to membrane integrity mainten-ance given the challenge of contamination conditions. Generally, the most highly expressed contigs within the group of distinctive Basidiomycota (Figs. 4cand 5) were not putatively related to hydrocarbon degradation but, in-stead, were related to classical association with plant roots and/or the highly upregulated bacteria (Enterobacteriaceae sp.), namely carbohydrate import, nitrogen (nitrate, am-monia and amino acid) metabolism and transport, and bacterial interaction. This could be expected in light of the hydrocarbon degradation mechanisms DE in the Entero-bacteriaceae sp. (outlined below) if the interaction did indeed involve some degree of tripartite mutualism.
Putative hydrocarbon degradation
Surprisingly none of the expected hydrocarbon de-grading monooxygenases were identified within the 1745 DE Basidiomycota contigs which increased in abundance due to contamination (Fig. 5, Additional file 7). Only three dioxygenase encoding contigs were identified as DE, all of which had relatively low abundance levels.
Two were poorly characterised dioxygenase family pro-teins (c596412_g1_i1, 8.78 tpm and c593762_g1_i1, 5.93 tpm), but one was a putative extradiol aromatic ring-opening dioxygenase (c598058_g2_i2, 4.23 tpm), func-tionality well recognised in bacterial PAH degradation studies [95–97] but less familiar in fungi. No lignin per-oxidases, manganase-dependent peroxidases (class II peroxidases) or laccases (with potential degradation functionality [26]) were identified as DE, expected if a ligninolytic (white rot) mode of action was underway, particularly as the associated enzyme secretion is highly dependent on transcript levels [91]. Two DE contigs, however, did encode glutathione peroxidase-like proteins (c591991_g1_i5, 8.78 tpm; c591991_g1_i10, 2.14 tpm), and one encoded a thioredoxin-dependent peroxidase (c565655_g1_i1, 48.94 tpm) were upregulated, although this is a common response to contamination-induced oxidative stress [98].
Carbohydrate transport and CAZy
One of most intuitive approaches to distinguish be-tween saprophitic and ECM ecological strategies (the most likely in Basidiomycota here) would be to compare the expression of genes for plant cell wall degradation and carbohydrate import mechanisms, although this is a non-trivial task [91]. For instance, the molecular mecha-nisms underpinning much of the carbon transfer to ECM fungi from plants is unclear; while there is strong evidence that up to 30% of the plant’s total photoassimi-lates can be transferred to ECM fungi [99], few hexose transporters have been experimentally validated. The monosaccharide transporter MST1 in both Amanita muscaria(fourfold upregulation during symbiosis [100]) and Laccaria bicolor [101] being the exception to this.
The third most abundant (275.43 tpm, Table 1) Basidiomycota DE contig positively responding to contamination was a probable monosaccharide trans-porter (c601571_g1_i1; equally well annotated from either Serendipita vermifera or Piriformospora indica, Additional file 7), as well as two similarly annotated putative isoforms (25.71 tpm and 18.19 tpm) (Fig. 5
and Table 1). This is especially noteworthy as Hynson et al. [102] detected potential ECM lineages within Ser-endipitaceae and because P. indica has been shown to stimulate plant growth, but the mechanics of the sym-biosis is somewhat cryptic (and can even cause plant cell death [103]). Interestingly, Zuccaro et al. [104] also found that this monosaccharide transporter was highly upregulated in Piriformospora indica and identified ex-pression as clearly associated with barley root biotroph-ism (as opposed to saprotropbiotroph-ism). The Saccharomyces cerevisiaehomologue (e-value = 5e−17, 67% identity) of this MST, the extracellular glucose sensor rgt2, is well studied as also having sensor functionality [99, 105]; however, given the extremely high relative abundance,
Table 1 Fungal carbohydrate metabolism and CAZy. EBSeq [42,43] was used to estimate posterior probability of differential expression (PPDE)≥ 0.95. A full DE transcript list including expression data, functional description (if available), gene ontology terms (if available) and secondary annotation (if available) is provided in Additional file6
Monosaccharide transporters Query id Cont mean
tpm
Treat mean tpm
FC 1° annotation id Subject description
c601571_g1_i1 0.33 275.43 830.24 gi|751683823|gb|KIM33975.1| Monosaccharide transporter (MST) c601571_g1_i3 0.00 25.71 High gi|751683823|gb|KIM33975.1| Monosaccharide transporter (MST) c601571_g1_i7 0.00 18.19 inf gi|749760949|gb|KII85851.1| Monosaccharide transporter (MST) CAZy
c601768_g1_i4 0.01 12.09 891.69 tr|A8N526|A8N526_COPC7 Exo-beta-1,3-glucanase (GH5) c601246_g1_i2 0.00 9.29 inf tr|S7QIL0|S7QIL0_GLOTA Glycoside hydrolase (GH13) c601246_g1_i3 0.00 8.75 inf tr|S7QIL0|S7QIL0_GLOTA Glycoside hydrolase (GH13) c601246_g1_i1 0.00 3.40 inf tr|S7QIL0|S7QIL0_GLOTA Glycoside hydrolase (GH13) c598537_g2_i2 0.00 20.09 inf gi|695542974|ref.|XP_009543687.1| Glycoside hydrolase family 13 protein c600093_g2_i1 0.00 2.50 inf gi|646308860|gb|KDQ30003.1| Glycoside hydrolase family 13 protein c598962_g2_i1 0.00 4.02 inf gi|691791220|emb|CDO73299.1| Glycoside Hydrolase Family 13 protein c546152_g1_i1 0.00 7.98 inf tr|F8PDS7|F8PDS7_SERL9 Glycoside hydrolase family 13/GT5 protein c594633_g1_i2 0.11 50.90 449.23 gi|751693072|gb|KIM43056.1| Glycoside hydrolase family 131 protein c569099_g1_i1 0.00 6.22 inf gi|595767974|ref.|XP_007262530.1| Glycoside hydrolase family 16 protein c601155_g2_i1 0.00 3.25 inf gi|751697951|gb|KIM47928.1| Glycoside hydrolase family 16 protein c601155_g2_i2 0.00 9.44 inf gi|751718111|gb|KIM67108.1| Glycoside hydrolase family 16 protein c601339_g1_i1 0.00 8.66 inf tr|M2QB49|M2QB49_CERS8 Glycoside hydrolase family 3 protein c594608_g1_i1 0.00 4.13 inf tr|S7Q7X9|S7Q7X9_GLOTA Glycoside hydrolase family 38 protein c601768_g1_i2 0.00 4.18 High gi|749771114|gb|KII95444.1| Glycoside hydrolase family 5 protein c601768_g1_i3 0.22 2.91 13.51 gi|749771114|gb|KII95444.1| Glycoside hydrolase family 5 protein c598880_g1_i5 0.04 104.28 2617.19 gi|660966484|gb|KEP50967.1| Barwin-like endoglucanase GH45 c600699_g2_i2 0.00 5.19 inf gi|761954826|gb|KIY74457.1| Glycoside hydrolase family 45 protein c600240_g5_i1 0.04 37.05 862.09 gi|597903192|ref|XP_007298895.1| Glycoside hydrolase family 72 protein c597573_g1_i2 0.00 4.93 inf tr|M2RHY3|M2RHY3_CERS8 Glycosyltransferase family 1 protein c601034_g1_i3 0.00 5.05 inf gi|751699172|gb|KIM49104.1| Glycosyltransferase family 15 protein c601818_g1_i1 0.00 6.08 inf tr|F8NSE4|F8NSE4_SERL9 Glycosyltransferase family 2 protein c601727_g2_i2 0.00 4.46 inf gi|646307867|gb|KDQ29011.1| Glycosyltransferase family 2 protein c602102_g1_i1 0.00 1.47 inf gi|749763786|gb|KII88520.1| Glycosyltransferase family 2 protein c602018_g4_i1 0.00 21.01 inf gi|761950386|gb|KIY70060.1| Glycosyltransferase family 20 protein c593342_g2_i1 0.00 33.59 inf gi|754372083|gb|KIP04804.1| Glycosyltransferase family 4 protein c586703_g1_i3 0.00 7.27 inf gi|751716241|gb|KIM65247.1| Glycosyltransferase family 48 protein c593828_g1_i1 0.00 4.05 inf tr|G4T6Z6|G4T6Z6_PIRID Pectate lyase 1
c576776_g1_i2 0.05 2.53 50.56 tr|R7SST1|R7SST1_DICSQ Galactose oxidase (AA5)
c594647_g2_i1 0.20 25.38 127.24 gi|752370879|gb|KIO28638.1| Carbohydrate esterase family 12 protein c592601_g1_i1 0.03 13.15 414.76 gi|749760957|gb|KII85859.1| Carbohydrate esterase family 4 protein c600395_g1_i1 0.00 3.82 inf gi|691792079|emb|CDO72533.1| Carbohydrate-binding module family 1/GH18 c600797_g1_i1 0.00 21.07 inf tr|V2WEI0|V2WEI0_MONRO Carbohydrate-binding module family 12 protein c600797_g1_i4 0.00 6.68 inf gi|695558353|ref.|XP_009547634.1| Carbohydrate-binding module family 12 protein c590812_g2_i2 0.00 7.48 inf gi|751000067|gb|KIK42253.1| Carbohydrate-binding module family 50 protein EM pathway
Table 1 Fungal carbohydrate metabolism and CAZy. EBSeq [42,43] was used to estimate posterior probability of differential expression (PPDE)≥ 0.95. A full DE transcript list including expression data, functional description (if available), gene ontology terms (if available) and secondary annotation (if available) is provided in Additional file6(Continued)
Monosaccharide transporters Query id Cont mean
tpm
Treat mean tpm
FC 1° annotation id Subject description
c596025_g1_i2 0.00 7.96 inf tr|S7Q9Q0|S7Q9Q0_GLOTA Glucokinase regulator c594601_g1_i2 0.00 13.43 inf gi|751180168|gb|KIL66119.1| Hexokinase c585806_g1_i1 0.02 18.89 1107.17 gi|646397316|gb|KDQ61522.1| Phosphoglucomutase c602057_g2_i2 0.00 11.14 High gi|646396300|gb|KDQ60552.1| Phosphoglycerate kinase c602057_g2_i3 0.07 11.10 151.91 tr|V2XST0|V2XST0_MONRO Phosphoglycerate kinase
c598088_g2_i2 0.00 5.55 inf gi|749895786|gb|KIJ63485.1| Phosphoglycerate mutase-like protein c600469_g2_i1 0.00 10.71 inf gi|749764415|gb|KII89090.1| Phosphoglycerate mutase-like protein c572773_g2_i1 0.00 51.66 inf gi|695531349|ref.|XP_009540596.1| Enolase
c596540_g1_i2 0.00 4.59 inf gi|646309757|gb|KDQ30900.1| Pyruvate kinase
c600228_g1_i1 0.00 15.88 inf A0A0C9X171|A0A0C9X171_9AGAR Fructose-1,6-bisphosphatase c600228_g2_i1 0.00 3.03 inf gi|807746795|ref|XP_012178192.1| Fructose-1,6-bisphosphatase Trehalose and glycogen metabolism
c593922_g1_i3 0.01 2.87 238.65 tr|A8NBB7|A8NBB7_COPC7 Trehalose-6-phosphate phosphatase c593922_g1_i2 0.01 1.75 233.45 tr|A8NBB7|A8NBB7_COPC7 Trehalose-6-phosphate phosphatase c590104_g1_i2 0.00 5.27 inf gi|576992104|gb|EUC64784.1| Alpha,alpha-trehalose-phosphate synthase c601514_g2_i2 0.00 8.92 inf gi|636619097|ref|XP_008040683.1| Glycogen phosphorylase
c601447_g1_i3 0.00 24.27 High tr|S7PZV3|S7PZV3_GLOTA Glycogen synthase c601447_g1_i4 0.02 5.34 267.52 tr|R7S2M9|R7S2M9_PUNST Glycogen synthase Pentose phosphate pathway
c599283_g2_i1 0.06 23.65 403.23 tr|S7QHH6|S7QHH6_GLOTA Glucose-6-phosphate 1-dehydrogenase c593556_g1_i1 0.00 4.43 inf tr|F8PCX3|F8PCX3_SERL9 6-Phosphogluconolactonase
c579299_g1_i2 0.00 4.57 inf gi|695543481|ref|XP_009543815.1| 6-Phosphogluconate dehydrogenase
c596260_g2_i1 0.00 6.07 inf tr|S7QN86|S7QN86_GLOTA 6-Phosphogluconate dehydrogenase, decarboxylating c599261_g6_i1 0.40 29.50 73.50 laccaria|B0DN26|B0DN26_LACBS Transketolase
c586684_g1_i2 0.00 9.94 inf gi|807755903|ref|XP_012182746.1| Transaldolase Ethanol
c595474_g1_i1 0.00 16.64 inf gi|754377558|gb|KIP10174.1| Pyruvate decarboxylase TCA cycle
c578376_g1_i1 0.00 20.05 inf tr|A8N9T7|A8N9T7_COPC7 Pyruvate carboxylase
c590892_g1_i1 0.00 16.91 inf gi|924125151|emb|CUA68456.1| Pyruvate dehydrogenase E1 component subunit alpha c602021_g6_i1 0.00 20.10 inf tr|D8PKQ0|D8PKQ0_SCHCM Acetyltransferase component of pyruvate dehydrogenase c569980_g1_i1 0.00 12.30 High tr|S8EDA9|S8EDA9_FOMPI ATP-utilising phosphoenolpyruvate carboxykinase c601865_g3_i1 0.00 21.12 inf tr|R7STC2|R7STC2_DICSQ ATP-utilising phosphoenolpyruvate carboxykinase c601865_g3_i2 0.00 9.71 inf tr|R7STC2|R7STC2_DICSQ ATP-utilising phosphoenolpyruvate carboxykinase c569980_g1_i2 0.09 16.00 168.90 gi|749767591|gb|KII92023.1| ATP-utilising phosphoenolpyruvate carboxykinase c596905_g1_i4 0.00 12.95 inf tr|F8ND69|F8ND69_SERL9 Malate dehydrogenase
c596978_g1_i2 0.01 18.99 1489.83 gi|599119246|ref.|XP_007387111.1| NAD-malate dehydrogenase c596978_g1_i1 0.01 13.56 1360.27 gi|599119246|ref.|XP_007387111.1| NAD-malate dehydrogenase
c601738_g1_i3 0.00 9.89 inf gi|751717279|gb|KIM66280.1| Succinyl-coa synthetase alpha chain, gdp-forming c600881_g1_i4 0.01 1.61 299.16 tr|M2RB43|M2RB43_CERS8 Succinyl-CoA synthetase beta chain SSC-beta c600756_g1_i1 0.00 11.35 inf gi|646392723|gb|KDQ57237.1| Homocitrate synthase
we would speculate high glucose import function as more likely to drive differential expression (due to increased transcript dependency of function). This prob-able monosaccharide transporter (c601571_g1_i1) is also similar to the abovementioned Laccaria bicolor MST1.3 (monosaccharide importer CAQ53118.1; lacbi1:301992, blastx e-value = 2e−21, 48% identity), whose crucial role in ECM glucose import is further supported by14C-labelled glucose trials which demonstrated not only strongly up-regulation during ECM formation when compared to extraradical mycelium expression but also strong evidence of substantial glucose import functionality [101]. Interest-ingly, in Laccaria bicolor, glucose uptake by MST1.3 was only very slightly affected by the presence of fructose (whereas uptake was inhibited by fructose in others, allow-ing for the possibility of sucrose hydrolysis at the rhizo-spheric interface). Alongside potential plant cell wall binding machinery, glucose import represents a highly expressed, recognisable function within the Basidomycota transcriptionally responding to contamination conditions and seems a credible candidate describing the currency of plant to fungi symbiosis with Salix roots.
Basidomycota carbohydrate active enzymes were identified as upregulated in response to contamination conditions, with the majority only expressed in contami-nated trees (only 9 contigs were also expressed in con-trol trees). Of these, 20 contigs belonged to one of nine glycosyl hydrolase (GH) families, eight contigs to one of six glycosyl transferase (GT) families and one contig was a pectin/pectate lyase (PL; pectate lyase 1). The most highly represented group was GH13, with seven contigs (5 distinct enzymes including 3 likely isoforms) including a
secreted alpha-amylase. It is possible that these may repre-sent extracellular invertase activity (sucrose hydrolysis) as opposed to native fungalα-glucan metabolism.
The most abundant CAZy contig (104.28 tpm) was a GH45 Barwin-like endoglucanase (expansin family pro-tein) (Table 1). Expansin domain containing proteins have previously been recognised in Laccaria bicolor as expressed only in ECM tissue [106], which is fascinating in light of the functional similarity to cell wall loosening in plants [107] and if considered in the context of non-necrosis inducing Salix root tissue remodelling and po-tential interaction with middle lamella and primary cell walls. In agreement with this, a carbohydrate esterase family 12 protein (putative rhamnogalacturonan acety-lesterase, pectin-related) [108] annotated only from the orchid symbiote Tulasnella calospora was DE. Further to this, a pectin/pectate lyase was also DE, recently iden-tified as one of the few cell wall-degrading enzymes retained by the ECM fungus Tuber melanosporum for cell wall remodelling of Corylus avellana as part of their symbiotic interaction [109]. The second most abundant CAZy was GH131 (best annotated from Hebeloma but with equally good hits in Plicaturopsis, Laccaria, Jaapia, Tulasnella and Gelatoporia), including a cellulose bind-ing module (CBM1) with broad β-glucanase activity. While this activity allows for the potential for saphytic action, remodelling of the plant cell wall and pro-gression through lamella is in agreement with ECM colonisation of plant roots towards the effective forma-tion of the hartig net [110] and, interestingly, GH131 has previously been identified as expressed in Jaapia argillacea as a potential adaption from saprotrophic
Table 1 Fungal carbohydrate metabolism and CAZy. EBSeq [42,43] was used to estimate posterior probability of differential expression (PPDE)≥ 0.95. A full DE transcript list including expression data, functional description (if available), gene ontology terms (if available) and secondary annotation (if available) is provided in Additional file6(Continued)
Monosaccharide transporters Query id Cont mean
tpm
Treat mean tpm
FC 1° annotation id Subject description
c601939_g2_i2 0.05 13.42 261.20 gi|754372092|gb|KIP04812.1| Isocitrate dehydrogenase c583773_g1_i1 0.00 5.65 inf gi|636616019|ref|XP_008039144.1| Peroxysomal citrate synthase c585571_g1_i2 0.03 2.64 81.61 gi|751696020|gb|KIM45999.1| Aconitase
c591611_g1_i1 0.00 10.96 inf gi|636618909|ref|XP_008040589.1| Aconitate hydratase
c575147_g1_i1 0.00 5.73 inf gi|597981973|ref|XP_007363646.1| 2-Oxoglutarate dehydrogenase mitochondrial precursor c597062_g1_i2 0.00 16.03 inf gi|749834860|gb|KIJ12495.1| Succinate dehydrogenase
c602048_g2_i2 0.00 5.52 inf gi|749830076|gb|KIJ08477.1| Succinate dehydrogenase c600915_g2_i1 0.07 13.16 190.79 tr|M2PCH1|M2PCH1_CERS8 Succinate dehydrogenase c600002_g1_i4 0.00 4.55 inf tr|D8Q9I2|D8Q9I2_SCHCM Fumarate reductase c600002_g1_i1 0.00 17.05 inf gi|752345450|gb|KIO04521.1| Fumarate reductase Leading to AAs
c601513_g2_i5 0.00 6.72 inf tr|M2PP80|M2PP80_CERS8 Glutamine sythetase c600930_g1_i1 0.00 9.88 inf tr|V2X687|V2X687_MONRO Glutamate synthase
ancestors [92]. Three GH5 contigs (exo-beta-1,3-glucanase) were also highly expressed including an ectomycorrhiza-upregulated exo-beta-1,3-glucanase [106,111]. In disagree-ment with this is the lack of identifiable lignases or maganase-dependent peroxidases necessary for deconstruc-tion of heavily lignified middle lamella as well as the differ-ential expression of galactose oxidase (AA5), a secreted extracellular catalyse which has twice as much activity on galactomannan (mannan backbone with galactose side-chains) compared to galactose [112], important given this very common hemicellulose component is more indicative of plant secondary cell walls [113].
In terms of the potential direct interface between the plant and putative ECM Basidiomycota, two Stereum hirsutumricin B-like lectins of the carbohydrate-binding module family 13 (CMB13) contigs were very highly abundant in treated conditions at 144.48 tpm (14th most abundant, 1350 FC) and 98.05 tpm (22nd most abun-dant, 350 FC). Interchangeable homologous hits were also found using secondary annotation within Heteroba-sidion, Fomitiporia and Jaapia. Lectin carbohydrate-binding is well documented as one of the means of intense binding at the interface between the ECM hartig net and the plant host cell wall [114, 115]. CMB13 has been shown to have specificity for backbone xylan (such as the majority of hemicellulose within willow root 2° root cell wall), although is also found in a diverse array of non-xylanase glycosyl hydrolases [116].
The metabolic machinery necessary as a downstream consequence of monosaccharide import (in light of very highly expressed MST) includes the Embden-Meyerhof (EM) pathway, pentose phosphate pathway and tricarb-oxylic acid cycle (Additional file7). Trehalose and glycogen metabolism within the EM pathway, clearly represented within DE contigs, are glycolytic pathways expected in ECM fungi [117]. Alpha,alpha-trehalose-phosphate syn-thase (TPS1), two trehalose-6-phosphate phosphatases (TPS2), two glycogen synthases, glycogen phosphorylase, glucokinase regulator, hexokinase, phosphoglucomutase, glucose-6-phosphate isomerase, two phosphoglycerate kinases, two phosphoglycerate mutase-like proteins, eno-lase, pyruvate kinase and two fructose-1,6-bisphosphatases were identified as DE and in higher abundance in root from contaminated soil. Within the pentose phos-phate pathway: glucose-6-phosphos-phate 1-dehydrogenase, 6-phosphogluconolactonase, two 6-phosphogluconate dehydrogenases, transketolase and transaldolase were also DE. While carbon was fated towards ethanol fermen-tation (pyruvate carboxylase was DE), the citric acid cycle was also comprehensively represented as upregulated: pyruvate dehydrogenase (E1 component subunit alpha; acetyltransferase component), four phosphoenolpyruvate carboxykinases, pyruvate carboxylase, three succinate dehydrogenases, two fumarate reductases, succinyl-coa
synthetase (alpha chain and beta chain), three malate de-hydrogenases, 2-oxoglutarate dehydrogenase, two homo-citrate synthases, two aconitate hydratases and isohomo-citrate dehydrogenase, supporting carbon scaffold assembly to-wards amino acid production.
Nitrogen management
This extensive representation of the citric acid cycle upregulated in Basidiomycota from contaminated condi-tions is relevant in the context of potential amino acid export to Salix roots, given very similar ECM expression profiles in ECM Laccaria and Tuber [118,119], and con-sidering the differential expression of contigs encoding glutamate synthase and glutamine synthetase (Table 1). Contigs encoding N-related transport machinery were highly expressed (Table 2), including two ammonium transporters, which were some of the most highly abun-dant Basidiomycota contigs present in the samples (AmtB, tpm 66.39; Amt1, tpm 64.18) as well as a very highly expressed contig encoding a putative FUN34-transmembrane protein involved in ammonia production (tpm 47.03). Additionally, a peptide/nitrate transporter, five amino acid transporters, a purine transporter, a glutathione transporter, two oligopeptide transporters (OPTs), two plasma membrane h+ symports, two mito-chondrial carriers as well as urease, amine oxidase, D-aspartate oxidase and two carbon-nitrogen hydrolases were upregulated, all enzymes involved in the reduction of organic nitrogen compounds and ammonia produc-tion (Addiproduc-tional file 7). This wide ranging selection of N-related compound transporters identified as DE very closely matched those previously reported in the ECM fungi Paxillus involutus [120] and Laccaria bicolor [121]. A broad suite of proteases was also DE including four endopeptidases (including subtilisin and bleomycin), two Zn-dependent exopeptidases, three carboxypeptidases (glutamate, serine and zinc), four metallopeptidases, a methionine aminopeptidase, two putative aminopepti-dase isoforms and two distinct aspartic peptiaminopepti-dase A1 (Table2). Secreted suites of proteases are thought to be similar between Basidiomycota saprotrophs and EMC [90]. However, the extracellular protein degradation path-ways identified here distinctly match those expressed in the EMC P. involutus [120]. One of the markers identified from Laccaria biocolor but recognised across ECM are Ras/Ras-like proteins [85, 122, 123], small GTPases in-volved in cargo sorting in coated vesicules [124] (vesicular turnover is thought to be high in ECM due nutrient and signal exchange with hosts [125]) that have been shown to increase in transcript abundance after successful establish-ment of symbiosis [126]. Eleven Ras-like proteins were DE and in high abundance in the phytoremediation respon-sive Basidiomycota, importantly including likely Ras, or Ras interacting, proteins known as host interaction-specific ECM markers identified in Laccaria [85]. These
Table 2 Fungal nitrogen-related DE genes from upregulated Basidiomycota. EBSeq [42,43] was used to estimate posterior probabil-ity of differential expression (PPDE)≥ 0.95. A full DE transcript list including expression data, functional description (if available), gene ontology terms (if available) and secondary annotation (if available) is provided in Additional file6
Query id Cont mean tpm
Treat mean tpm
FC 1° annotation id Subject description
c596378_g2_i3 0.14 66.39 477.06 gi|749759516|gb|KII84515.1| Ammonium transporter c596378_g2_i2 0.14 64.18 458.91 tr|Q8NKD5|Q8NKD5_HEBCY Ammonium transporter c599446_g2_i1 0.14 57.28 405.50 gi|660970957|gb|KEP54657.1| Rab GTPase family protein c555426_g1_i1 0.04 47.83 1162.00 gi|646294952|gb|KDQ16118.1| Small GTPase-binding protein c590384_g1_i3 0.36 47.03 130.17 tr|R7RZR8|R7RZR8_PUNST fun34-transmembrane protein of
ammonia production c597663_g1_i3 0.02 31.86 1277.49 tr|R7S8J0|R7S8J0_TRAVS Small GTPase-binding protein c576075_g1_i1 0.02 22.26 1356.92 gi|691790442|emb|CDO74199.1| Amino acid transporter c597663_g1_i1 0.01 20.67 2581.27 tr|V2X8E2|V2X8E2_MONRO Small GTPase-binding protein c596122_g2_i1 0.00 18.08 4389.38 tr|V2WTU3|V2WTU3_MONRO Plasma membrane h(+)-atpase 1 c592122_g2_i1 0.00 18.00 inf tr|S7PWC9|S7PWC9_GLOTA Mitochondrial carrier
c598258_g3_i1 0.00 16.68 inf gi|597977025|ref.|XP_007362384.1| Urease
c597755_g1_i1 0.00 16.37 inf gi|754376368|gb|KIP08998.1| Subtilisin-like serine protease pepC c601027_g2_i1 0.00 15.18 inf gi|660966237|gb|KEP50782.1| Serine carboxypeptidase c590409_g1_i1 0.00 13.93 inf tr|E2LF88|E2LF88_MONPE Oligopeptide transporter c602018_g3_i1 0.01 12.29 949.61 tr|R7S2N4|R7S2N4_PUNST Endopeptidase c601958_g7_i1 0.00 11.68 inf tr|M2R776|M2R776_CERS8 Aminopeptidase 2 c597846_g2_i1 0.01 11.17 1682.64 gi|695572973|ref|XP_009551472.1| Purine transporter
c598346_g1_i1 0.00 10.15 inf gi|807753175|ref.|XP_012181382.1| ATP-dependent metallopeptidase Hfl c596122_g2_i3 0.05 9.94 216.32 laccaria|A0A0C9XV60_9AGAR Plasma membrane ATPase
c600930_g1_i1 0.00 9.88 inf tr|V2X687|V2X687_MONRO Glutamate synthase c575280_g1_i3 0.00 9.72 inf tr|F8NRP9|F8NRP9_SERL9 Oligopeptide transporter c586208_g2_i4 0.00 9.42 inf gi|595766652|ref|XP_007261869.1| Small GTPase
c599446_g3_i1 0.00 8.68 inf tr|B0CRR7|B0CRR7_LACBS Ras-related protein Rab-5B c597351_g5_i3 0.05 8.59 185.55 tr|D8PW94|D8PW94_SCHCM Carbon-nitrogen hydrolase c600850_g1_i2 0.00 8.38 inf gi|751184086|gb|KIL70023.1| Aspartic peptidase A1 c591514_g1_i1 0.00 8.25 inf gi|597967903|ref.|XP_007360041.1| Ras protein
c600898_g1_i3 0.02 7.43 316.59 tr|M2RCY8|M2RCY8_CERS8 Zinc carboxypeptidase
c590849_g1_i2 0.00 7.23 inf gi|751185175|gb|KIL71111.1| Rab-type small GTP-binding protein c594481_g1_i1 0.00 7.10 inf uniparc|UPI000444A56C Amino acid transporter
c595033_g1_i1 0.00 7.06 inf tr|V2WPM3|V2WPM3_MONRO Ras GTPase-activating protein c596094_g1_i2 0.00 6.76 inf gi|695535578|ref|XP_009541732.1| Metallo peptidase M16B c601513_g2_i5 0.00 6.72 inf tr|M2PP80|M2PP80_CERS8 Glutamine synthetase c587799_g1_i1 0.00 5.74 inf laccaria|B0CVJ7|B0CVJ7_LACBS Aspartic peptidase A1 c583462_g2_i3 0.00 5.67 inf tr|A8N171|A8N171_COPC7 Glutathione transporter c570564_g1_i1 0.00 5.19 inf gi|827762056|gb|KLO16666.1| Zn-dependent exopeptidase c594381_g2_i2 0.00 5.13 inf gi|599097713|ref.|XP_007380030.1| Zn-dependent exopeptidase c600158_g1_i5 0.03 5.12 203.31 tr|F8NFV4|F8NFV4_SERL9 rab GDP-dissociation inhibitor c583177_g1_i2 0.00 4.84 inf gi|751693001|gb|KIM42985.1| Transmembrane GTPase fzo1 c600177_g1_i1 0.00 4.71 inf gi|914260206|gb|KNZ75358.1| Peptide/nitrate transporter
c601958_g3_i1 0.00 4.68 inf tr|M2R776|M2R776_CERS8 Aminopeptidase 2
comprised three highly abundant uncharacterised small GTPase-binding proteins (47.83 tpm, 31.86 tpm, 9.42 tpm), Rho1 (20.67 tpm), Ras-related protein Rab-5B, Ras protein, Rab-type small GTPase, Ras GTPase-activating protein, Rab GDP-dissociation inhibitor, GTPase foz1, Sar1-like protein member of Ras-family as well as an extremely highly expressed Rab5 (ypt5) GTPase family protein (57.28 tpm), involved in endocytotic vascular traf-ficking [127].
While a clear depth of functional detail can be revealed by metatranscriptomics, the majority of putative fungal proteins were uncharacterised (having no functionally characterised homologue), a useful reminder that the vast majority of the natural world remains to be explored.
Bacteria
Polyadenylation in bacteria Polyadenylation of RNA has long been known to occur in bacteria [128, 129]. Some studies have established the potential involvement of polyadenylation in mRNA degradation [130,131] and RNA quality control [132, 133] in a limited number of bacterial species, although the contemporary picture of polyadenylation in bacteria suggests complexity beyond this, as recently described by Kushner [134]. Using pulse-labelling, levels of polyadenylated RNA have been measured at up to 15% of RNA in Escherichia coli [135] (in contrast to those of up to 25% in gram-positive Bacillus brevis [136]) and more recent research using microarray analysis revealed, in an E. coli K-12 wild-type transcriptome, that 90% of transcribed ORFs underwent some degree of polyadenlyation [137].
Within the plant transcriptomic research community, bacterial mRNA is routinely discarded during early quality control of common bioinformatics pipelines as distinct from the target organism of study or discarded intrinsically when mapping to a reference genome. Gonzalez et al. [46] recently reported how the sub-selection of only transcriptomic sequences expected a priori can confound biological results, the example lead-ing to S. purpurea biotic stress genes belead-ing misidenti-fied as abiotic stress responsive genes due to a strong treatment-specific interaction of a plant herbivore (Tetranycus urticae). Similarly, Brereton et al. [2] dem-onstrated the potential for mistaken mapping (mis-map-ping) RNA-seq reads from unexpected foreign organisms to technically confound results by mapping known foreign sequences to the S. purpurea genome. Given these poten-tial pitfalls, it would seem prudent to acknowledge the complexity of extra-laboratory biological systems involv-ing higher eukaryotes by investigatinvolv-ing all mRNA mole-cules present within any sample even when strong expectations exist within the experimental design. The ap-proach is limited here as an unknown absolute proportion (and community) of bacterial mRNA could be lost during polyA enrichment.
Despite polyA enrichment, an extremely broad di-versity of bacteria was observed within the system (including contigs that were not DE; Fig. 6a)). The majority of these contigs derived from Proteobacteria, including Alphaproteobacteria (14%), Betaproteobac-teria (34%), Deltaproteobacteria (13%) and Gammapro-teobacteria (23%). Actinobacteria (14%), Bacteroidetes (4%) and Firmicutes (4%) were also highly represented.
Table 2 Fungal nitrogen-related DE genes from upregulated Basidiomycota. EBSeq [42,43] was used to estimate posterior probabil-ity of differential expression (PPDE)≥ 0.95. A full DE transcript list including expression data, functional description (if available), gene ontology terms (if available) and secondary annotation (if available) is provided in Additional file6(Continued)
Query id Cont mean tpm
Treat mean tpm
FC 1° annotation id Subject description
c567674_g1_i1 0.00 4.48 inf gi|599098740|ref.|XP_007380368.1| Carbon-nitrogen hydrolase c597783_g1_i3 0.00 4.45 inf tr|F8QHR7|F8QHR7_SERL3 Glutamate carboxypeptidase c594170_g1_i2 0.00 3.78 inf gi|751737188|gb|KIM85475.1| Mitochondrial carrier
c601872_g2_i1 0.00 3.76 inf gi|628824529|ref|XP_007762568.1| ATP-dependent metallopeptidase Hfl c599577_g1_i2 0.00 3.73 inf gi|597902114|ref.|XP_007298356.1| Peptidase M24A methionine aminopeptidase c602154_g2_i2 0.01 3.51 328.31 gi|761927343|gb|KIY48481.1| D-aspartate oxidase
c600522_g1_i1 0.00 3.41 inf gi|695555686|ref.|XP_009546958.1| Bleomycin hydrolases/aminopeptidases (cys family)
c598679_g1_i2 0.00 3.40 852.70 tr|M2QPL6|M2QPL6_CERS8 Aspartic-type endopeptidase c601070_g1_i3 0.00 3.26 inf gi|599098141|ref|XP_007380172.1| Amine oxidase
c595365_g1_i2 0.00 2.95 inf tr|E2LXQ1|E2LXQ1_MONPE Amino acid transporter c601230_g1_i3 0.01 2.92 561.26 gi|695571495|ref|XP_009551148.1| Metallo peptidase M24B c600602_g1_i1 0.00 2.84 inf gi|695544112|ref.|XP_009543978.1| Small monomeric GTPase c601825_g4_i5 0.00 2.32 inf gi|754370636|gb|KIP03412.1| Vacuolar amino acid transporter


![Table 1 Fungal carbohydrate metabolism and CAZy. EBSeq [42, 43] was used to estimate posterior probability of differential expression (PPDE) ≥ 0.95](https://thumb-eu.123doks.com/thumbv2/123doknet/2934465.78300/13.892.88.790.195.1099/fungal-carbohydrate-metabolism-estimate-posterior-probability-differential-expression.webp)
![Table 1 Fungal carbohydrate metabolism and CAZy. EBSeq [ 42 , 43 ] was used to estimate posterior probability of differential expression (PPDE) ≥ 0.95](https://thumb-eu.123doks.com/thumbv2/123doknet/2934465.78300/14.892.85.809.185.1100/fungal-carbohydrate-metabolism-estimate-posterior-probability-differential-expression.webp)
![Table 1 Fungal carbohydrate metabolism and CAZy. EBSeq [ 42 , 43 ] was used to estimate posterior probability of differential expression (PPDE) ≥ 0.95](https://thumb-eu.123doks.com/thumbv2/123doknet/2934465.78300/15.892.83.805.187.506/fungal-carbohydrate-metabolism-estimate-posterior-probability-differential-expression.webp)
![Table 2 Fungal nitrogen-related DE genes from upregulated Basidiomycota. EBSeq [42, 43] was used to estimate posterior probabil- probabil-ity of differential expression (PPDE) ≥ 0.95](https://thumb-eu.123doks.com/thumbv2/123doknet/2934465.78300/17.892.88.798.180.1091/nitrogen-upregulated-basidiomycota-estimate-posterior-probabil-differential-expression.webp)
![Table 2 Fungal nitrogen-related DE genes from upregulated Basidiomycota. EBSeq [ 42 , 43 ] was used to estimate posterior probabil- probabil-ity of differential expression (PPDE) ≥ 0.95](https://thumb-eu.123doks.com/thumbv2/123doknet/2934465.78300/18.892.83.805.180.504/nitrogen-upregulated-basidiomycota-estimate-posterior-probabil-differential-expression.webp)
![Fig. 6 Bacterial contigs, total and differentially expressed (DE) transcript origin. Krona graphs [ 47 ] represent a total annotation of bacterial transcripts (including non-DE) and b annotation of DE bacterial transcripts](https://thumb-eu.123doks.com/thumbv2/123doknet/2934465.78300/19.892.92.804.131.833/bacterial-differentially-transcript-annotation-transcripts-annotation-bacterial-transcripts.webp)