DOI 10.1007/s00382-016-3201-9
3‑Step dynamical downscaling with empirical correction
of sea‑surface conditions: application to a CORDEX Africa
simulation
Leticia Hernández‑Díaz1 · René Laprise1 · Oumarou Nikiéma1 · Katja Winger1
Received: 7 December 2015 / Accepted: 20 May 2016
© The Author(s) 2016. This article is published with open access at Springerlink.com
WAM precipitation, mainly due to the correction of SSCs. In fact, our results show that proper sea surface temperature (SST) in the Gulf of Guinea is a necessary condition for an adequate simulation of WAM precipitation, especially over the equatorial region of West Africa. It was found that the climate-change projections under RCP4.5 scenario obtained with the 3-step approach are substantially differ-ent from those obtained with usual downscaling approach in which the RCM is directly driven by the CGCM output; in the WAM region most of the differences in the projected climate changes came mainly from the empirical correction of SST.
Keywords Regional climate modelling · Dynamical
downscaling · SST bias correction · West African Monsoon · Africa · CORDEX · CRCM5
1 Introduction
Coupled Global Climate Models (CGCMs) constitute privi-leged tools to study the consequences of changes in climate forcing under various scenarios. Their high computational cost however limits the resolution that can be used in cen-tury-long climate simulations; as example, the average grid mesh of CGCM participating in such centennial simula-tions in IPCC AR5 WGI (2013) was 321 km.1 Such coarse resolution is insufficient for most climate impact studies. Consequently, downscaling (von Storch 1995; Wilby and
1 This number is obtained taking, for spectral models, the linear
transform grid that best reflects the effective resolution (Laprise
1992), rather than the quadratic transform grid that is unfortunately the most often cited number.
Abstract Dynamical downscaling of climate projections
over a limited-area domain using a Regional Climate Model (RCM) requires boundary conditions (BC) from a Cou-pled Global Climate Model (CGCM) simulation. Biases in CGCM-generated BC can have detrimental effects in RCM simulations, so attempts to improve the BC used to drive the RCM simulations are worth exploring. It is in this context that an empirical method involving the bias correc-tion of the sea-surface condicorrec-tions (SSCs; sea-surface tem-perature and sea-ice concentration) simulated by a CGCM has been developed: The 3-step dynamical downscaling approach. The SSCs from a CGCM simulation are empiri-cally corrected and used as lower BC over the ocean for an atmosphere-only global climate model (AGCM) simu-lation, which in turn provides the atmospheric lateral BC to drive the RCM simulation. We analyse the impact of this strategy on the simulation of the African climate, with a special attention to the West African Monsoon (WAM) precipitation, using the fifth-generation Canadian Regional Climate Model (CRCM5) over the CORDEX-Africa domain. The Earth System Model of the
Max-Planck-Insti-tut für Meteorologie (MPI-ESM-LR) is used as CGCM and a global version of CRCM5 is used as AGCM. The results indicate that the historical climate is much improved, approaching the skill of reanalysis-driven hindcast simu-lations. The most remarkable effect of this approach is the positive impact on the simulation of all aspects of the
* Leticia Hernández-Díaz [email protected]
1 Département des sciences de la Terre et de l’atmosphère,
Centre ESCER (Étude et la Simulation du Climat à l’Échelle Régionale), Université du Québec à Montréal (UQAM), Succ. Centre-ville, C.P. 8888, Montreal, QC H3C 3P8, Canada
Wigley 1997) is used to adapt the output of CGCMs cli-mate projections to better address the needs of users. Empirical statistical downscaling (ESD) (e.g., von Storch et al. 1993; IPCC AR5 WGI 2013) has the double advan-tage of refining the resolution and removing biases in simu-lation climate statistics. ESD however requires ideally long, high-density and reliable observational database, and con-sistency amongst the adjusted climate variables is often lost. Dynamical downscaling (DD) using fine-mesh lim-ited-area nested regional climate models (RCMs) driven by CGCM-simulated data as boundary condition (BC) (Giorgi 1990) is nowadays of common practice. DD with RCMs is more costly than ESD but it has the advantage that the sim-ulated fields maintain their internal consistency. RCMs however suffer from the “garbage in, garbage out” syn-drome (e.g., Wilby and Fowler 2010; Rummukainen 2010) in the sense that their simulation inherits the biases of the imposed BC. Hence in practice, the RCM-simulated data is often subjected to ESD to remove biases before it is used for climate impact studies (Christensen et al. 2008; Dosio and Paruolo 2011).
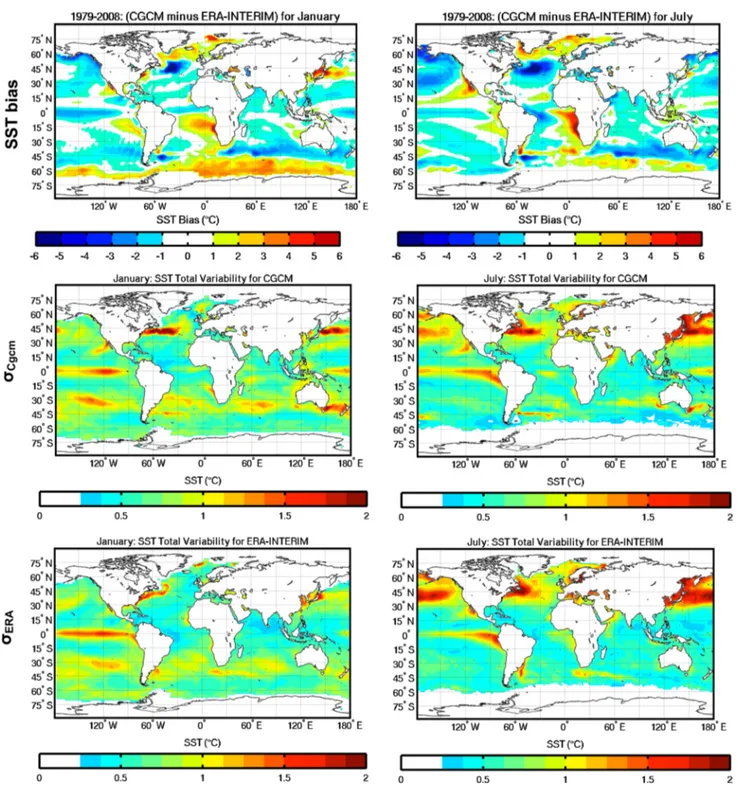
Recognizing the sensitivity of RCM simulations to biases of CGCM data, it seems well worth trying to minimize these biases before using them as BC forcing, in the hope that this will reduce the need for applying ESD on RCM-sim-ulated data, or at least reduce the magnitude of its correc-tions. Although there is an increasing number of RCMs that are coupled with regional ocean and sea-ice modules (e.g., Rockel 2015; Barring et al. 2014), today still the majority of RCMs use CGCM-simulated sea-surface BC over the ocean as well as lateral BC in the atmosphere. Figure 1 (1st row) shows the systematic bias of sea-surface temperature (SST) in a specific CGCM (MPI-ESM-LR), although it must be noted that similar biases of SST occur in most CGCMs (IPCC AR5 WG1 2013; CMIP5: Taylor et al. 2012). The largest biases occur near the coast of continents, often as a result of deficiencies in simulating processes such as marine stratocumulus, ocean upwelling or western boundary cur-rents. Such SST biases undoubtedly have repercussions on ocean-surface fluxes of heat and moisture and on features of the atmospheric circulation that depend crucially upon such exchanges, such as storm tracks and monsoons.
Different methods of bias correction of the CGCM-generated data used as driving BC for RCM simulations have been designed and tested recently. Some of these correct the mean bias of the CGCM (Bruyère et al. 2014; Done et al. 2015), others corrects also the CGCM variance (Xu and Yang 2012, 2015). In some other studies, climate-change delta of SST and atmospheric fields from a given CGCM simulation are applied as perturbation to the cur-rent-climate reanalysis data, and then these fields are used as BC to drive the RCM simulation for a future time-slice period (Patricola and Cook 2010; Yu and Wang 2014).
Bruyère et al. (2014) corrected the mean bias of the CGCM while retaining its synoptic and climate variability by first decomposing the CGCM-simulated data as well as the atmospheric and SST reanalyses into a mean season-ally-varying climatological component and a perturbation component, and then constructing the BC for driving the RCM simulation by replacing the CGCM climatological mean component by that of the reanalyses.
Yu and Wang (2014) did several experiments in which bias correction was applied to different sets of BC, con-taining synoptic forcing, monthly climatology with and without diurnal cycle. Different projections were obtained depending on the way the BC were considered. Their study highlights the fact that current approaches for bias correcting the BC to drive the RCM simulations contain physical inconsistencies that increase the uncertainties of RCM future projections. The authors called for additional research directed towards (1) the improvement of the phys-ical consistencies of the bias-corrected BC or (2) the devel-opment of a new approach for the bias correction of BC for regional climate projections.
Xu and Yang (2015) proposed an approach that com-bines CGCM mean bias and variance corrections with spectral nudging (SN) for driving the RCM simulation. The conclusion of their study revealed that using SN is not suitable for the downscaling of precipitation. Even for the other variables, they suggested using “reduced nudging”. Moreover, they highlighted the importance of having better CGCM BC for the RCM projections.
In the ENSEMBLES (van der Linden and Mitchell 2009) or PRUDENCE (Christensen and Christensen 2007) projects, efforts were made towards reducing the BC biases from driving models when performing DD. In these pro-jects, an intermediate-resolution AGCM was employed between the CGCM and RCM simulations for several GCM–RCM pairs of the experiment matrix (Déqué et al. 2014). The AGCM used for lower BC over the ocean the observed SST to which was added the climate-change delta SST for the future periods.
Finally, Katzfey et al. (2009, 2011) used a Variable-Resolution Global Atmospheric Model (VRGCM), the CSIRO atmospheric GCM CCAM (McGregor et al. 2002; McGregor and Dix 2008), to dynamically downscale CGCM-simulated data with and without bias correction of the SST for ten July months. Their study shows that the simulation of precipitation is significantly improved for current climate when using the bias-corrected CGCM-SST as lower BC.
In this paper we experiment with a related bias-cor-rection methodology that we will call the “3-step DD” technique. In this approach, sea-surface conditions simu-lated by a CGCM are empirically corrected and used as lower BC over the ocean for an intermediate-resolution
AGCM simulation, which in turn will generate the atmos-pheric lateral BC to the RCM downscaling simulation, hence the name “3-step DD” (CGCM-AGCM-RCM), in contrast with the usual “2-step DD” (CGCM-RCM) used for example for CORDEX (Giorgi et al. 2009; Jones et al. 2011). An important advantage of the intermediate step in which the AGCM is forced by the corrected sea-surface
conditions is that the atmosphere in this model has the possibility to adjust to the corrected SST/SIC fields, including not only the mean circulation but also the spa-tial and temporal variability. For example, if the location of the Gulf Stream is corrected, the position of the result-ing jet stream stands a chance of beresult-ing improved, as will be the storm track.
Fig. 1 Sea Surface Temperature (SST) bias of the CGCM (MPI-ESM-LR) with respect to ERA reanalyses (1st row), and SST time variability (σSST) of the CGCM (2nd row) and of ERA (3rd row), for January (left column) and July (right column), for the period 1979–2008
We analyse the results of the application of the “3-step DD” over the CORDEX Africa domain using the fifth-generation Canadian Regional Climate Model (CRCM5). Previous work using CRCM5 for climate simulations over this region showed for example that when driven by ERA-Interim reanalyses, the CRCM5 is capable of reproducing the double rainy season in the region of the Guinea Coast (Hernández-Díaz et al. 2013). Two CGCM-driven CRCM5 simulations however missed this feature of the West Afri-can Monsoon (WAM), as did the CGCMs themselves (Laprise et al. 2013). Moreover, both CGCMs (MPI-ESM-LR and CanESM2) exhibited strong SSTs biases in tropi-cal and equatorial Atlantic Ocean (Fig. 3 in Laprise et al. 2013). The 3-step DD over the CORDEX Africa domain reveals the extent to which the modified SSTs can improve the simulation of the West African Monsoon (WAM) precipitation.
The paper is organised as follows. The empirical correc-tion methodology, the models descripcorrec-tion and the configu-ration of the simulations are presented in Sect. 2. Results for historical climate are discussed in Sect. 3. The climate-change projections follow in Sect. 4. Finally a summary of the findings and conclusions are presented in Sect. 5.
2 Methodology
First row of Fig. 1 shows the systematic bias of sea-surface temperature (SST) of the Max-Planck-Institut für
Meteor-ologie Earth System model (hereinafter MPI-ESM-LR) that will be used as CGCM in this study; as mentioned before, similar biases occur in most CGCMs. The largest biases occur near continental coasts. Such SST biases are associ-ated with atmospheric circulation biases, and the combina-tion of these can have detrimental effects when used as BC to drive RCM historical and future scenario simulations.
In this paper an empirical BC bias correction method is tested, as described in the next section.
2.1 The 3‑step dynamical downscaling using the SSC Bias correction
The basic assumption of the approach is that of persisting biases, assuming that biases in the historical simulation will persist in the future scenario projections; hence the SST and SIC simulated by a CGCM will be empirically corrected by subtracting the biases identified in simulating the historical period.
The notation is as follows: ψG(d, m, y) corresponds to an archive of historical CGCM-simulated ocean surface variable, such as sea-surface temperature (SST) or sea-ice concentration (SIC), and ψA(d, m, y) is the corresponding analysed variable. Here d refers to 6-hourly values for each
day in a month m of a year y. The historical bias is defined as
where the yH denotes a mean over some historical time
period yH (e.g. 1979–2008). The corrected field ψ′(d, m, y) is defined as
such that it will have no climatological bias over the his-torical period.
It is important to realise however that, with this correc-tion procedure, the instantaneous fields ψ′(d, m, y) will be
rather smooth compared to reanalyses because they retain the resolution of the CGCM fields ψG(d, m, y); hence they will lack fine-scale features that may be present in the ana-lysed fields ψA(d, m, y). Note also that the resulting cor-rected variable ψ′(d, m, y) retains the CGCM-simulated
temporal variability and its evolution in future time, a good feature if it is trustworthy, a bad one if not. In Fig. 1, the second row shows the time variability of SST in the CGCM historical simulation and the third row the correspond-ing fields from ERA-Interim reanalyses. One sees that, although there are differences, the CGCM succeeds in cap-turing the overall location and amplitude of most signifi-cant variability features.
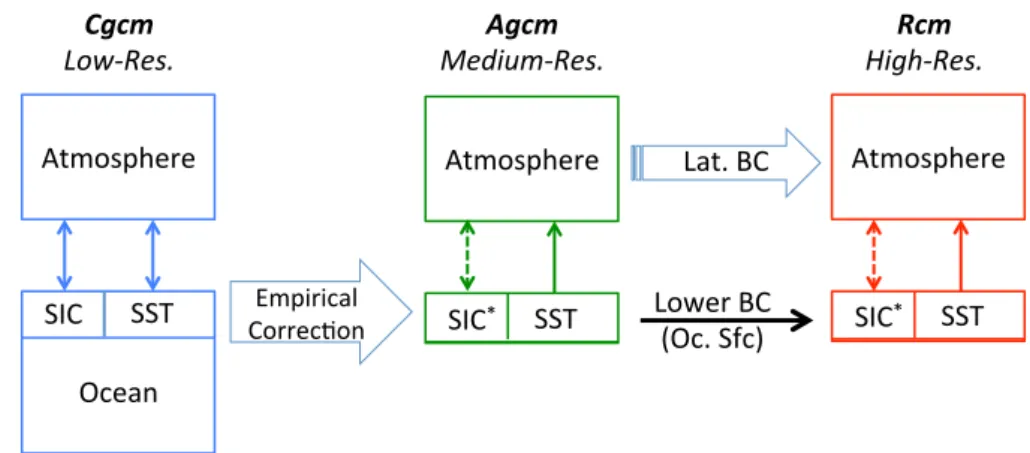
It would be inappropriate to use the adjusted sea-surface fields directly as ocean BC in the RCM simulation because these fields would be inconsistent with the CGCM atmos-pheric fields (note however that we have done this experi-ment for testing, as discussed in Sect. 2.3). Hence the second step in the proposed procedure is to run an atmos-phere-only GCM (AGCM) using as ocean BC the cor-rected sea-surface fields. The third and final step is to use the atmospheric fields from the AGCM simulation, together with the corrected sea-surface fields, as lateral atmospheric BC and surface ocean BC respectively, for driving an RCM simulation over the region of interest: in the present case, the CORDEX-Africa domain. Figure 2 shows a flowchart describing the proposed 3-step dynamical downscaling technique.
A detailed analysis of the time evolution of SIC after application of our empirical bias correction method has revealed incongruities in the margin between fully ice-covered and ice-free regions. We believe however that these have little impact for the simulation of Africa’s climate for two reasons: the distant location of Polar and African regions, and the fact that the region where the SIC is bias-corrected is a rather narrow belt between fully ice-covered and ice-free regions, unlike the SST for which the bias cor-rection is made over large portions of the globe. Hence, the impact of SIC biases (and its correction) is rather geograph-ically limited; we are currently investigating alternative
B(d, m) = ψG(d, m, y)
yH
− ψA(d, m, y)
yH
approaches to the method described above for CORDEX Arctic simulations with CRCM5.
2.2 Model description
The RCM employed in this study is the fifth-generation Canadian Regional Climate Model (CRCM5). A detailed description of CRCM5 is given in Hernández-Díaz et al. (2013, hereinafter HD13) and Laprise et al. (2013). CRCM5 is based on a limited-area configuration of the Global Environment Multiscale (GEM) model (Bélair et al. 2005, 2009) employed for numerical weather predic-tion by the Canadian Meteorological Centre (CMC). The subgrid-scale physical parameterisations include the Kain and Fritsch (1990) deep-convection and Kuo-transient (Kuo 1965) shallow-convection schemes, as well as the Sundqvist et al. (1989) large-scale condensation scheme, the correlated-K scheme for solar and terrestrial radiations (Li and Barker 2005), a subgrid-scale mountain gravity-wave drag (McFarlane 1987) and low-level orographic blocking (Zadra et al. 2003), a turbulent kinetic energy clo-sure in the planetary boundary layer and vertical diffusion (Benoît et al. 1989; Delage and Girard 1992; Delage 1997), and a weak ∇6 lateral diffusion. The land-surface scheme
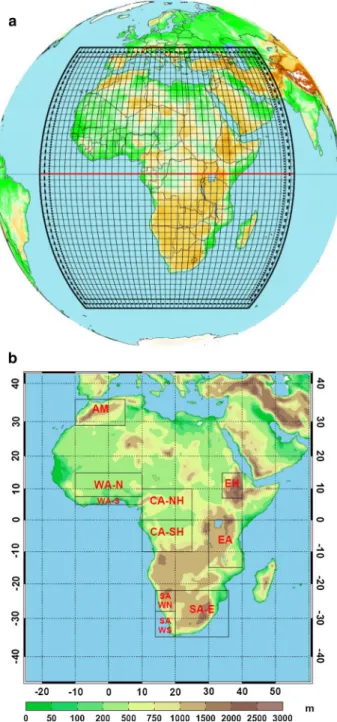
however is changed from ISBA used in GEM for the Cana-dian LAnd Surface Scheme (CLASS; Verseghy 2000, 2008) in its most recent version, CLASS 3.5. For these simula-tions 26 soil layers are used, reaching to a depth of 60 m as in Laprise et al. (2013). Otherwise, as in HD13 and Laprise et al. (2013), the standard CLASS distributions of sand and clay fields as well as the bare soil albedo values were replaced by data from the ECOCLIMAP database (Mas-son et al. 2003). Finally, the interactive thermo-dynamical 1-D lake module (FLake model) was also used (see Mar-tynov et al. 2010, 2012). The CRCM5 was integrated over the CORDEX Africa domain (Fig. 3) with a horizontal grid spacing of 0.22°, with a 10-min timestep. The compu-tational domain has 408 × 422 grid points, excluding the semi-Lagrangian halo but including a 10-grid-point wide
sponge zone around the perimeter; hence the free domain is 388 × 402. In the vertical, 56 levels were used, with the top level near 10 hPa and the lowest level at 0.996 ∗ ps where ps
is the surface pressure. For diagnostic analysis most vari-ables were archived at 3 hourly intervals, except precipita-tion and surface fluxes that were cumulated and archived at hourly intervals.
The AGCM used in this study is a global version of CRCM5, with a regular latitude-longitude grid of 1° and 64 levels in the vertical, with a top level at 2 hPa, and a timestep of 45 min. Given that the AGCM does not involve coupling with an ocean, an intermediate resolution between that of the RCM and the CGCM could be afforded, which also possibly contributes to improving the lateral BC driv-ing the RCM. Subgrid-scale physical parameterisations are the same of those of CRCM5, except for small differences in convection-related formulation to account for differences in resolution.
The CGCM used is MPI-ESM-LR, the Earth System model of the Max-Planck-Institut für Meteorologie (http:// www.mpimet.mpg.de/en/science.html), with the atmos-pheric component operating at T63, with a linear transform grid of approximately 2.85° and 47 levels in the vertical.
2.3 Simulation configuration
The MPI-ESM-LR simulation (referred to as Cgcm) covers the period 1949–2100, under historical and RCP4.5 emis-sion scenario. The period 1979–2008 was chosen to calcu-late the SST and SIC biases with respect to ERA-Interim reanalyses. The corrected fields are then used as ocean sur-face BC for the AGCM simulation (referred to as Agcm_e, the subscript e being used as a reminder of the empirical correction applied to sea-surface fields) from 1949 to 2100 under historical and RCP4.5 emission scenario. Finally, this Agcm_e simulation will provide the atmospheric lateral BC for the CRCM5 simulation over the CORDEX-Africa domain for the same period (1949–2100), using the cor-rected sea-surface fields; this simulation will be referred to
Fig. 2 Flowchart of the 3-step dynamical downscaling approach. Note that while in the Agcm and Rcm sea-ice concen-tration (SIC) and sea-surface temperature (SST) are specified, sea-ice thickness and sea-ice temperature are calculated
as Rcm/Agcm_e, and it will be compared to that driven by the Cgcm following the usual two-step dynamical downs-caling, noted as Rcm/Cgcm.
In addition to the 3-step DD simulation (Rcm/Agcm_e) and the usual 2-step DD simulation (Rcm/Cgcm), some other test simulations have been performed, which occa-sionally will be commented upon in analysing the results.
These include: a CRCM5 simulation driven by the atmos-pheric lateral BC from the CGCM but with the corrected sea-surface BC (noted Rcm/Cgcm_*e); two other AGCM-driven CRCM5 simulations: one with the uncorrected CGCM-simulated sea-surface fields (noted Rcm/Agcm_u) and another with the ERA-Interim analysed sea-surface fields (Rcm/Agcm_o); and finally a reanalysis-driven hind-cast simulation (Rcm/ReAn). All but Rcm/Agcm_o and Rcm/ReAn were performed for the 1949–2100 time period. It must be clearly recognized however that Rcm/Cgcm_*e represents an incoherent combination of atmospheric lateral and ocean surface BC. The comparison of Rcm/ Agcm_u and Rcm/Cgcm allows identifying the impact of using an intermediate-resolution AGCM, while the com-parison of Rcm/Agcm_o and Rcm/ReAn allows identify-ing the impact of AGCM structural errors upon the RCM hindcast simulation. In summary, for this study a total of 3 AGCM simulations and 6 RCM simulations have been car-ried on as shown in Table 1.
For the reanalysis-driven CRCM5 simulation (Rcm/ ReAn) lateral BC and sea-surface BC came from the European Centre for Medium-range Weather Forecasting (ECMWF) reanalyses (ERA-Interim; Simmons et al. 2007; Uppala et al. 2008; Dee et al. 2011) on a 0.75° horizontal grid. For the Rcm/Agcm_o simulation, sea-surface BC are from ERA-Interim Reanalyses. These two simulations are performed for the 1979–2008 time period.
The simulations are compared to several observational datasets. These include the CRU (Climate Research Unit, version 3.1 from 1901 to 2009; Mitchell and Jones 2005; Mitchell et al. 2004) gridded analyses on a 0.5° grid with monthly temporal resolution, the GPCP dataset at 1° daily (Global Precipitation Climatology Project; Adler et al. 2003) available from 1997 (Huffman et al. 2001), and the TRMM (Tropical Rainfall Measuring Mission; Huffman et al. 2007) dataset, on a 0.25° grid at 3 hourly (3B42) and monthly intervals (3B43), covering the period from 1998 to present. ERA-Interim reanalyses at 0.75° (available from 1979) is also used as reference for some comparisons.
3 Historical climate simulation results
In this section we analyse the results of CRCM5 historical simulations comparing the skill of the 3-step DD simula-tion (Rcm/Agcm_e) with that of the 2-step DD simulasimula-tion (Rcm/Cgcm), as well as with hindcast ERA-driven simula-tion (Rcm/ReAn) over the CORDEX Africa domain.
3.1 Seasonal mean climatology
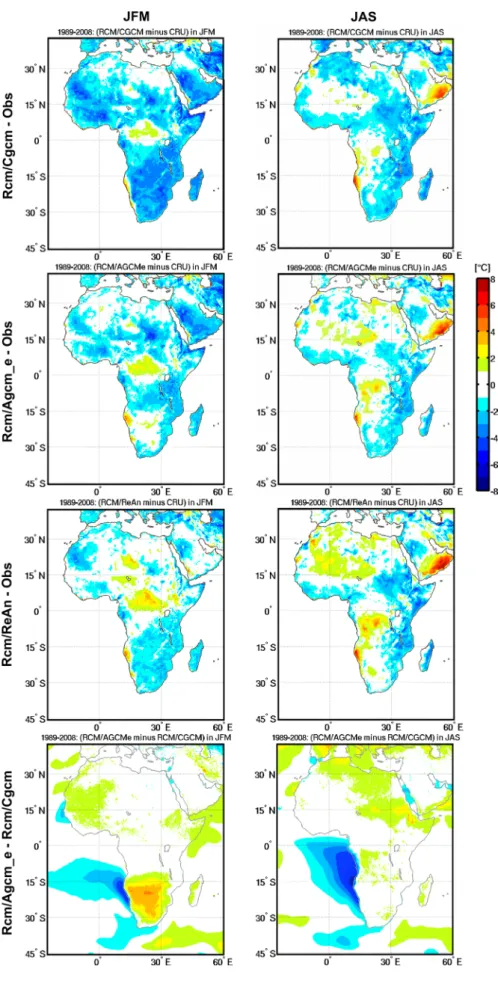
Figures 4 and 5 show the biases of the Rcm/Cgcm, Rcm/ Agcm_e and Rcm/ReAn simulations, for 2-m temperature
Fig. 3 a CORDEX-Africa domain for the 0.22° CRCM5 simulation, including the ten grid point semi-Lagrangian halo and the ten grid point Davies sponge zone; only every 10th grid box are displayed. b Regions within the African domain are taken from Fig. 1 of http:// www.smhi.se/forskning/forskningsomraden/klimatforskning/1.11299
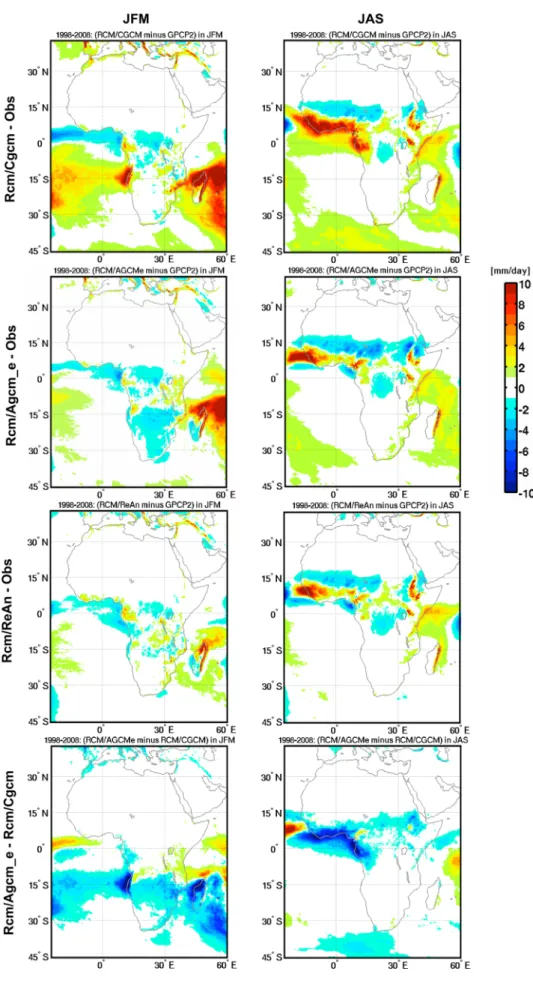
compared to CRU analysis of observations over land for 1989–2008 (Fig. 4), and for precipitation compared to GPCP2 for 1998–2008 (Fig. 5), for January–February– March (JFM) in the left column and for July–August– September (JAS) in the right column. The last row shows the difference between the Rcm/Agcm_e and Rcm/Cgcm historical simulations to illustrate the impact of the 3-step DD with empirical correction of sea-surface fields.
Figure 4 shows that the Rcm/Cgcm exhibits a large cold bias in JFM over most of the African continent (except Cen-tral African Republic and Democratic Republic of Congo), which is greatly reduced in Rcm/Agcm_e; in fact the Rcm/ Agcm_e bias approaches the structural bias found in Rcm/ ReAn. The last row shows that correcting the warm bias in southeastern Atlantic Ocean surface temperature results in a beneficial warming and reduction of the important cold bias in southern Africa (Namibia, Botswana, Zimbabwe and South Africa). In JAS there is a small warming in Rcm/ Agcm_e over northeastern Africa (Libya, Egypt, Sudan, Ethiopia and Somalia) that nearly removes the cold bias of Rcm/Cgcm there. In fact the skill of Rcm/Agcm_e is very similar to that of Rcm/ReAn. Comparing these results with those of Rcm/Agcm_u (not shown) reveals that most of the improvement with Rcm/Agcm_e in JFM comes from the use of the sea-surface bias correction and not from the use
of the intermediate-resolution AGCM, although both fac-tors contribute in JAS.
Figure 5 shows substantial precipitation biases in the Rcm/Cgcm. There is a particularly large wet bias over the eastern South Atlantic Ocean and western Indian Ocean in JFM, and a dipole bias over the West African Mon-soon region in JAS, with excessive precipitation over the Guinea Gulf coast region and a dry bias over the Sahel. These biases are substantially reduced in the Rcm/Agcm_e simulation, whose precipitation biases in fact approach the structural biases found in the Rcm/ReAn simulation. Comparing these results with those of Rcm/Agcm_u (not shown) reveals that most of the improvement in Rcm/ Agcm_e again comes from the use of the sea-surface bias correction, except for the reduction of the wet bias over western Indian Ocean in JFM that arises to a large extent from the use of the intermediate-resolution AGCM.
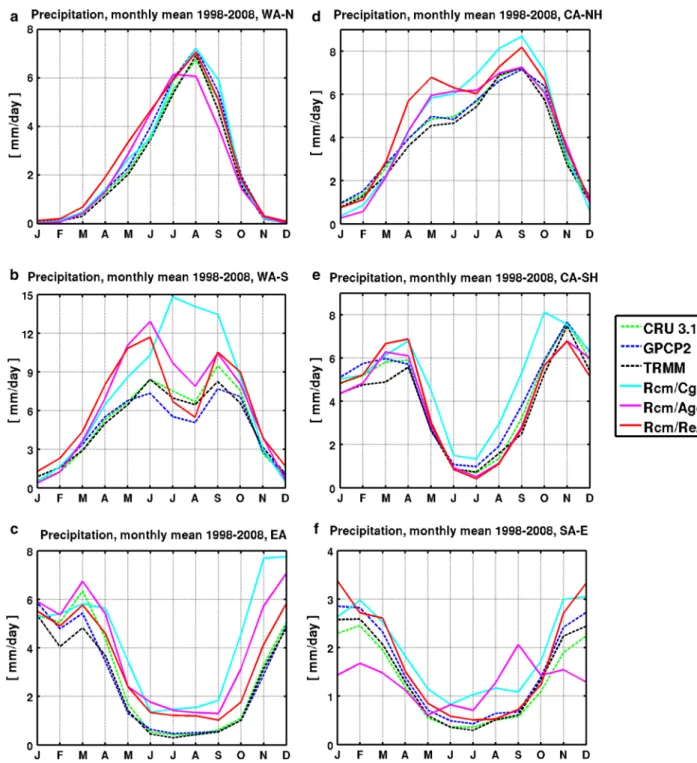
3.2 Annual cycle of precipitation
The mean annual cycles of precipitation for six of the Afri-can-CORDEX regions shown in Fig. 3b are displayed in Fig. 6. The most striking effect of the 3-step DD with the empirical correction of the SSTs can be seen in the WA-S region (panel b), where the bimodality of the annual cycle present in the observations and the reanalysis-driven lation (Rcm/ReAn) that was lost in the Rcm/Cgcm simu-lation is recovered with the empirically corrected SST in Rcm/Agcm_e. The analysis of the 3-step DD without cor-rection of the SST, Rcm/Agcm_u, (not shown) confirms that the improvement arises from the corrected SST and not from the use of the intermediate-resolution AGCM. For the other regions, the 3-step DD (Rcm/Agcm_e) shows an improved representation of the annual cycle of precipita-tion, nearly as good as the hindcast simulation driven by the reanalysis (Rcm/ReAn) and even sometimes coinci-dentally better (e.g., CA-NH region, panel d). In the WA-S region as well as in the two other equatorial regions (CA-NH and CA-SH), even the sensitivity test simulation Rcm/ Cgcm_*e gives good results (not shown). The analysis of the AGCM-simulated precipitation (not shown) revealed that the simulations with good SST (Agcm_e and Agcm_o) are also capable of simulating the two peaks of rainfall in this region, unlike the CGCM and the AGCM without SST correction (Agcm_u) that both produced only one peak.
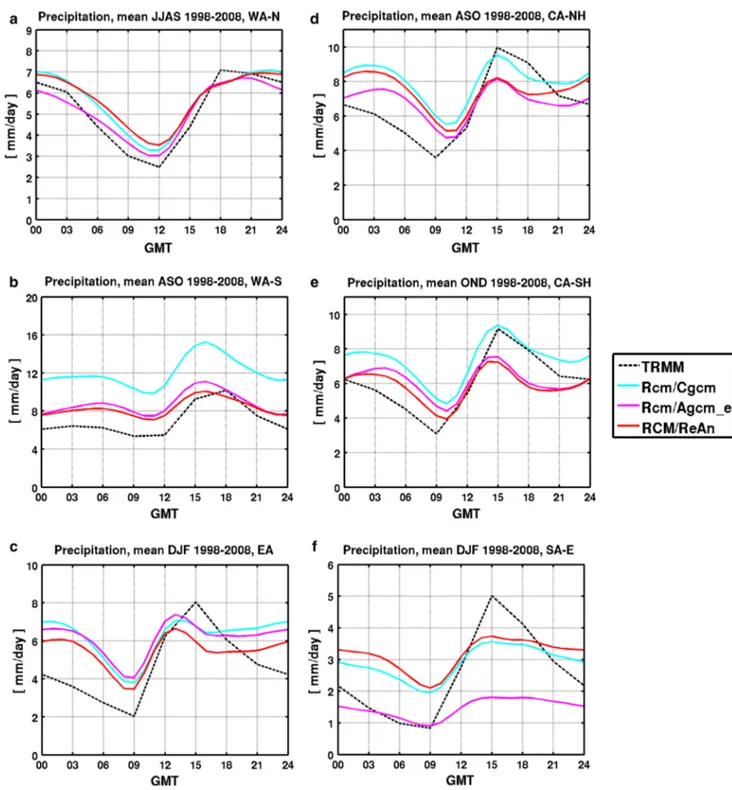
3.3 Diurnal cycle of precipitation
Figure 7 shows the simulated diurnal cycle of precipita-tion compared to that of the TRMM dataset for the period (1998–2008) over the same six regions and for different 3- or 4-month periods corresponding to the local rainy season.
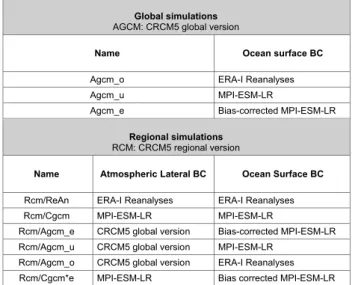
Table 1 Matrix of simulations carried out in this study. Three AGCM simulations have been done to serve as lateral BC to drive the RCM: one using the observed SSC (Agcm_o), one using the uncorrected CGCM-simulated SSC (Agcm_u) and finally the one using the empirically corrected CGCM SSC (Agcm_e). Six RCM simulations have been done: a reanalyses-driven RCM simulation (Rcm/ReAn), a CGCM-driven RCM simulation (Rcm/Cgcm), three AGCM-driven RCM simulations (Rcm/Agcm_e, Rcm/Agcm_u and Rcm/Agcm_o), and another CGCM-driven RCM simulation with the empirically cor-rected SSC (Rcm/Cgcm*e). All but Rcm/Agcm_o and Rcm/ReAn were performed for the 1949–2100 time period, Rcm/Agcm_o and Rcm/ReAn were performed for the period 1979–2008
Global simulations AGCM: CRCM5 global version
Name Ocean surface BC
Agcm_o ERA-I Reanalyses
Agcm_u MPI-ESM-LR
Agcm_e Bias-corrected MPI-ESM-LR
Regional simulations RCM: CRCM5 regional version
Name Atmospheric Lateral BC Ocean Surface BC
Rcm/ReAn ERA-I Reanalyses ERA-I Reanalyses
Rcm/Cgcm MPI-ESM-LR MPI-ESM-LR
Rcm/Agcm_e CRCM5 global version Bias-corrected MPI-ESM-LR Rcm/Agcm_u CRCM5 global version MPI-ESM-LR
Rcm/Agcm_o CRCM5 global version ERA-I Reanalyses
Fig. 4 Bias of the 2-m tempera-ture for 1989–2008 compared to observational dataset CRU available over land, for the historical simulations Rcm/ Cgcm (1st row) and Rcm/ Agcm_e (2nd row), and for the hindcast simulation Rcm/ReAn (3rd row). The 4th row shows the difference between the Rcm/ Agcm_e and Rcm/Cgcm histori-cal simulations
Fig. 5 As Fig. 4, but for precipitation for the period 1998–2008. In this case the observational dataset is GPCP2
Overall there is a fairly good representation of the phase of diurnal variation of precipitation, but with a general ten-dency for the daily maximum to occur somewhat too early, especially over WA-S, a common feature of most models over Africa (Nikulin et al. 2012). The excessive precipi-tation intensity in the Rcm/Cgcm simulations is greatly
reduced in Rcm/Agcm_e, approaching the skill of the hindcast simulation Rcm/ReAn. An exception is the SA-E region, where in addition the Rcm/Agcm_e and Rcm/ReAn simulated precipitation differ substantially and none of the simulations appear to be able to reproduce the signature of the TRMM analysis of observations. Comparison with
Fig. 6 Mean (1998–2008) annual cycle of precipitation (mm/day) from Rcm/Cgcm (cyan), Rcm/Agcm_e (magenta), Rcm/ReAn (red) and from observations: CRU (dashed green), GPCP (dashed blue) and TRMM (dashed black) for the regions of the African CORDEX
domain. a West Africa-North (WA-N). b West Africa-South (WA-S). c East Africa (EA). d Central Africa-Northern Hemisphere (CA-NH). e Central Southern Hemisphere (CA-SH), and f South Africa-East (SA-E)
the sensitivity experiments simulations Rcm/Agcm_u and Rcm/Cgcm_*e (not shown) suggests that the improvement in the representation of the diurnal cycle of precipitation in the three equatorial regions (WA-S, CA-NH and CA-SH) is a result of the correction of the sea-surface conditions.
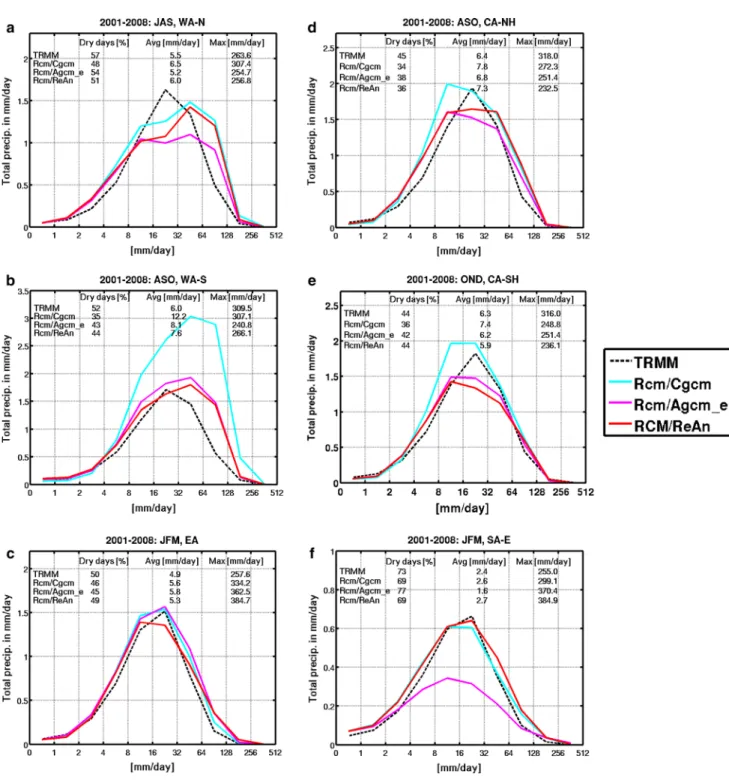
3.4 Daily precipitation intensity distributions
Figure 8 shows the daily precipitation intensity distri-bution (DPID) as calculated in Laprise et al. (2013) over six Africa regions, for the CRCM5 simulations compared
Fig. 7 Mean (1998–2008) diurnal cycle of precipitation (mm/day) from TRMM dataset (dashed black) and for the simulations Rcm/ Cgcm (cyan), Rcm/Agcm_e (magenta), Rcm/ReAn (red), for the regions of the African CORDEX domain. a West Africa-North
(WA-N). b West Africa-South (WA-S). c East Africa (EA). d Central Africa-Northern Hemisphere (CA-NH). e Central Africa-Southern Hemisphere (CA-SH), and f South Africa-East (SA-E)
to the TRMM observational dataset for the period (2001– 2008). Different three-month periods are used for different regions, chosen to correspond to the maximum rain season. Overall the CRCM5 succeeds in reproducing the location of the peak in the distribution, around 16–32 mm da−1. The
excessive precipitation quantity and intensity simulated over WA-S (panel b) by Rcm/Cgcm is greatly improved in Rcm/Agcm_e. Similar but more modest improvements are also noted in the CA-NH and CA-SH regions (panels d and e). All the regions (except the EA region; panel c) exhibit an improved DPID by the use of the 3-step DD technique, the WA-S being the most impacted.
The analysis of the DPID of the corresponding driv-ing models (not shown) suggests that in the WA-N region (panel a), it is the differences between the driving mod-els more than the SSC that accounts for the different rep-resentation of the DPID. In the equatorial regions WA-S, CA-NH and CA-SH, however, it seems to be the correction in SSC that has the largest impact in improving the repre-sentation of the DPID.
These results document how different are the regional impacts of the various modifications: the empirical cor-rection of the SSC, the use of an intermediate-resolution AGCM, and the combined effect of both, in our DD simu-lation over Africa.
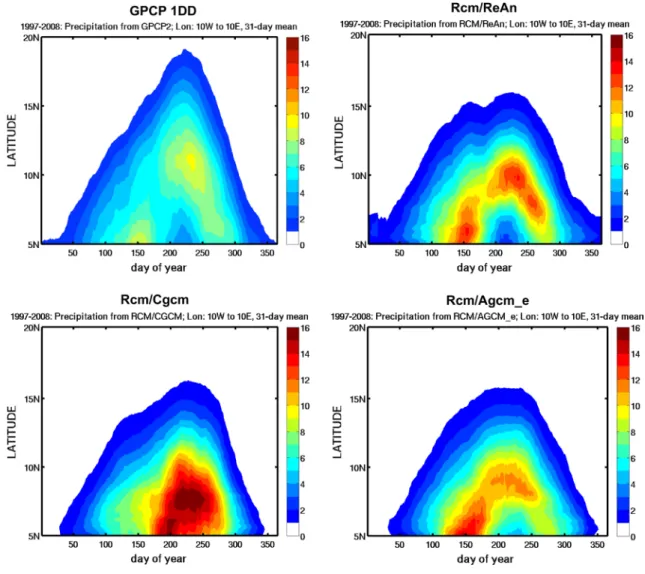
3.5 West African Monsoon
The WAM is not only one of the most important elements of the African climate but also a complex system where the interaction between the surface (ocean and land) and the atmosphere is crucial for the representation of the precipi-tation. Figure 9 presents Hovmöller-type diagrams showing time-latitude cross-sections of precipitation throughout the year, after applying a 31-day moving average to the daily precipitation values to remove high-frequency variabil-ity. The values correspond to the average over the region between 10°W to 10°E and 5°N to 20°N, averaged for the period 1997–2008. Besides the observational data from GPCP, are shown the CRCM5 hindcast simulations driven by the Reanalyses (Rcm/ReAn), and the CRCM5 histori-cal simulations driven by the CGCM (Rcm/Cgcm) and by the AGCM with empirical correction of sea-surface condi-tions (Rcm/Agcm_e). The typical signature of WAM with seasonal displacement of rainfall showing a double peak at 5°N (in May and September) and a single one around 10°N in August is noted in GPCP. All CRCM5 simulations show an excessive amount of precipitation in the southern part and a deficit in the northern part. The Rcm/Cgcm simula-tion (as well as the Rcm/Agcm_u; not shown) completely fails to show the double peak and exhibits the most exces-sive precipitation amounts around days 200–250 between 0 and 10°N when in fact occurs the minimum precipitation
there. This is also the case for the corresponding driving models (Cgcm and Agcm_u; not shown). The double peak that was simulated in the hindcast simulation Rcm/ReAn is recovered in the Rcm/Agcm_e simulation (as well as in the Rcm/Agcm_o and Rcm/Cgcm_*e simulations; not shown), showing the positive impact of the empirical correction of the warm SST bias in the Gulf of Guinea. Unlike the Cgcm simulation, the Agcm_e and Agcm_o simulations (not shown) are capable of reproducing the seasonal migration of rainfall in the region of the WAM.
The sensitivity of RCM simulated WAM precipitation to the driving BC was highlighted, for example, in the studies of Moufouma-Okia and Rowell (2010) and Laprise et al. (2013). In the first, experiments performed for six WAM rainy seasons in order to determine the relative impact of initial soil moisture and driving BC on the simulation of the WAM, showed that the magnitude and spatial distribution of simulated precipitation were substantially dominated by the driving BC. On their side, Laprise et al. (2013) found that biases present in the CGCMs used for their RCM simu-lations had detrimental impact on the simulated WAM pre-cipitation in the region of the Guinea Coast (WA-S). As it is the evolution of the interaction between the cold tongue (Nguyen et al. 2011) in the region of the Guinea Gulf and the thermal low located over the Sahara (Saharan Heat Low, SHL; Lavaysse et al. 2009) that regulates the WAM rainfall migration (Thorncroft et al. 2010; Lafore et al. 2010), it is evident that having good sea-surface BC and its corresponding atmospheric BC is of paramount importance for the simulation of the WAM precipitation in RCMs.
The results shown here confirm that good sea-surface conditions are essential for the proper representation of rainfall in the region of the WAM, especially in the region of the Guinea Coast (WA-S). This is in accord with the study of Nguyen et al. (2011) that highlighted the link between the sea-surface conditions in the equatorial and southeast Atlantic Ocean and WAM precipitation in the region of the Guinea Coast.
4 Climate‑change projections
In this section we analyse the effect of the 3-step DD on the projected climate changes in 2-m temperature and precipitation.
Figure 10 shows the CRCM5-projected 2-m tempera-ture changes for the end of the twenty-first century (2071– 2100) compared to the reference period (1981–2010), for JFM (left panels) and JAS (right panels), using the 2-step (Rcm/Cgcm) and 3-step (Rcm/Agcm_e) DD technique. For both seasons, the simulated climate becomes progressively warmer as the end of the century approaches, the warming in the JAS season being generally larger than that in JFM.
Interestingly enough the 3-step DD climate-change projec-tion gives a somewhat different pattern of warming than the 2-step DD, and the magnitude of warming is smaller. In particular, the location of the maximum warming notably differs between the Rcm/Cgcm and Rcm/Agcm_e projec-tions. The comparison with the sensitivity test simulation
Rcm/Agcm_u (not shown) revealed that the differences in the projected 2-m temperature changes between the two DD techniques came mainly from the empirical correction of the sea-surface correction in JFM, but in JAS the use of the intermediate-resolution AGCM contributed substan-tially also.
Fig. 8 Mean (2001–2008) daily precipitation intensity distribution (DPID) as simulated by Rcm/Cgcm (cyan), Rcm/Agcm_e (magenta), and Rcm/ReAn (red), compared to the TRMM observational dataset (dashed black), for the regions of the African CORDEX domain. a
West Africa-North (WA-N). b West Africa-South (WA-S). c East Africa (EA). d Central Africa-Northern Hemisphere (CA-NH). e Central Southern Hemisphere (CA-SH), and f South Africa-East (SA-E)
The last row in Fig. 10 shows the difference between the Rcm/Cgcm and Rcm/Agcm_e average 2-m tempera-ture projected for the period 2071–2100. We see that these differences have a lot in common with the corresponding average simulated climate for the historical period 1989– 2008 shown in the last row in Fig. 4.
Figure 11 shows the corresponding projected changes in seasonal mean precipitation. For JFM the magnitudes of projected precipitation changes are small over the continent but larger over the ocean in the southeastern part of the domain with both DD methods. For JAS there is a substan-tial difference between the projected precipitation changes obtained with the two DD methods in the latitude band between 0 and 15°N, with the 3-step DD projected changes being smaller in magnitude and spatial extension than the 2-step DD projected changes. The comparison with the sen-sitivity test simulation Rcm/Agcm_u (not shown) revealed
again that the differences in the projected precipitation changes between the two DD techniques came mainly from the empirical correction of the sea-surface correction, not from the use of the intermediate-resolution AGCM.
The last row in Fig. 11 shows the difference between the Rcm/Cgcm and Rcm/Agcm_e average precipitation projected for the 2071–2100 period; these differences have also a lot in common with the corresponding average simu-lated climate for the historical period 1989–2008 shown in the last row in Fig. 5.
5 Conclusions
In this paper, we presented a strategy for dynamical down-scaling with empirical correction of sea-surface fields, nicknamed the 3-step dynamical downscaling approach.
Fig. 9 Hovmöller diagram of the mean (1997–2008) annual cycle of precipitation (mm/day) over West Africa from GPCP 1DD data-set (top left) and Rcm/ReAn (top right), Rcm/Cgcm (bottom left) and
Rcm/Agcm_e (bottom right), averaged over 10°W–10°E. A 31-day moving average has been applied to remove high-frequency variabil-ity
We analysed the impact of this strategy on the simulation of the African climate, in particular, on the simulation of the WAM precipitation, using the fifth-generation Canadian Regional Climate Model (CRCM5) over the CORDEX-Africa domain.
The 3-step dynamical downscaling approach can be described as follows. The sea-surface conditions (SSC; sea-surface temperature, SST; and sea-ice concentration, SIC) from a simulation of a coarse-mesh coupled global climate model (CGCM), in this case the Earth System
Model of the Max-Planck-Institut für Meteorologie (MPI-ESM-LR), were empirically corrected by subtracting the bias calculated over the historical period, and used as sea-surface boundary condition (BC) for a simulation of an atmosphere-only GCM (AGCM), in this case an interme-diate-resolution global version of CRCM5. The output of this AGCM simulation is used as atmospheric lateral BC to drive the RCM (in this case, the CRCM5) simulation. This approach of using an intermediate step in which an AGCM is forced by the corrected sea-surface conditions has the
Fig. 10 Projected changes for 2-m temperature (°C) (2071– 2100) to (1981–2010), by Rcm/ Cgcm (first row) and Rcm/ Agcm_e (middle row), for JFM (left column) and JAS (right column). The last row shows the difference of projected climate by Rcm/Agcm_e and Rcm/ Cgcm for 2071–2100
important advantage that the atmosphere in this model has the possibility to adjust to the corrected SSC fields, includ-ing not only the mean circulation but also the spatial and temporal variability.
Despite its relative simplicity, the proposed 3-step dynamical downscaling technique with empirically cor-rected SSC shows substantial improvements in simulating the historical climate. For example, the bimodal distri-bution of precipitation over southern part of West Africa
(WA-S region) that was absent in the CGCM-driven CRCM5 simulation (Rcm/Cgcm) was recovered in the simulation driven by the AGCM using empirically cor-rected SSC (Rcm/Agcm_e). Overall the Rcm/Agcm_e simulation exhibited smaller biases in precipitation and 2-m temperature than the Rcm/Cgcm simulation. In fact the skill of Rcm/Agcm_e in reproducing the historical climate approaches that of reanalysis-driven hindcast simulations (Rcm/ReAn). This is interesting given that only the average
Fig. 11 Projected changes for precipitation (mm/d) (2071– 2100) to (1981–2010), by Rcm/ Cgcm (first row) and Rcm/ Agcm_e (middle row), for JFM (left column) and JAS (right column). The last row shows the difference of projected climate by Rcm/Agcm_e and Rcm/ Cgcm for 2071–2100
SSC bias was corrected, the time variability remaining untouched, and the fact that the resulting empirically cor-rected SSC fields have the coarse resolution of the CGCM rather than the fine resolution of reanalyses. It should be noted however that with regard to the resolution of the cor-rected SSCs, the conclusion might be different for other regions of the world where strong gradients of SST play an important role in the local weather, such as over the Gulf Stream off the East Coast of North America.
Several sensitivity test experiments were also con-ducted in order to analyse the respective impact on the CRCM5 simulations of (1) the bias correction of SSC, (2) the change of driving atmospheric model (AGCM vs. CGCM), and (3) the combination of both modifications as in the 3-step DD. For the historical climate, it has been found that SSC bias correction has the largest impact on the simulated precipitation and 2-m temperature while the use of the intermediate-resolution AGCM was important for the reduction of the wet bias over western Indian Ocean in JFM and for improving the DPID of the WA_N region. The most striking effect of the bias correction of SSC was found in the representation of the WAM precipitation.
Remarkable differences were found between the cli-mate changes projected by the 2- and 3-step DD methods. Over the continent, the 3-step DD projected warming is smaller in magnitude and extension than that of the 2-step DD. There is also a substantial difference between the pro-jected precipitation changes, particularly in the West Afri-can Monsoon region, with the 3-step DD projected changes being smaller in magnitude and extension than those of the 2-step DD. The comparison with the sensitivity test simula-tions revealed that the differences in the projected climate changes between the two DD techniques came mainly from the empirical correction of the SSC, although there were regions and variables for which the use of the intermediate-resolution AGCM also contributed substantially.
It has been shown that the driving BC are the major con-tribution to the uncertainties in regional climate projections (Déqué et al. 2007; Rowell 2006), although the contribu-tion of the different sources of uncertainties depends on the region, the season and the variable. For example, in a similar experiment carried over Europe (Déqué et al. 2014), it was found that SST correction had little impact on the simulated 2-m temperature and precipitation biases, but the improved atmospheric lateral BC as a consequence of using an intermediate-resolution AGCM had a large impact in reducing biases in the historical period for JJA and SON seasons; for the other seasons however, results were dif-ferent. There also, the climate response was modified with respect to the standard procedure of 2-step DD.
The reduction of systematic biases in historical GCM-driven RCM simulations is a positive outcome of the proposed 3-step DD. Due to the empirical nature of the
correction that assumes that historical biases of SSC persist in the future, it is of course impossible to say whether the differences in projected climate changes with the 3-step DD compared to those obtained with the usual 2-step DD are beneficial or not. But certainly the difference in projected changes is part of the modelling uncertainty at regional scale (Déqué et al. 2007). An advantage of the reduced bias of historical GCM-driven RCM simulations is a reduced need for empirical adjustment of RCM-simulated data for use by impact community. Another advantage of the 3-step DD—technical this one—is that there is no need for RCM modellers to import large volume of high temporal resolu-tion, three-dimensional atmospheric fields from a CGCM to drive their RCM at the lateral BC; only one-dimensional surface fields of SST and SIC suffice.
Regarding the choice for the AGCM in the intermediate step, it is possible to use either an atmosphere-only version of the CGCM that provides the SSC or to use a global ver-sion of the RCM, as was the case here. In the first case, with the same formulation of the CGCM, the AGCM pre-sumably retains its properties and overall behaviour such as climate sensitivity, climatological biases, etc. In the sec-ond case, the nesting technique is facilitated because such AGCM will share identical formulation with RCM (prog-nostic variables, subgrid-scale parameterisations, vertical coordinate, etc.). When performing dynamical downscaling of an ensemble of CGCMs as part of a coordinated experi-ment such as CORDEX for example, the use of the same AGCM (as a global extension of the RCM) may reduce the spread of climate changes across the ensemble; it remains to be shown whether this is a problem in practical applications.
Finally, it could be interesting if some CGCM partici-pating to the upcoming CMIP6 could add to the matrix of available data the output of century-long simulations using their AGCM version with corrected SSCs as in our interme-diate step. They could choose between the Bias-correction (as we did) and the Delta method (Current observation plus CGCM Climate-change projection, as the ENSEMBLES and PRUDENCE projects did).
Acknowledgments This research was funded in part by the follow-ing Grants: the project “Marine Environmental Observation, Predic-tion and Response” (MEOPAR; http://meopar.ca) of the Networks of Centres of Excellence (NCE; http://www.nce-rce.gc.ca) of Canada, the Discovery Accelerator Supplements Program ( http://www.nserc-crsng.gc.ca/Professors-Professeurs/Grants-Subs/DGAS-SGSA_eng. asp) of the Natural Sciences and Engineering Research Council of Canada (NSERC; http://www.nserc-crsng.gc.ca), the Canadian Net-work for Regional Climate and Weather Processes (CNRCWP; http:// www.cnrcwp.uqam.ca) co-funded by the NSERC Climate Change and Atmospheric Research (CCAR; http://www.nserc-crsng.gc.ca/ Professors-Professeurs/Grants-Subs/CCAR-RCCA_eng.asp) pro-gram. Computations were made on the supercomputer Guillimin of Calcul Québec—Compute Canada (http://www.calculquebec.ca) whose operation is funded by the Canada Foundation for Innovation
(CFI), NanoQuébec, RMGA and the Fonds de recherche du Québec-Nature et technologies (FRQ-NT). The authors thank Mr Georges Huard and Mrs Nadjet Labassi for maintaining an efficient and user-friendly local computing facility, and Dr Bernard Dugas for his unwavering support on developing CRCM5 since the beginning more than a decade ago. This study would not have been possible without the access to valuable data such as ERA-Interim, CRU, GPCP and TRMM, as well as outputs from the CMIP5 database, in this case the MPI-ESM-LR model output.
Open Access This article is distributed under the terms of the Crea-tive Commons Attribution 4.0 International License ( http://crea-tivecommons.org/licenses/by/4.0/), which permits unrestricted use, distribution, and reproduction in any medium, provided you give appropriate credit to the original author(s) and the source, provide a link to the Creative Commons license, and indicate if changes were made.
References
Adler RF et al (2003) The version-2 Global Precipitation Climatology Project (GPCP) monthly precipitation analysis (1979-present). J Hydrometeorol 4:1147–1167
Barring L, Reckermann M, Rockel B, Rummukainen M (eds) (2014) 3rd International lund regional-scale climate modelling work-shop. In: Twenty-first century challenges in regional climate modelling. Workshop Proceedings, Sweden. http://www.baltex-research.eu/RCM2014/Material/IBESPS_No.3_low.pdf
Bélair S, Mailhot J, Girard C, Vaillancourt P (2005) Boundary-layer and shallow cumulus clouds in a medium-range fore-cast of a large-scale weather system. Mon Weather Rev 133:1938–1960
Bélair S, Roch M, Leduc AM, Vaillancourt PA, Laroche S, Mailhot J (2009) Medium-range quantitative precipitation forecasts from Canada’s new 33-km deterministic global operational system. Weather Forecast 24:690–708. doi:10.1175/2008WAF2222175.1
Benoît R, Côté J, Mailhot J (1989) Inclusion of a TKE boundary layer parameterization in the Canadian regional finite-element model. Mon Weather Rev 117:1726–1750
Bruyère CL, Done JM, Holland GJ, Fredrick S (2014) Bias cor-rections of global models for regional climate simulations of high-impact weather. Clim Dyn 43:1847–1856. doi:10.1007/ s00382-013-2011-6
Christensen JH, Christensen OB (2007) A summary of the PRU-DENCE model projections of changes in European climate by the end of this century. Clim Change 81:7–30. doi:10.1007/ s10584-006-9210-7
Christensen J, Boberg F, Christensen O, Lucas-Picher P (2008) On the need for bias correction of regional climate change projections of temperature and precipitation. Geophys Res Lett 35:L20709 Dee DP, Uppala SM, Simmons AJ, Berrisford P, Poli P, Kobayashi
S, Andrae U, Balmaseda MA, Balsamo G, Bauer P, Bechtold P, Beljaars ACM, van de Berg L, Bidlot J, Bormann N, Delsol C, Dragani R, Fuentes M, Geer AJ, Haimberger L, Healy SB, Hers-bach H, Holm EV, Isaksen L, Kallberg P, Kohler M, Matricardi M, McNally AP, Monge-Sanz BM, Morcrette J-J, Park B-K, Peubey C, de Rosnay P, Tavolato C, Thepaut J-N, Vitart F (2011) The ERA-Interim reanalysis: configuration and performance of the data assimilation system. QJR Meteorol Soc 137:553–597. doi:10.1002/qj.828
Delage Y (1997) Parameterising sub-grid scale vertical transport in atmospheric models under statically stable conditions. Bound Layer Meteorol 82:23–48
Delage Y, Girard C (1992) Stability functions correct at the free con-vection limit and consistent for both the surface and Ekman lay-ers. Bound Layer Meteorol 58:19–31
Déqué M, Rowell DP, Luthi D, Giorgi F, Christensen JH, Rockel B, Jacob D, Kjellstrom E, de Castro M, van den Hurk B (2007) An intercomparison of regional climate simulations for Europe: assessing uncertainties in model projections. Clim Change 81:53–70. doi:10.1007/s10584-006-9228-x
Déqué M, Alias A, Dubois C, Somot S (2014) Some sources of bias in the Eurocordex historical runs. 3rd International Lund Regional-Scale climate modelling workshop. Lund, Sweden. http://www. baltex-research.eu/RCM2014/index.html
Done JM, Holland GJ, Bruyère CL, Leung LR, Suzuki-Parker A (2015) Modelling high-impact weather and climate: lessons from a tropical cyclone perspective. Clim Change 129:381–395. doi:10.1007/s10584-013-0954-6
Dosio A, Paruolo P (2011) Bias correction of the ENSEMBLES high-resolution climate change projections for use by impact models: evaluation on the present climate. J Geophys Res 116:D16106. doi:10.1029/2011JD015934
Giorgi F (1990) Simulation of regional climate using a limited area model nested in a general circulation model. J Clim 3:941–963 Giorgi F, Jones C, Asrar G (2009) Addressing climate information
needs at the regional level: The CORDEX framework. World Meteorol Organ Bull 58:175–183. http://wcrp.ipsl.jussieu.fr/ RCD_Projects/CORDEX/CORDEX_giorgi_WMO.pdf
Hernández-Díaz L, Laprise R, Sushama L, Martynov A, Winger K, Dugas B (2013) Climate simulation over the CORDEX-Africa domain using the fifth-generation Canadian regional climate model (CRCM5). Clim Dyn 40:1415–1433. doi:10.1007/ s00382-012-1387-z
Huffman GJ, Adler RF, Morrissey MM, Bolvin DT, Curtis S, Joyce R, McGavock B, Susskind J (2001) Global precipitation at one-degree daily resolution from multisatellite observations. J Hydrometeorol 2:36–50
Huffman GJ, Adler RF, Bolvin DT, Gu G, Nelkin EJ, Bowman KP, Stocker EF, Wolff DB (2007) The TRMM multi-satellite precipi-tation analysis: quasi-global, multi-year, combined-sensor pre-cipitation estimates at fine scale. J Hydrometeorol 8:33–55 IPCC AR5 (2013) Climate change 2013: the physical science basis.
In: Stocker TF, Qin D, Plattner GK, Tignor M, Allen SK, Bos-chung J, Nauels A, Xia Y, Bex V, Midgley PM (eds) Contribution of working group I (WGI) to the fifth assessment report (AR5) of the intergovernmental panel on climate change (IPCC). Cam-bridge University Press, CamCam-bridge. https://www.ipcc.ch/report/ ar5/wg1/
Jones C, Giorgi F, Asrar G (2011) The coordinated regional downscal-ing experiment: CORDEX. An international downscaldownscal-ing link to CMIP5. CLIVAR Exch 56:34–40
Kain JS, Fritsch JM (1990) A one-dimensional entraining/detraining plume model and application in convective parameterization. J Atmos Sci 47:2784–2802
Katzfey JJ, McGregor J, Nguyen K, Thatcher M (2009) Dynamical downscaling techniques: impacts on regional climate change sig-nals. In: 18th World IMACS/MODSIM Congress, Cairns, Aus-tralia. http://mssanz.org.au/modsim09
Katzfey JJ, Chattopadhyay M, McGregor JL, Nguyen K, Thatcher M (2011) The added value of dynamical downscaling. In: 19th World IMACS/MODSIM congress, Cairns, Australia. http:// mssanz.org.au/modsim11
Kuo HL (1965) On formation and intensification of tropical cyclones through latent heat release by cumulus convection. J Atmos Sci 22:40–63
Lafore JP, Flamant C, Giraud V, Guichard F et al (2010) Introduc-tion to the AMMA special issue on advances in understanding
atmospheric processes over West Africa through the AMMA field campaign. QJR Meteorol Soc 136:2–7
Laprise R (1992) The resolution of global spectral models. Bull Am Meteorol Soc 73:1453–1454
Laprise R, Hernández-Díaz L, Tete K, Sushama L, Šeparović L, Mar-tynov A, Winger K, Valin M (2013) Climate projections over CORDEX Africa domain using the fifth-generation Canadian Regional Climate Model (CRCM5). Clim Dyn 41:3129–3246. doi:10.1007/s00382-012-1651-2
Lavaysse C, Flamant C, Janicot S, Parker DJ, Lafore JP, Sultan B, Pelon J (2009) Seasonal evolution of the West African heat low: a climatological perspective. Clim Dyn 33:313–330
Li J, Barker HW (2005) A radiation algorithm with correlated-k distribution. Part I: local thermal equilibrium. J Atmos Sci 62:286–309
Martynov A, Sushama L, Laprise R (2010) Simulation of temperate freezing lakes by one-dimensional lake models: performance assessment for interactive coupling with regional climate mod-els. Boreal Environ Res 15:143–164 (ISSN 1797‑2469 online; ISSN 1239‑6095 print, 2010)
Martynov A, Sushama L, Laprise R, Winger K, Dugas B (2012) Inter-active lakes in the Canadian regional climate model, version 5: the Role of lakes in the regional climate of North America. Tel-lus A 64:16226–16245. doi:10.3402/tellusa.v64i0.16226
Masson V, Champeaux J-L, Chauvin F, Meriguet Ch, Lacaze R (2003) A global database of land surface parameters at 1-km resolution in meteorological and climate models. J Clim 16:1261–1282.
http://www.cnrm.meteo.fr/gmme/PROJETS/ECOCLIMAP/ page_ecoclimap.htm
McFarlane NA (1987) The effect of orographically excited gravity-wave drag on the general circulation of the lower stratosphere and troposphere. J Atmos Sci 44:1775–1800
McGregor JL, Dix MR (2008) An updated description of the Con-formal-Cubic Atmospheric Model. In: Hamilton K, Ohfuchi W (eds) High resolution simulation of the atmosphere and ocean. Springer, Berlin, pp 51–76
McGregor JL, Nguyen KC, Katzfey JJ (2002) Regional climate simulations using a stretched-grid global model. In: Ritchie H (ed) Research activities in atmospheric and oceanic modelling. Report No. 32, WMO/TD-No. 1105, World Meteorological Organisation, Geneva, pp 15–16
Mitchell TD, Jones PD (2005) An improved method of constructing a database of monthly climate observations and associated high-resolution grids. Int J Climatol 25:693–712
Mitchell TD, Carter TR, Jones PD, Hulme M, New M (2004) A com-prehensive set of high-resolution grids of monthly climate for Europe and the globe: the observed record (1901–2000) and 16 scenarios (2001–2100). Tyndall Centre for Climate Change Research, Norwich, Working Paper 55. http://www.cru.uea. ac.uk/
Moufouma-Okia W, Rowell DP (2010) Impact of soil moisture ini-tialisation and lateral boundary conditions on regional climate model simulations of the West African Monsoon. Clim Dyn 35:213–229
Nguyen H, Thorncroft CD, Zhang C (2011) Guinean coastal rainfall of the West African Monsoon. QJR Meteorol Soc 137:1828– 1840. doi:10.1002/qj.867
Nikulin G, Jones C, Giorgi F, Asrar G, Büchner M, Cerezo-Mota R, Christensen OB, Déqué M, Fernandez J, Hänsler A, van Meij-gaard E, Samuelsson P, Sylla MB, Sushama L (2012) Precipi-tation climatology in an ensemble of CORDEX-Africa regional climate simulations. J Clim 25:6057–6078. doi:10.1175/ JCLI-D-11-00375.1
Patricola CM, Cook KH (2010) Northern African climate at the end of the twenty-first century: an integrated application of regional and global climate models. Clim Dyn 35:193–212
Rockel B (2015) The regional downscaling approach: a brief his-tory and recent advances. Curr Clim Change Rep. doi:10.1007/ s40641-014-0001-3
Rowell DP (2006) A demonstration of the uncertainty in projections of UK climate change resulting from regional model formula-tion. Clim Change 79:243–257
Rummukainen M (2010) State-of-the-art with regional climate mod-els. Clim Change 1:82–96. doi:10.1002/wcc.8
Simmons AS, Uppala DD, Kobayashi S (2007) ERA-interim: new ECMWF reanalysis products from 1989 onwards. ECMWF Newslett 110:29–35
Sundqvist H, Berge E, Kristjansson JE (1989) Condensation and cloud parameterization studies with a mesoscale numerical weather prediction model. Mon Weather Rev 117:1641–1657 Taylor KE, Stouffer RJ, Meehl GA (2012) An overview of CMIP5
and the experiment design. Bull Am Meteorol Soc 93:485–498. doi:10.1175/BAMS-D-11-00094.1
Thorncroft CD, Nguyen H, Zhang C, Perillé P (2010) Annual cycle of the West African monsoon: regional circulations and associ-ated water vapour transport. QJR Meteorol Soc 137:129–147. doi:10.1002/qj.728
Uppala S, Dee D, Kobayashi S, Berrisford P, Simmons A (2008) Towards a climate data assimilation system: status update of ERA-interim. ECMWF Newslett 115:12–18
van der Linden P, Mitchell JFB (eds) (2009) ENSEMBLES: climate change and its impacts: summary of research and results from the ENSEMBLES project. Met Office Hadley Centre, FitzRoy Road, Exeter EX1 3PB, UK
Verseghy LD (2000) The Canadian land surface scheme (CLASS): its history and future. Atmos Ocean 38:1–13
Verseghy LD (2008) The Canadian land surface scheme: technical documentation—Version 3.4. Climate Research Division, Sci-ence and Technology Branch, Environment Canada
von Storch H (1995) Inconsistencies at the interface of climate impact studies and global climate research. Meteorol Z 4:72–80 von Storch H, Zorita E, Cubasch U (1993) Downscaling of global
cli-mate change esticli-mates to regional scales: an application to Ibe-rian rainfall in wintertime. J Clim 6:1161–1171
Wilby RL, Fowler HJ (2010) Regional climate downscaling. Chapter 3 In: Fung CF, Lopez A, New M (eds) Model-ling the impact of climate change on water resources. Wiley. ISBN:978-1-4051-9671-0
Wilby RL, Wigley TML (1997) Downscaling general circulation model output: a review of methods and limitations. Prog Phys Geogr 21:530–548
Xu Z, Yang Z-L (2012) An improved dynamical downscaling method with GCM Bias correction and its validation with 30 years of climate simulations. J Clim 25:6271–6286. doi:10.1175/ JCLI-D-12-00005.1
Xu Z, Yang Z-L (2015) A new dynamical downscaling approach with GCM bias corrections and spectral nudging. J Geophys Res Atmos 120:3063–3084. doi:10.1002/2014JD022958
Yu M, Wang G (2014) Impacts of bias correction of lateral boundary conditions on regional climate projections in West Africa. Clim Dyn 42:2521–2538. doi:10.1007/s00382-013-1853-2
Zadra A, Roch M, Laroche S, Charron M (2003) The subgrid-scale orographic blocking parameterization of the GEM model. Atmos Ocean 41:155–170