HAL Id: tel-01573468
https://pastel.archives-ouvertes.fr/tel-01573468
Submitted on 9 Aug 2017
HAL is a multi-disciplinary open access
archive for the deposit and dissemination of sci-entific research documents, whether they are pub-lished or not. The documents may come from teaching and research institutions in France or abroad, or from public or private research centers.
L’archive ouverte pluridisciplinaire HAL, est destinée au dépôt et à la diffusion de documents scientifiques de niveau recherche, publiés ou non, émanant des établissements d’enseignement et de recherche français ou étrangers, des laboratoires publics ou privés.
Pickering Stabilized Drilling Fluids for deep and
ultra-deep Drilling Operations
Ramy Ghosn
To cite this version:
Ramy Ghosn. Pickering Stabilized Drilling Fluids for deep and ultra-deep Drilling Operations. Chem-ical engineering. Université Paris-Saclay, 2016. English. �NNT : 2016SACLY022�. �tel-01573468�
NNT : 2016SACLY022
T
HESE DE DOCTORAT
DE
L’U
NIVERSITE
P
ARIS
-S
ACLAY
PREPAREE A
“E
COLE
N
ATIONALE
S
UPERIEURE DE TECHNIQUES AVANCEES
”
E
COLED
OCTORALE N°
579
Sciences Mécaniques et Energétiques, Matériaux et Géosciences
Spécialité de doctorat : Génie Des Procédés
Par
M. Ramy GHOSN
Pickering-Stabilized Drilling Fluids for Deep and Ultra-Deep Drilling Operations
Thèse présentée et soutenue à « Palaiseau», le « 20 Décembre 2016 » Composition du Jury :
M, BARBOUX, Philippe Professeur, Chimie ParisTech Président Mme, PEZRON, Isabelle Professeur, UTC Compiègne Rapporteur M, CHEVALIER, Yves Directeur de Recherche, Université Lyon 1 Rapporteur M, MIHELIC, François Docteur, Oil Recovery Services (ORS) Examinateur M, DALMAZZONE, Didier Professeur, ENSTA ParisTech Directeur de thèse M, HOCHEPIED, Jean-François Chargé de recherche, Mines ParisTech Co-directeur de thèse
A l'issue de la rédaction de cette thèse, je suis convaincu que ce travail est loin d'être un travail solitaire. En effet, je n'aurais jamais pu le réaliser sans le soutien d'un grand nombre de personnes dont la générosité, la bonne humeur et l'intérêt manifesté à l'égard de ma recherche, m'ont permis de progresser et de l'achever.
En premier lieu, je remercie mon directeur de thèse, Monsieur Didier DALMAZZONE, pour la confiance qu'il m'a accordé dès le début de la thèse pour diriger mon travail en me donnant une grande autonomie, ainsi que pour sa patience et le temps qu'il m'a consacré surtout dans la dernière partie de la thèse.
Je remercie également mon co-directeur de thèse, Monsieur Jean-François HOCHEPIED, pour sa contribution dans les expériences, son soutien et son dynamisme personnel et professionnel.
Un grand merci pour mon encadrant, Monsieur François MIHELIC, qui a toujours été prêt à m'aider et à m'encourager, par sa perspective jeune et dynamique du monde industriel en général, et pétrolier en particulier, qui m'a permis de beaucoup m'enrichir de son expérience dans ce domaine.
Ce travail n'aurait pu être mené à bien non plus sans l'aide de toute l'équipe d'Oil Recovery Services (ORS Group), à commencer par Monsieur Zahi KATTAR, le gérant de l'entreprise. Cette PME n'a pas seulement financé ma thèse et contribué au soutien matériel, mais elle m'a aussi accueilli chaleureusement pour faire partie de son équipe à Paris. Je n'oublie pas non plus de remercier Madame Florence JOURNET pour sa patience et sa contribution indispensable dans la partie administrative de cette thèse. J'exprime encore tous mes remerciements à l'ensemble des membres de mon jury: Monsieur Philippe BARBOUX, Madame Isabelle PEZRON et Monsieur Yves CHEVALIER.
Je remercie toute l'équipe de l'ENSTA ParisTech en général et, plus particulièrement, l'équipe de l'Unité de Chimie et Procédés (UCP) présidée par Monsieur Laurent CATOIRE qui m'ont permis de réaliser ma thèse dans leur laboratoire.
J'exprime ma gratitude à l'Association Nationale de Recherche et Technologie (ANRT) qui a contribué au financement d'une partie de cette thèse CIFRE.
Je remercie particulièrement mes ami(e)s et collègues que j'ai rencontrés par le biais de l'UCP durant ces trois ans, en commençant par Luiz-Paulo SALES SILVA, Adeline TROUVÉ, Aurélie DOS SANTOS et Amokrane BOUFARES, pour les moments inoubliables qu'on a passés ensemble, pour leur soutien, pour leur aide, pour leur humour et leur amitié qui nous réunit aujourd'hui.
Enfin, les mots les plus simples étant les plus forts, j'adresse toute mon affection à ma famille et en particulier à mes parents et à ma chère sœur. Vous m'avez donné beaucoup de votre intelligence, votre confiance, votre tendresse et votre amour qui me guident tous les jours. Merci pour m'avoir aidé à être ce que je suis aujourd'hui. Je vous aime.
Merci à la personne qui a pris mon cœur et mon esprit depuis 5 mois. La personne qui m'a supporté pendant les 5 mois les plus difficiles de la thèse. Tu m'as permis de me lever chaque matin, motivé, le cœur léger et l'esprit tranquille. Tes mots de confiance et de fierté que tu m'as répétés chaque jour sont la source de ma réussite aujourd'hui. Je t'aime pour toujours!
Une pensée en terminant ces remerciements pour mon père, qui n'a pas vu l'aboutissement de mon travail, mais je sais que tu aurais été fier de ton fils!
LIST OF CONTENTS
List of Figures………... i
List of Tables………. v
Nomenclatures………... vii
INTRODUCTION……….... 1
Chapter 1. Bibliographic Report……….. 5
1.1. Introduction to Drilling Fluids: Functions, Types and Properties………… 6
1.1.a. Introduction………... 6
1.1.b. Functions of Drilling Fluids………... 9
1.1.c. Types/Classification of Drilling Fluids……… 9
1.1.d. Rheology of Drilling Fluids……….... 12
1.2. Emulsions: Composition, Stability and Characterization……… 22
1.3. Pickering Emulsions in the Oil and Gas Industry………. 32
1.3.a. Introduction to Pickering Emulsions………... 32
1.3.b. Pickering Emulsions for Oil & Gas……….. 38
Conclusion……… 43
Chapter 2. Experimental Techniques……….. 45
Introduction……… 45
2.1. Composition of Drilling Fluids……….. 46
2.1.a. Surfactant-stabilized OBM sample preparation……….... 47
2.1.b. Pickering W/O emulsions preparation………... 49
2.1.c. Pickering O/W emulsions preparation………. 52
2.1.d. Type of emulsions………. 53
2.1.e. Composition of the aqueous phase……… 53
2.2. Electrical Stability………. 53
2.3. Microscopy and Droplet Size Distribution………... 56
2.4. Rotational and Oscillatory Rheology……… 57
2.4.a. Flow Curve Measurements……….... 59
2.4.b. Amplitude Sweep Measurements………... 60
2.4.c. Thixotropic /Gel Strength Measurements……… 61
2.5. Aging………. 63
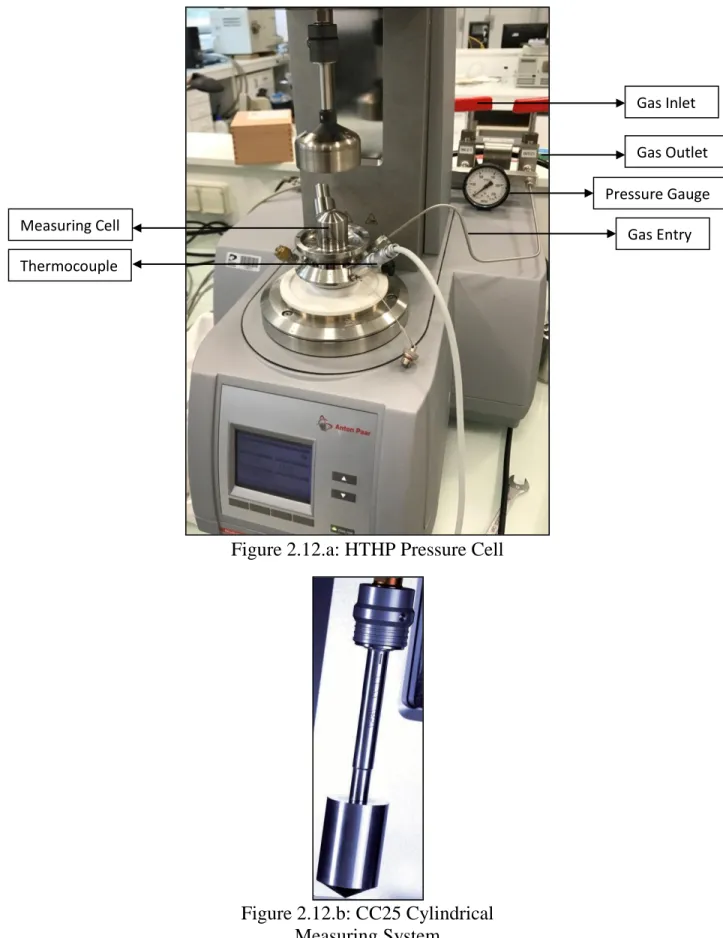
2.6. HTHP Rheology………. 64
Chapter 3. Pickering Oil-Based Drilling Fluids……….. 68
Introduction……… 68
3.1. Stability to Coalescence/Sedimentation………. 70
List Of Contents
3.3. Effect of the Aqueous Phase Composition……… 79
3.3.a. Effect of pH of Water………... 79
3.3.b. Effect of salt concentration………. 82
3.4. Effect of the Oil Continuous Phase Composition………... 84
3.5. Effect of Adding Clay Particles………... 88
3.6. Effect of Aging……… 93
3.6.a. Without Clay Particles……… 93
3.6.b. With Clay Particles……….. 97
3.7. High-Temperature/High-Pressure Rheology………... 100
Conclusion……… 107
Chapter 4. Pickering Water-Based Drilling Fluids……….. 109
Introduction……… 109
4.1. Stability of Pickering WBM……… 110
4.1.a. Effect of particle size and wettability……… 110
4.1.b. Effect of OWR……… 115
4.2. Water Phase composition………. 118
4.2.a. Effect of pH of water……… 118
4.2.b. Effect of salt concentration………. 124
4.3. HTHP Rheology………. 128
Conclusion……….. 132
Conclusion and perspectives……… 133
List of Figures
Figure 1.1.1: Various Sources of Energy Consumption Statistical Review……… 6
Figure 1.1.2: (a) Example of a petroleum reservoir (b) The drilling Mud Cycle……… 7
Figure 1.1.3: Classification of Drilling Fluids……….. 10
Figure 1.1.4: Sketch showing the difference between laminar and turbulent flows inside a pipe………... 13
Figure 1.1.5: Shear Stress - Shear Rate plot for a Newtonian Fluid……… 14
Figure 1.1.6: Flow curve for a Bingham-Plastic fluid………. 16
Figure 1.1.7: Flow curve for a Power Law fluid exhibiting N<1……….. 16
Figure 1.1.8: Hurschel-Bulkley Rheological Model for N<1………... 18
Figure 1.1.9: Amplitude Sweep of a Drilling Fluid Sample……… 20
Figure I.1.10: Principle of emulsion formation and stabilization using surfactants… 23 Figure 1.2.1: Schematic representation of (a) Surfactant structure (b) Surfactant molecules at the interface, and (c) Surfactant micelles……… 25
Figure 1.2.2: Interfacial Tension vs. Surfactants concentration……….. 27
Figure 1.2.3: Coalescence phenomena of an emulsion dispersed droplets due to the thin film disruption………... 28
Figure 1.2.4: The main instability phenomena that can occur during emulsification.. 31
Figure 1.3.1: (Upper) Various contact angles of a small particle at a planar oil-water interface; (Lower) Position of solid particles at a curved interface – θ ˂90° (left) O/W emulsion can be formed, for θ˃90° (right) W/O emulsion can be formed……... 34
Figure 1.3.2: example of silylation of a silica surface using triethoxysilane………... 37
Figure 2.1: High-intensity ultrasonic processor (Sonics & Materials, tip diameter 13 mm)………... 48
List of Figures
Figure 2.3: TEM Images of Hydrophilic Silica nanoparticles used for the
preparation of O/W Pickering drilling fluids. All scale bars are of 30 nm……….. 55
Figure 2.4: Electrical Stability Meter………... 56
Figure 2.5: Olympus BHS Microscope……… 56
Figure 2.6: Anton Paar MCR 302 Rheometer………... 57
Figure 2.7: Double Gap Measuring System Illustration………... 58
Figure 2.8: Flow Curve measurement showing the variation of the shear stress in function of the shear rate of a drilling fluid sample………. 60
Figure 2.9: Amplitude Sweep of a drilling fluid sample showing the LVE region as well as the true yield stress. Filled Circles represents G' and Filled Squares G"…… 61
Figure 2.10: Gel Strength Measurement showing the variation of the viscosity with time of two different samples………... 63
Figure 2.11: Aging cell equipment………... 64
Figure 2.12.a: HTHP Pressure Cell……… 65
Figure 2.12.b: CC25 Cylindrical Measuring System………... 65
Figure 3.1: Silylation procedure of AEROSIL silica nanoparticles……… 71
Figure 3.2: Effect of nanoparticles concentration on the stability to coalescence/sedimentation of the emulsions………. 73
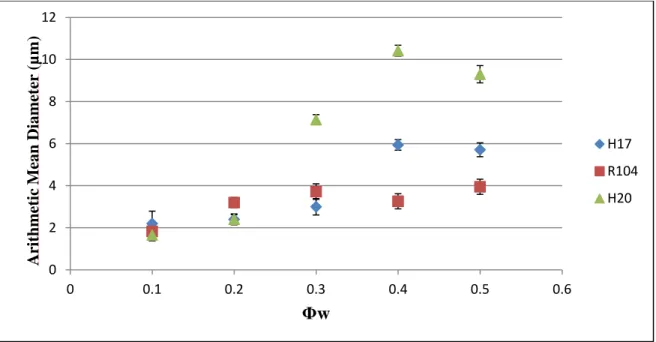
Figure 3.3: Variation of the arithmetic mean particle diameter with the water phase volume fraction for all three nanoparticles types………. 75
Figure 3.4: Effect of the OWR on the morphology of the emulsions………... 76
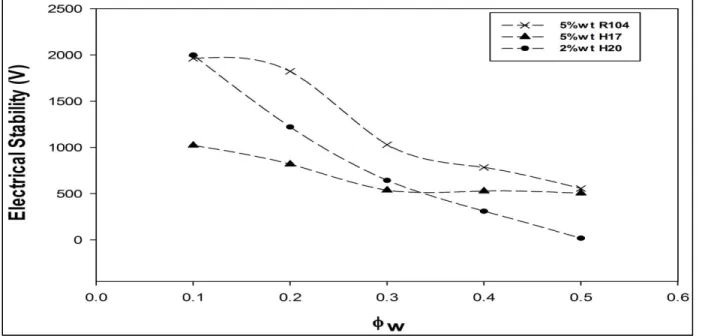
Figure 3.5: Effect of the water phase volume fraction on the electrical stability measurements………... 77
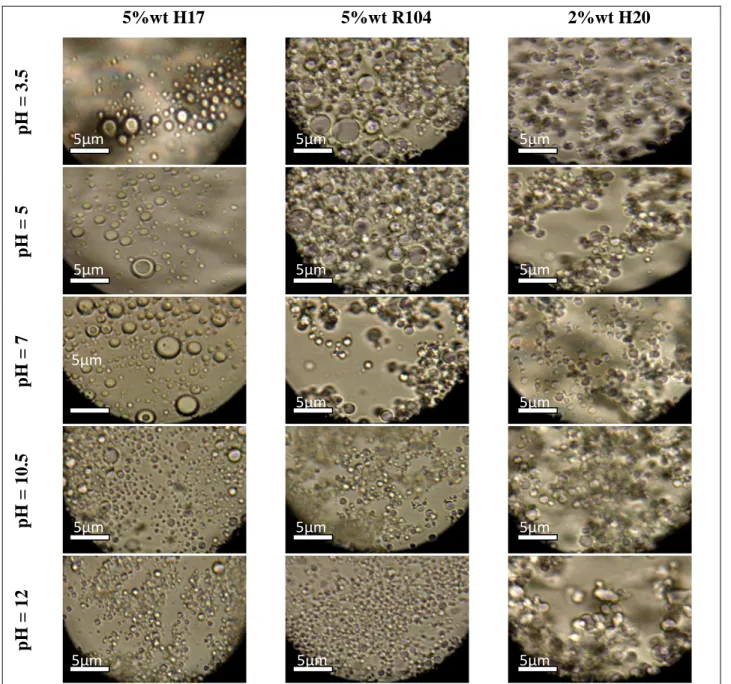
Figure 3.7: Effect of pH of the aqueous phase on the stability of the emulsions
prepared……….. 80
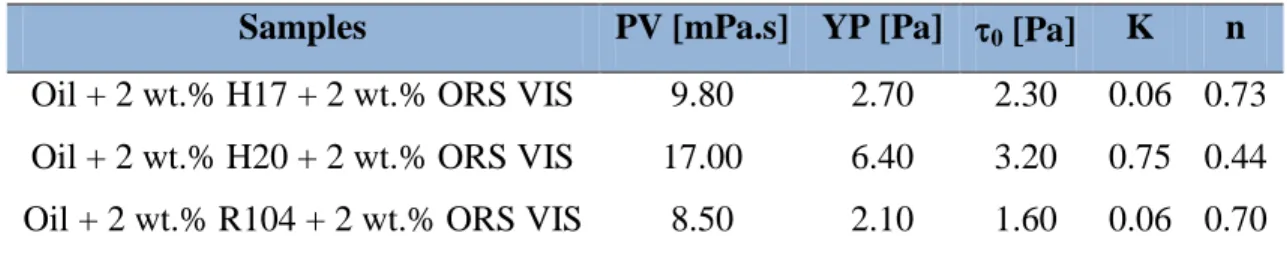
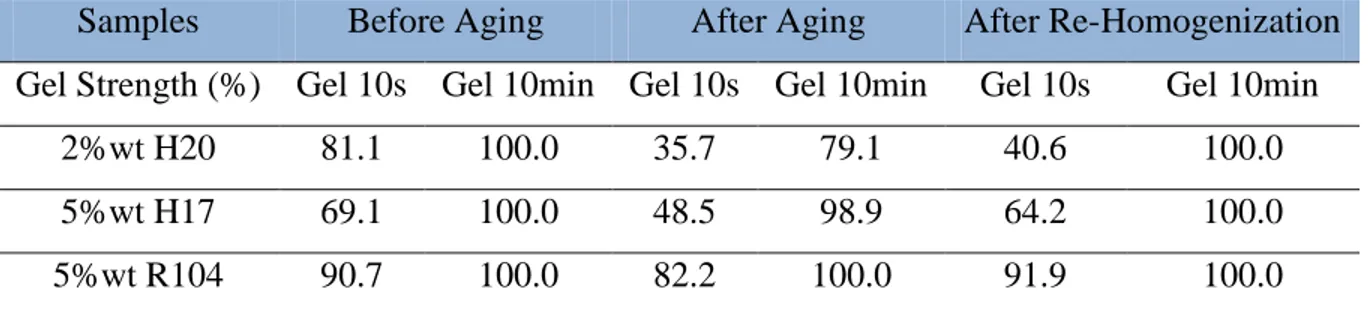
Figure 3.8: Effect of changing the pH of the aqueous phase……… 82 Figure 3.9: Effect of the salt concentration on the stability of the emulsions…….. 83 Figure 3.10: Effect of Oil phase composition on the morphology of the emulsions… 87 Figure 3.11: Flow curves of various samples prepared……… 91 Figure 3.12: Effect of clay particles on the thixotropic properties of Pickering emulsions. a) H17 b) R104 and c) H20. Black plots are before clay addition and red ones are for after clay addition. Symbols are as follows: -●- G’ and -■- G”………... 92 Figure 3.13: Flow curves of all samples prepared without clay particles showing the effect of aging and remixing on the rheological properties. (a) 2 wt.% H20 (b) 5 wt.% H17 and (c) 5 wt.% R104……….. 96 Figure 3.14: Morphology of the emulsions of all samples (without clay particles) before and after aging as well as after re-homogenization………. 100 Figure 3.15: HPHT Classification System limits for well-service-tool components devices………... 101 Figure 3.16: Comparison of the effect of the temperature and pressure on the plastic viscosity of samples prepared with
H20………... 102
Figure 3.17: Effect of temperature on the rheology of drilling fluids -●- Plastic Viscosity and -■- Yield Stress………... 104 Figure 3.18: Surfactant-Stabilized drilling fluid after rheology measurement at 140 C (samples prepared with an OWR 80:20, 2 wt.% primary emulsifier, 2 wt.% secondary emulsifier, lime, and 2 wt.% ORS VIS clay particles)………. 105 Figure 3.19: Effect of temperature on samples prepared with clay particles -●- Plastic Viscosity and -■- Yield Stress………. 106
List of Figures
Figure 4.1: Creaming phenomenon of oil on top of an O/W emulsion (sample prepared with 15 wt.% AEROSIL 130)……… 111 Figure 4.2: Effect of nanoparticles concentration on the stability of O/W emulsions prepared after 24 hours……… 112 Figure 4.3: Destabilization of an emulsions prepared with 15 wt.% of AEROSIL OX 50 with an OWR of 80:20………... 112 Figure 4.4: Morphology of O/W emulsions prepared with 15 wt.% AEROSIL 130 (a) 24 hours after preparation (b) after 18 months……… 113 Figure 4.5: Variation of the droplet size distribution of the emulsions in function of the nanoparticles concentration of AEROSIL R816………... 114 Figure 4.6: Effect of OWR on the morphology of O/W Pickering WBM…………... 115 Figure 4.7: Effect of the OWR on the mean droplets diameter……… 116 Figure 4.8: Effect of pH on the stability of O/W Pickering WBM prepared using the AEROSIL R816 silica nanoparticles………... 119 Figure 4.9: Effect of pH of the water phase on the stability of the Pickering O/W emulsions………... 120 Figure 4.10: Effect of pH on the morphology of the WBMs prepared with AEROSIL
R816………. 121
Figure 4.11: Effect of pH on the zeta potential of dispersions of AEROSIL R816 in water………... 123 Figure 4.12: Stability of Pickering O/W emulsions prepared using 15 wt.% of AEROSIL 130 in function of the pH of the water phase……….. 124 Figure 4.13: Effect of salt concentration on the droplet size distribution of the
emulsions………. 126
Figure 4.14: Swelling of clay platelets of Ca2+ and Na+ types when getting in contact with fresh water………... 129 Figure 4.15: Effect of temperature and pressure on the plastic viscosity and the yield stress of WBM……….. 130
List of Tables
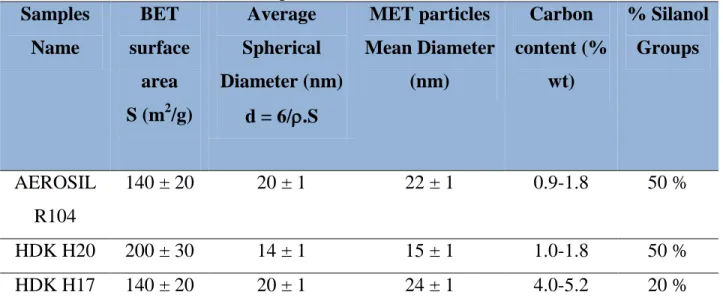
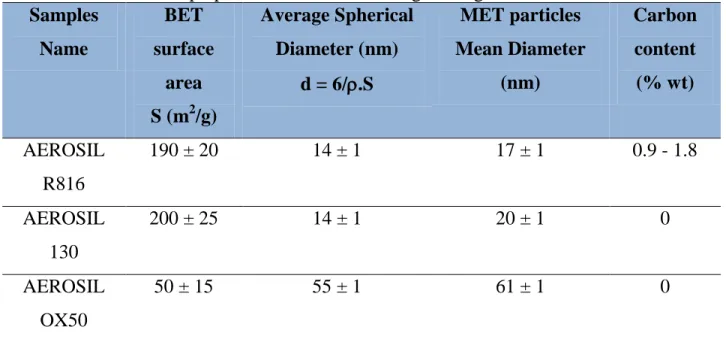
Table 1.1.1: Advantages and Drawbacks of OBM/SBM ……… 12 Table 1.1.2: Correspondent fluids types depending on the 'N' value of the Power Law ………... 17 Table 1.2.1: Surfactants characterization according to their HLB numbers' range………... 26 Table 2.1: Properties of the AMODRILL 1100 Mineral Oil……….. 46 Table 2.2: Structural Properties of AMODRILL 1100 Mineral Oil……….. 47 Table 2.3: Composition of the components used for the preparation of surfactant-stabilized OBM………... 47 Table 2.4: Characteristics and Properties of commercial hydrophobic silica particles used in this work………. 50 Table 2.5: Properties and Characteristics of Hydrophilic Silica nanoparticles used for the preparation of O/W Pickering drilling fluids………..
52
Table 2.6: Characteristics of the double gap measuring system DG 26.7………… 58 Table 3.1: Effect of the oil phase composition on the rheological properties of the samples prepared with the three types of silica particles………. 85 Table 3.2: Effect of addition of clay particles on the electrical stability of the
emulsions……….. 89
Table 3.3: Effect of silica and clay particles interactions on rheology……… 90 Table 3.4: Effect of aging on the rheological properties of samples prepared without clay particles……… 94 Table 3.5: Effect of aging on the gel strength of the samples prepared without clay particles………... 94
List of Tables
Table 3.6: Rheology of samples prepared with clay particles before/after aging
and after re-homogenization………. 97
Table 3.7: Effect of adding clay on the rheological properties of the samples before/after aging and after re-homogenization……….. 98
Table 3.8: Effect of Aging on the electrical stability of samples prepared with and without clay particles compared to surfactant stabilized OBM……… 99
Table 3.9: Effect of Aging on the Mean Particle Diameter [m] of the samples prepared……… 99
Table 4.1: Droplet Mean Diameter of the WBM prepared with R816 in function of the pH of water………... 122
Table 4.2: Effect of salt on the rheological properties of WBM………... 126
Table 4.3: Effect of salt concentration on the true yield stress………. 128
Nomenclature
Symbol Definition
EOR Enhanced Oil Recovery
ES Electrical Stability
HT/HP High Temperature/High Pressure
K Consistency Index
N Flow Index
OBM Oil-Based Muds
PV Plastic Viscosity
RPM Rotations per minute
WBM Water-Based Muds YP Yield Point γ Shear Rate µ Viscosity ρ Density θ Dial Indicator τ Shear Stress
INTRODUCTION
This enduring situation of volatile oil prices has been seen as a decline and a challenge at the same time for the oil and gas industry. While the availability of oil fields and the associated equipment is always paramount for the oil and gas companies. It is during this slump that they own the opportunity to focus on cost-effective production solutions, which very often means bringing new-technologies and further improving processes.
Adequate understanding of the impact of drilling fluids properties and rheology, so as to selectively design fluids that could address the wide range of difficulties encountered in oilfield drilling operations, is a key portfolio that has gathered considerable attention. Nonetheless, the inherent concern on how they could be substantially modified for success becomes very critical to justifying project economics.
Oil Recovery Services (ORS) is one of the fastest growing international Oil servicing companies providing the world’s leading energy companies with truly innovative systems and best quality services. Since 1993, ORS was shaped with high values of costumer first, integrity, trust, protection of people and the environment, etc. With a clear vision of developing and supplying quality innovative products coupled with a determined mission of being and remaining the highest value partner. ORS and ENSTA ParisTech grabbed the opportunity of the invasion of nanotechnology in numerous scientific industries (electronic circuitry, material composites, medical, cosmetics, etc …) to invest in the future of drilling and completion fluids.
Drilling engineering increasing problems from stuck pipes, differential sticking, formation damage, fluid loss, destabilization of the fluids, hydrate formation in the pipes, acid gas invasion and so on, are all related in a way or another to the drilling fluids composition and functioning. The drilling industry is facing a paramount challenge as easily drilled reservoirs are depleted. Therefore, the tendency today is searching for new tools and technologies that can help the drilling industry to drill in hostile environments
Introduction
such as deep and ultra-deep wells where temperatures and pressures are high enough to cause hysteresis to the already existing drilling systems.
Pickering emulsions or particles-stabilized emulsions were widely investigated since decades [1-2]. The fact that solid particles can act as emulsifiers/surfactants attracted wildly many industrial fields especially those of pharmaceutical and food industries [3-4]. However, the possibility of using such systems in the oil and gas industry, especially for deep and ultra-deep reservoirs, was shyly introduced via few works that have been published.
From a fluids’ perspective, chemical solutions take center stage over engineering design, with a focus on either functionality, mode of introduction, or the combination of both. Thus when one considers the application of nanotechnology to the area of drilling or completion fluids, a center question must be asked: what does nanotechnology accomplish that cannot be addressed with existing chemistries?
Hence, this work presents the synthesis of a novel generation of surfactant-free drilling fluids of both types, Oil-Based-Mud (OBM) and Water-Based-Mud (WBM), based on the principle of Pickering emulsions using various types of silica nanoparticles. These systems were characterized for their potential to be used for deep and ultra-deep drilling operations where HTHP stability is required.
This thesis is composed of four main chapters:
The first chapter presents an introduction to the drilling engineering field in all its
generalities and details. The drilling fluids compositions and functions are presented with the main problems that are facing the drilling world today giving an opening to the new solutions that nanotechnology can bring to the field.
The second chapter consists of the experimental methods and techniques used in this
using silica nanoparticles. The stability, morphology as well as the rheology of the drilling fluids testing equipments and protocols are described in details.
The third chapter presents the results obtained of the W/O Pickering emulsions
prepared using hydrophobic silica nanoparticles and their characteristics at High-temperature and High-pressure (HTHP) conditions.
Finally, the fourth and final chapter presents the results of the preparation of O/W emulsions using hydrophilic silica nanoparticles and their potential to be used in various drilling and completion operations especially those of Enhanced-Oil-Recovery (EOR).
At the end conclusions and perspectives summarizing the main results and potential of further works to be done on this subject are stated.
Chapter 1 Bibliographic Report
Introduction
The recent interest of nanotechnology in the oil and gas sector has garnered the attention of many drilling companies for its ability to solve many of the current exploration and production problems. With very limited handful of papers published concerning the use of nanoparticles in the upstream oil and gas sector for many reasons of confidentiality, the application of nanotechnology has given real optimistic horizons as the future of the oil and gas exploration sector.
This chapter represents a bibliographic study of the work done so far on the application of nanotechnology in the oil and gas sector. It is composed of three main sections.
The first section of this chapter presents an introduction to the upstream sector of oil and gas focusing essentially on the drilling phase and more precisely on the drilling fluids. Nonetheless, the functions and the main properties of drilling fluids are presented.
The second section shows a detailed review of emulsions. The composition of emulsions as well as the main parameters influencing their stability is presented.
The third and final section presents a wide study on Pickering emulsions and the potential of using them in the preparation of drilling fluids. Therefore, the protocols adapted for the characterization of such emulsions and the measurements of their properties as well as the works done so far to apply such new systems in the upstream sector are presented.
Bibliographic Report Introduction to Drilling Fluids: Functions, Types and Properties
1.1. Introduction to Drilling Fluids: Functions, Types and Properties
1.1.a. IntroductionSince the first exploration of oil and gas, the petroleum industry has flourished as one of the greatest energy sources of all time. However, the dramatic increase of population, advanced technologies and thus the need for more energy, have forced the industries to search for revolutionary and new developed solutions. Hence, renewable, nuclear and hydro energies were invented and developed as an optimistic plan to help the world recovering their lack of energy.
Nevertheless, according to the Institute of Energy Research [IER] in the United States, the most realistic scenarios of renewable energy projects (wind, solar, geothermal ...) will only make up 15 to 20% of the total energy by 2040 (Fig. 1.1.1).
Thus, the role of these new energies will be to complement not to replace the petroleum industry, and our world will remain a ‘fossil-fuelled’ world for decades coming.
Petroleum is known as a complex mixture of hydrocarbons of various molecular weight and other organic compounds, oxidized from underground sedimentary rocks to form layers of gas and oil followed by a layer of water buried under the earth surface (Fig. 1.1.2.a).
The fundamental drilling processes for Oil & Gas are still the same, but the development of technologies and engineering have helped improving performance and safety.
The extraction and production of petroleum is done through four main stages:
o Exploration: It consists of identifying the geological structure by applying magnetic, gravimetric or seismic methods
o Exploitation: It is the drilling phase, where a hole is drilled in the ground allowing oil and gas to be extracted. During this stage, a drilling mud is
continuously circulated inside the pipes. Therefore, this phase is usually accompanied by casing and cementing to assure the stability of the formation drilled. Note that the drilling process comprises 80% of the total well costs [6]. o Development and Production: It is the extraction phase of oil and gas. Normally
(a) (b)
Bibliographic Report Introduction to Drilling Fluids: Functions, Types and Properties
wells are free flowing but sometimes additional aid is needed to maintain reservoir pressure and this is called Enhanced Oil Recovery.
o Decommissioning and Rehabilitation: It is the final stage which involves removal of the equipments and restoration of the site to environmental-sound conditions.
Petroleum reservoirs vary from shallow to deep and ultra-deep reservoirs. Nevertheless, the formations drilled can sometimes have extremely different characteristics (water sensitive shale, different rock types, different tectonic properties...). Therefore, petroleum and drilling engineers ought to find economical tools (optimized drilling bits, new chemicals, etc …) that can be modified to go with every formation drilled for an efficient as well as economical drilling operation. Hence, one of these tools is the drilling fluid or what is called drilling mud.
As shown in Fig. 1.1.2.b, to drill a reservoir, the drilling fluid has to accomplish what is called a mud cycle. The best place to start with, is the mud pumps. Mud pumps represent the ‘heart’ of the mud cycle, and the drilling fluid is the lifeblood of the drilling operation. When the mud exits the pumps at high pressure (sometimes up to 5000 psi [344.7 bars]) into the discharge line, it reaches the standpipe, rotary hose, swivel and then down the kelly till it gets to the drill string and then the bit. Each drilling bit is accompanied by two or more nozzles (little openings in the bit also called jets) which accelerate the mud at the bottom hole to keep it clean while drilling. After the drill bit, the mud starts its way back to the surface through the annulus carrying all the cuttings back into the return line to the shale shakers. The shakers are mesh screens that work on separating the drilled cuttings (solid particles) from the liquid phase which drops into the mud pit. The mud pit is a mud reservoir split into two sections. The first part called a ‘settling pit’. It is a static reservoir allowing any more large cuttings present in the mud to settle before it moves to the second section of the pit, the ‘stirring pit’. In this latter, mud is treated -if needed-, as well as gas, silt and sand are removed from the mud before it goes into the suction line and back into the mud pumps.
1.1.b. Functions of Drilling Fluids
The main objective of a drilling operation is the extraction of oil and gas efficiently. To do so, drilling fluids are designed and formulated to perform many functions that are tasks, a drilling fluid should be able to perform, and they vary from a well to another.
The four main functions of a drilling mud are going to be discussed in this section: Removal of cuttings and suspension of solids when drilling is halted
Controlling subsurface pressure to prevent formation damage and blowout Sealing permeable formations
Lubricating and cooling the drill bit Removal and suspension of cuttings
The drilling mud injected at the bit nozzles, exerts a jetting action to remove cuttings and debris formed by the drilling bit, and carry them up the surface allowing fresh and new rocks to be drilled. In some situations where the drilling operation should be interrupted (e.g. logging or displacement...) the mud should show a high carrying capacity of the cuttings to avoid any settling, causing differential sticking of the drill string as well as formation damage.
Many factors influence the cuttings transport and suspension ability of the mud such as: cuttings size, shape and density as well as annular velocity, density and viscosity of the mud, and borehole angle.
Controlling Subsurface Pressures
Formation stability results in equilibrium of mechanical stresses and physico-chemical interactions and pressures. However, after drilling a well, the drilling fluid must overcome the tendency of the borehole to collapse from mechanical failure and/or from chemical interaction of the formation with the mud. That is done by adjusting the mud density and mud properties (solid concentration, chemicals...). Therefore, in practice, the mud weight should be limited to the minimum necessary for well control and wellbore stability.
Bibliographic Report Introduction to Drilling Fluids: Functions, Types and Properties
Sealing Permeable Formations
Most permeable formations have pore openings too small to allow the passage of the whole mud into the formation. However, while drilling, cuttings and solid particles contained in the drilling fluid will help plugging the formation pores by forming a thin, low permeable layer called filter cake. This layer helps sealing the formation and prevents the invasion of any more fluid.
Drilling fluids which produce low quality or thick filter cakes cause problems such as stuck pipe, difficulty in running casing and poor cement jobs. In this case, the drilling mud can be treated with bentonite, polymers and organic deflocculating additives to improve mud cake quality.
Lubricating and Cooling the Drill Bit
During drilling operations, heat and friction are generated at the bit and between the drill string and the formation due to physical interactions. This contact creates a considerable torque and drag during rotation and trips. Therefore, drilling fluids should transport this heat away from the frictional sites and lubricate the bit. Hence, reducing torque and drag, resulting in a smoother and efficient drilling operation as well as a higher Rate of Penetration (ROP).
1.1.c. Types/Classification of Drilling Fluids
Reservoir formations are formed of rock layers and sands where oil and gas are trapped inside. The properties and composition of these rocks differ from one site to another.
While drilling, the mud interacts with the formation. This interaction can lead to leakage of mud into the cracks and voids (pores), resulting in formation damage, fluid loss, sticking, blowout and many other drastic problems.
Hence, each formation requires the use of an appropriate drilling fluid that suits its properties. Therefore, drilling fluids can be classified into two main categories: Oil-Based Muds (OBM) [or Synthetic-Oil-Based Mud (SBM)], Water-Oil-Based Muds (WBM)
o Oil-Based Mud (OBM) [or Synthetic-Based Mud (SBM)]
They are Water-in-Oil (W/O) emulsions where diesel, mineral oil, or low-toxicity linear olefins and paraffins can be used as a continuous phase. Brine is mostly used as the dispersed phase.
OBMs are used for High-Temperature High-Pressure (HTHP) reservoirs and their compositions are more complicated and more expensive than those of the WBMs. On the other hand, OBMs show many advantages against WBMs such as fluid loss control, no shale swelling, adequate lubrication to drill bits, good cuttings carrying ability etc.
However, contamination of formations drilled with OBMs and the incapability of WBMs to withstand severe reservoir conditions have forced the drilling industries to invent a new category of drilling fluids called Synthetic-Based Mud (SBM), offering the same drilling performance of OBMs but with more environmentally-friendly fluids using synthetic oils.
The advantages and drawbacks of OBM/SBM are summarized in the following table.
Bibliographic Report Introduction to Drilling Fluids: Functions Types and Properties
Table 1.1.1: Advantages and Drawbacks of OBM/SBM
Advantages of OBM/SBM Drawbacks of OBM/SBM
High penetration rates Pollution Control Required
Lubricity and temperature stability High Cost of Lost Circulation
Reduced tendency for differential sticking Hazardous Vapors
Shale stability and inhibition Special Logging Tools Required
Resistance to chemical contamination Gas Stripping
Reduce Corrosion Aqueous Contamination
o Water-Based Mud (WBM)
They are Oil-in-Water (O/W) emulsions where the main base fluid may be fresh water, seawater, or brine. These systems incorporate natural clays in the course of the drilling operation. Bentonite is added to aid fluid-loss control and to enhance hole-cleaning effectiveness.
Non-Inhibitive, Inhibitive and Polymer muds are three different types of Water-Based fluids used in the drilling industry. The former comprises native clays or bentonite and do not significantly suppress shale swelling. On the other hand, inhibitive WBMs appreciably retard clay and shale swelling with the use of cations such as Sodium (Na+), Calcium (Ca++) and Potassium (K+). And finally polymers are sometimes used with WBMs as rheology modifiers.
1.1.d. Rheology of Drilling Fluids
Rheology is the part of physics that deals with deformation and flow of matter subjected to different sort of shear stresses. Thus, under flow the behavior of drilling muds is governed by their flow regime which reflects the ability of a fluid to perform its basic functions.
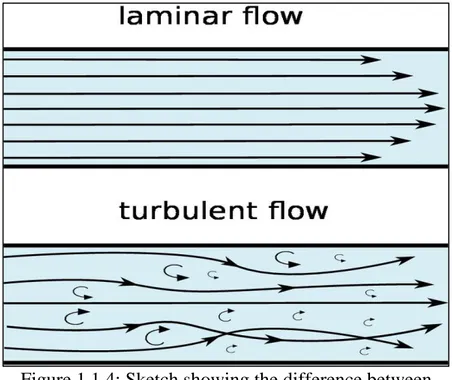
A flow regime is a relation between the flow rate and the flow pressure. Hence, a fluid can exhibit either ‘Laminar Flow’ (low flow rates) or ‘Turbulent Flow’ (high flow rates).
Figure 1.1.4: Sketch showing the difference between laminar and turbulent flows inside a pipe
On the other hand, flow behavior can be express by a relation between the shear stress (flow pressure) and the shear rate (flow rate). Hence, depending on this relation, fluids can be classified into two other categories:
o Newtonian fluids: for this type of fluids, the shear stress is proportional to the shear rate (under laminar flow and constant temperature). This proportionality can be graphically illustrated by a straight line passing by the origin. The slope of this line is the viscosity of the fluid.
o Non-Newtonian fluids: For this kind of fluids the viscosity is no longer constant but it may be shear rate or time dependent. Hence, the shear stress-shear rate relation is no longer linear.
Most -if not all- of the drilling fluids are non-Newtonian fluids, and great efforts were put to analyze and describe precisely the behavior of these fluids.
However, the effective viscosity of drilling fluids should be relatively high at low shear rates (in the drill pipe and bit nozzle) and relatively low at high shear rates (in the annulus which helps in borehole cleaning). In other words, the effective viscosity decreases when the shear rate increases. This is called ‘shear thinning’ behavior and it is a very desirable characterization of drilling fluids.
Bibliographic Report Introduction to Drilling Fluids: Functions, Types and Properties
Several mathematical flow models, which relate the flow behavior to flow characteristics while fluid is in a laminar flow, have been developed [7-10]. The utilization of these models coupled with shear stress-shear rate data measured by suitable instruments, allows an accurate determination of fluid behavior under different flow conditions. Thus, the evaluation of important aspects related to drilling fluid's performance, such as:
Calculation of pressure losses Bit and jet nozzle hydraulics Relative hole cleaning efficiency Equivalent circulation density
There is no single rheological model which can exactly fit the shear stress-shear rate data for all fluids over a range of shear rates investigated. Hence, the models of great interest to the Drilling Fluid Engineering (DFE) are the following:
o Newton's Model
τ = μ . γ (I.1.1)
τ Shear Stress (Pa)
μ Dynamic Viscosity (Pa.s) γ Shear Rate (s-1
)
It is the simplest linear model where the shear stress, shear rate and the viscosity have a constant relationship leading to a linear curve as illustrated in Fig. 1.1.5 [11].
Figure 1.1.5: Shear Stress - Shear Rate plot for a Newtonian Fluid
Note that the majority of drilling fluids do not conform to this law. Hence, the Newtonian model has no value in predicting the behavior of a drilling fluid.
o Bingham Plastic Model
τ = YP + PV . γ (I.1.2)
PV Plastic Viscosity (Pa.s) YP Yield Point (Pa)
This model shows a dynamic yield stress that can be obtained by extrapolation to zero shear rate. The PV represents the slop of the curve; however, at and below the YP, PV tends to be infinite. As seen in Eq. I.1.2, the BP Model describes the shear stress/shear rate behavior of many shear thinning materials at low shear rates, although unfortunately, the value of the YP obtained depends on the shear rate ranges used for the extrapolation procedure (Fig. 1.1.6). The YP values obtained using this model, are always higher than the real yield stress values of the fluids.
On the other hand, it is important to know that the Plastic Viscosity is described as the portion of the viscosity that is caused by the interparticle friction and is affected by three main parameters:
Solids concentration Size and shape of solids Viscosity of the liquid phase
Nonetheless, the Yield Point is another portion of the viscosity that is related to the electrical attractive forces. In other terms, it is the stress threshold needed to start the flow.
Bibliographic Report Introduction to Drilling Fluids: Functions, Types and Properties
Figure 1.1.6: Flow curve for a Bingham-Plastic fluid o Power Law
Most drilling fluids exhibit a behavior that falls between the Newtonian and the Bingham-Plastic models. They are called “pseudo-plastic” fluids and their rheological equation can be written as:
τ = K . γN (I.1.3)
K Consistency Index N Flow Index
Based on the ‘N’ value, the power law describes three different types of fluids: Table 1.1.2: Correspondent fluids types depending
on the 'N' value of the Power Law
Value of N Correspondent type of fluid
<1 Non-Newtonian fluid
=1 Newtonian fluid
>1 Dilatant fluid
In this case, the system does not show a yield value, but rather shows a limiting viscosity at low shear rates (called residual or ‘zero shear’ viscosity). By fitting experimental data to Eq. I.1.3, it is possible to obtain values of both K and N. The viscosity at a given shear rate can be calculated as:
µ = σ/γ = kγN/γ = kγN-1 (I.1.4)
o Herschel-Bulkley Model (H-B Model)
The H-B model is a modified Power law model where the shear stress is presented in function of the yield point, the consistency and flow index (K, N) respectively. It is clearly seen from Eq. I.1.5 that this model does not predict explicitly the plastic viscosity of the fluids.
The H-B Model is the most used rheological model for shear thinning fluids, and it is given as:
Bibliographic Report Introduction to Drilling Fluids: Functions, Types and Properties
Figure 1.1.8: Hurschel-Bulkley Rheological Model for N<1
One should know that K tends to have the same properties as the plastic viscosity. Hence, the H-B converges to a Bingham Model for N=1 and to the Power Law when the YP=0. The H-B Model is widely used nowadays for its ability to describe accurately most fluids behaviors better than simple Power Law and Bingham models.
o Casson Model
It is a two-parameter model used in different industries but rarely used in the oil and gas industry. The rheological equation of this model is:
τ = [YP0.5 + (PV . γ)0.5]² (I.1.6)
Drilling fluids exhibits a dual behavior depending on the shear-rate range applied. At low shear-rate, the fluids should have high viscosity values allowing a better hole cleaning. However, increasing the shear rate should result in a decrease of the viscosity of the fluids giving rise to a ‘shear thinning’ behavior. This phenomenon results from the viscoelastic properties of the mud showing at the same time, a time-dependency property that is very essential for an efficient drilling operation.
Viscoelastic systems sheared in their linear region show time-dependency because the microstructure takes time to respond to the flow/stress. At short times (high frequencies), the structures cannot respond quickly, and an elastic response is obtained, while given time (low frequencies), the system can adjust itself continuously.
Thus, when observed over all time (and frequency) scales, the system is viscoelastic. For non-linear viscoelastic -or simply inelastic but shear-thinning systems- not only does the microstructure take time to respond to the flow, but it is also changed by the flow and this change will itself take time. This is the essential difference between linear viscoelasticity and thixotropy that while both are time effects, the former is in the linear region, where the structure responds but remains unchanged and the latter takes place in the non-linear region where the structure is broken down by deformation as well as responding to it. Shear thinning can occur for many reasons:
Alignment of rod-like particles in the flow direction Loss of junctions in polymer solutions
Rearrangement of microstructure in suspension and emulsion flow Breakdown of flocs
On the drilling rig, the thixotropic properties of drilling fluids are quite simply measured using a VG meter. These rheometers are simply used to estimate the plastic viscosity of fluids at specific rotational speeds (3, 6, 100, 200, 300 and 600 rpm). These rates are supposed to estimate the behavior of the drilling fluids at different stages of the drilling operation. However, the results obtained do not give a detailed description of the time-dependency of these fluids. Therefore, many new sophisticated and accurate methods were established on this purpose using the ‘Oscillatory Rheology’ technique. This technique is based on the measurement of the complex shear, loss and storage moduli over a range of strain/deformation applied at a constant frequency (or angular velocity) [12-13].
Mathematically speaking, the viscoelastic behavior of fluids can be expressed using the shear, loss and storage modulus as shown in Eq. I.1.7.
G = G’ + iG” (I.1.7)
G Complex Shear modulus
G’ Storage modulus G” Loss modulus
Bibliographic Report Introduction to Drilling Fluids: Functions, Types and Properties
The loss and storage moduli respectively characterize the solid-like and liquid-like contributions to the measured stress response. These characteristics are used to measure the strength of the microstructure existing in the fluids. These microstructures are forces resulting from the interaction of the molecules or particles in the system. If the applied forces are lower than the inter-particle forces, then G’ is larger than G”. Thus, the material shows a capacity to store energy which means that it possesses a solid-like structure and vice-versa.
Fig. 1.1.9 shows a simple amplitude-sweep [14-15] of a drilling fluid sample [16]. It
is clear that for stress amplitudes smaller than 10 Pa, the loss and storage moduli are parallel with G’ higher than G”. This means that the fluid reacts more like a solid than a liquid. On the other hand, a threshold of stress amplitude exists which breaks down the structure of the fluid and make it more fluid like. This threshold is considered as the real yield stress of the fluid in oscillatory rheology.
Figure 1.1.9: Amplitude Sweep of a Drilling Fluid Sample [16]
Under static conditions in relationship to time, some electrically charged molecules and clay particles aggregate to form a firm matrix. The measurements of these attractive forces are called “gel strength”. It is a very important characteristic for
drilling fluids and is related to the yield point in a way that when this latter decreases the gel strength will typically decrease.
Two types of gel strengths exist: progressive and fragile gel strengths. Where the former increases strongly with time, the latter has a slight increase and requires more time to built its gel structure [17-18].
Bibliographic Report Emulsions: Composition, Stability and Characterization
1.2. Emulsions: Composition, Stability and Characterization
A colloidal dispersion is a two-phase system where one phase (called dispersed phase) is dispersed in the other (called continuous phase). If the continuous phase is a liquid, three main types of dispersions can be distinguished:
Suspensions: where the colloidal particles are solid Foams: Where the colloidal particles are gas
Emulsions: where the colloidal particles are liquid
When oil and water are placed together in a container, a layer of oil is formed over a layer of water (due to the density difference between both). This represents their thermodynamically most stable state. This is due to the fact that the system works on minimizing the contact area between the two phases and thus minimizing the free energy in the whole system. The layer formed between the two phases is called interface. The work required to change the shape of that interface is known as interfacial tension giving in Eq. 1.2.1.
= (G/A) (I.2.1)
Where the interface tension, A the surface area and dG is the surface free energy given by the Gibbs-Deuhem equation:
dG = -SdT + Ad + nidi (I.2.2)
dG is made of three main components: an entropy term SdT, an interfacial energy term Ad and a composition term nidi (ni is the number of moles of the component i with chemical potential i) [19].Thermodynamics teaches that for phase separation to occur,
the attraction between an oil molecule and a water molecule at the interface, must be less than the average of that between two oil molecules and two water molecules. Thus, the
amount of work that can be extracted, called ‘free energy’ (Eq. 1.2.2), per molecule must be higher in the interfacial area than in the bulk liquids.
Therefore, in order to form an emulsion, it is required to change the layer position between the two phases by bringing energy to the system overcoming the aforementioned free energy (i.e. agitation, homogenization). Under agitation, droplets (of oil or water) are formed. These droplets are constantly moving due to Brownian movement and/or gravity. Thus, they collide and may coalesce leading to the formation of larger droplets which, due to gravity, merge together and re-form the oil and water separate layers.
To form an emulsion two phenomena are required. At first, homogenization of the liquids leading to the formation of dispersed droplets inside a continuous phase by bringing energy to the system overcoming the total free energy. And then, maintaining the dispersed droplets from coalescence to avoid phase separation.
Figure I.1.10: Principle of emulsion formation and stabilization using surfactants
Homogenization or also called emulsification is the process of making an emulsion by mixing two immiscible liquids using high speed mixers. Many types of mixers are used today depending on the field of application (i.e. Hamilton Beach, IKA UltraTurrax, Ultrasonic homogenizers). During emulsification, dispersed droplets are formed. Many parameters affect the size of the droplets formed, such as:
o The flow regime: It is the movement of fluids (oil and water) during homogenization. It depends on the homogenizers used. Thus, different flow
water Oil Homogenization Surfactants addition to cease coalescence
Bibliographic Report Emulsions: Composition, Stability and Characterization
regimes, responsible of the droplet break-up, can be distinguished: Laminar or Turbulent.
o Interfacial Tension: The interfacial forces, that keep oil droplets spherical, are characterised by the Laplace pressure (ΔP), which is the pressure difference between the inside and the outside of the droplet. It is expressed as follows:
ΔP = 2/r (1.2.3)
Where is the interfacial tension between oil and water and r the droplet radius. Thus, it is clear that the droplet diameter depends on the interfacial tension; droplets tend to be bigger if the interfacial tension is higher.
o Droplet coalescence: After homogenization, droplets are constantly moving and the frequency of collision is very high due to agitation. These collisions may lead to coalescence, increasing then the droplet size. Thus, the presence of emulsifiers in the system is mandatory to prevent droplets coalescence.
Emulsifiers tend to minimize the interfacial tension leading to the phase separation of the emulsion. Broadly speaking, an interface is a surface that forms the common boundary between the two phases. Note that the term surface tension is used when one of the interfaces is gaseous. The time taken by the emulsifier to adsorb at the interface is also important. Emulsifiers have two main functions:
To decrease the oil-water interfacial tension to facilitate droplet disruption
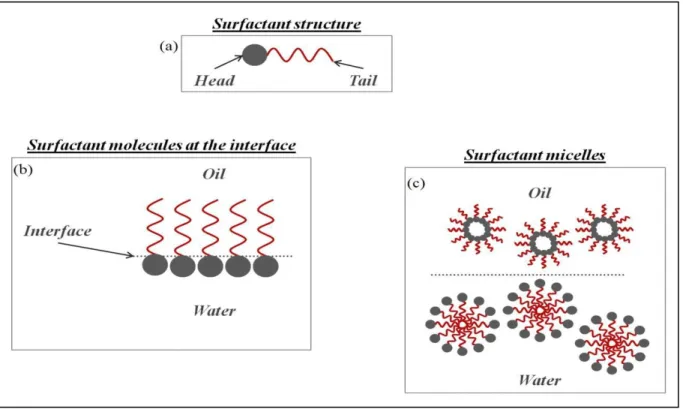
To form a protective skin around the dispersed droplets to prevent coalescence Surfactants accumulate at interfaces in a process defined as ‘adsorption’ altering significantly the interfacial free energy of the interface. In aqueous media, surfactants have a characteristic molecular structure known as ‘amphiphilic’. It consists of two parts: the ‘head’ which is hydrophilic and has high affinity to water and little or no affinity to oil and the tail which is hydrophobic (has high affinity to oil and little or no affinity to water) [Fig. 1.2.1.a].
Various structures of surfactants exist depending on the nature of the head and tail groups [17]. The surfactants’ solubility in aqueous media is determined by the affinity of the hydrophilic head with the media.
A surfactant dissolved in liquid can either adsorb at the interface or self-assemble to form micelles [Figs. 1.2.1.b and 1.2.1.c]. However, the micelles formation depends on the surfactants concentration. This concentration is well known as the ‘critical micelle concentration’ (CMC).
Fig. 1.2.2 shows clearly the effect of the surfactants concentration (‘C’) on the interfacial
tension (‘’). It is seen that above the CMC concentration, no alteration of the interfacial tension occur. This is explained by the fact that surfactants molecules above the CMC must result in association to form micelles that have low activity.
Figure 1.2.1: Schematic representation of (a) Surfactant structure (b) Surfactant molecules at the interface, and (c) Surfactant micelles
The surfactant has two main roles to play: it lowers the interfacial tension, facilitating droplet break-up and it prevents re-coalescence. Surfactants are usually distinguished by
Bibliographic Report Emulsions: Composition, Stability and Characterization
their Hydrophilic-Lipophilic Balance number (HLB). This can be explained by the difference in the geometry of the molecules which might exhibit longer hydrophilic chains over those hydrophobic which induces the formation of O/W emulsions and vice-versa. Thus, oil soluble surfactants tend to stabilize W/O emulsions, while water soluble surfactants tend to stabilize O/W emulsions. Table 1.2.1 shows the classification of surfactants according to their HLB values and ability to stabilize emulsions.
Table 1.2.1: Surfactants characterization according to their HLB numbers' range
Type of emulsifiers HLB range
W/O emulsifier 3-6
Wetting agent 7-9
O/W emulsifier 8-18+
Emulsions have invaded various domains from pharmaceutical to the food industry and even the oil and gas sector. The main issue which represents at the same time the main objective for all these industries is to understand and enhance the stability of such systems. Knowing that emulsions are thermodynamically unstable and they tend to always separate, industries have developed a lot of new strategies to enhance the kinetic stability of emulsions.
The term ‘emulsion stability’ refers to the ability of an emulsion to keep its properties unchanged over a certain period of time. However, as emulsions are thermodynamically unstable, changes of emulsion properties will occur; the more slowly the properties change, the more stable the emulsion is. Many phenomena can alter the stability of an emulsion: coalescence, flocculation, creaming, sedimentation, etc [Fig. 1.2.2]. Two or more of these instability phenomena may occur at the same time. Thus, it is important to understand the cause(s) of instability to select suitable components to form stable emulsions.
As aforementioned, dispersed droplets are constantly moving due to Brownian motion, gravity or mechanical agitation. Thus, they frequently collide with each other. Then, they can either move apart or aggregate. There are two main types of aggregation: Flocculation and Coalescence.
Flocculation is the aggregation of droplets that keep their physical properties. It can be reversible (weak flocculation) or irreversible (strong flocculation). On the other hand, coalescence is the aggregation of droplets that merge together (irreversible).
Figure 1.2.2: Interfacial Tension vs. Surfactants concentration [17]
To better understand the difference between flocculation and coalescence and their impact on the stability of emulsions one should know that every emulsion droplet is surrounded by the continuous phase in which the droplets are formed and dispersed. As droplets move closer to each other, a thin film of the continuous phase is formed between the droplets.
As long as this film exists, there is no droplets contact. Droplets aggregation occurs only when the liquid is squeezed out of the thin layer. The thin film forms a barrier between the droplets. The rupture of the film requires a certain level of energy which determines the nature of the collisions.
Bibliographic Report Emulsions: Composition, Stability and Characterization
Figure 1.2.3: Coalescence phenomena of an emulsion dispersed droplets due to the thin film disruption [18]
Fig. 1.2.3 shows clearly the effect of the continuous phase thin film properties at the
interface of two droplets stabilized by solid particles. At high energy barrier (rigid thin film), there is no aggregation and the droplets remain stable (Fig 1.2.3.a). At low energy barriers the droplets will start to show a weak coalescence (Figs. 1.2.3.b and 1.2.3.c) until a complete merge of the two droplets occurs at a certain energy level (Fig. 1.2.3.d).
o Flocculation: Formation of flocs is a sign of emulsion instability. Flocculation has an influence on the creaming rate. Moreover, the presence of flocs increases the emulsion viscosity which in some cases is undesirable. On the other hand, creating a network between the dispersed droplets is sometimes an advantage (i.e. food emulsions). There are several methods to control flocculation. The most efficient way is to regulate the colloidal interactions between droplets (steric, electrostatic, etc.).
o Coalescence: Preventing droplet coalescence is a major issue in emulsion stabilization. A few methods have been developed to control or prevent coalescence as it depends on both the colloidal and hydrodynamic interactions between droplets, and the physico-chemical properties of the components used in the emulsion (primarily the continuous phase and the emulsifiers). Hence,
coalescence is mainly ceased by the presence of emulsifiers adsorbed at the oil-water interface. For example, the presence of charged emulsifiers at the droplet interface induces electrostatic repulsion between the droplets, which tends to prevent droplet contact. Fine divided solid particles also provide very good stability against coalescence as they form a solid layer that ceases the droplets to coalesce (Pickering Emulsions, discussed later).
o Ostwald ripening: It is the process of gradual growth of the larger droplets at the expense of smaller ones due to mass transport of soluble dispersed phase through the continuous phase. The solubility of liquids increases with decreasing the droplet radius.
All aforementioned instability phenomena can occur at the same time in an emulsion which makes it so hard for one to identify them individually. However, there are some common effects that should be recognized while studying the stability of emulsions, and there are some of them.
o Droplet size measurement: The instability phenomena of an emulsion either affect or are affected by the evolution of the droplet size with time. An emulsion is considered as stable if there is no evolution of the droplets sizes with time. In other words, if the droplets are fully covered and protected by the emulsifiers/surfactants so that they do not coalesce. Therefore, the measurement of the droplet size distribution (DSD) of an emulsion is of great importance for one to assess its stability.
Many techniques have been developed to measure droplet size distribution; the most used techniques are microscopy, light scattering, ultrasonic methods and more recently NMR [19-20].
o Creaming/sedimentation characterisation: These two phenomena are easily assessed by optical observations. As clearly seen in Fig. 1.2.4, in most cases, creaming is characterised by a whitish/yellowish layer on top of the emulsion, while a layer appears at the bottom if sedimentation occurs.
Bibliographic Report Emulsions: Composition, Stability and Characterization
Creaming and sedimentation rates can be determined by a simple bottle test. It consists of measuring the volume of cream/sediment in the emulsion in function of time. This can be done easily by placing the emulsion in a calibrated beaker or tube and measuring the height of the cream/sediment with time. More sophisticated techniques are used sometimes to measure the creaming/sedimentation rate using the light scattering or ultrasonic imaging [21-25].
o Flocculation characterisation: The use of a microscope is the easiest method for one to observe the flocculation of droplets. Even though, special care should be taken not to break the flocs when preparing microscope slides. Particle sizing instruments as well as image analysis can be used to determine the size of droplets or flocs. The flocculation rate can be determined by measuring the flocs’ size as function of time.
o Emulsions Conductivity: The electric conductivity of an emulsion is a very important parameter that can give a lot of information about the stability of emulsions. W/O emulsions tend to have a very low conductivity due to the insulating characteristic of the oil continuous phase. However, if the conductivity of the emulsion increases with time, this can be related to the coalescence phenomenon that is occurring inside the emulsions giving rise to larger droplets of water [26-27]. Nonetheless, conductivity measurement is a very important candidate for the assessment of the phase inversion of emulsions.
Figure 1.2.4: The main instability phenomena that can occur during emulsification o Rheology of emulsions: Rheology is considered as a very effective tool for the
measurement of emulsion stability. However, it might be complicated to assess separately the effect of each instability parameter. Tadros [28] has explained in detail how to measure the stability to creaming/sedimentation using rheological measurements. It is clear that low shear rheology is strictly related to the stability of the emulsion. At low shear rates (shear stresses), measurement of the yield stress reveals if any syneresis effects occurred (flocculation or appearance of a clear phase on top or bottom of the emulsion). Nonetheless, oscillatory rheology tests are used in some applications for the assessment of the stability of emulsions. These
Bibliographic Report Pickering Emulsions in the Oil and Gas Industry
1.3. Pickering Emulsions in the Oil and Gas Industry
1.3.a. Introduction to Pickering EmulsionsThe majority of reports describing the preparation, stability and characterization of macro-emulsions involve the use of low molar mass surfactants and surface-active polymers. Much less appreciated, are the solid particles that have attracted considerable attention recently for their ability to function as surfactants for stabilizing emulsions.
Therefore, this sub-section is dedicated for the solid particles-stabilized emulsions or Pickering emulsions: their stability, properties and characterization are going to be discussed in details. Nevertheless, the impact of such new technologies and the possibility of applying them in the oil field are going to be discussed as well.
In 1903, Ramsden had reported the stabilization of emulsions with solid particles for the first time [1]. However, Pickering stabilization derived its name from a paper by Pickering in 1907 who published the first extensive experimental study on particle-stabilized emulsions for plant spray applications [2]. Finkle et al. [29] established a direct relationship between the type of solids and emulsion type (O/W or W/O). They have stated that in an emulsion containing solid particles, one of the liquids will probably wet the solid more than the other where the more poorly wetting liquid tend to form the dispersed phase.
Solids-stabilized emulsions are commonly encountered during the production of crude oil and synthetic fuels. Consequently, a fundamental understanding of the mechanisms governing the stability of these emulsions is essential. Depending on the exact system, there are at least two mechanisms by which colloidal particles stabilize emulsions. In the first, the particles are required to adsorb at the oil-water interface and remain there