HAL Id: hal-02177735
https://hal.archives-ouvertes.fr/hal-02177735
Submitted on 9 Jul 2019HAL is a multi-disciplinary open access
archive for the deposit and dissemination of sci-entific research documents, whether they are pub-lished or not. The documents may come from teaching and research institutions in France or abroad, or from public or private research centers.
L’archive ouverte pluridisciplinaire HAL, est destinée au dépôt et à la diffusion de documents scientifiques de niveau recherche, publiés ou non, émanant des établissements d’enseignement et de recherche français ou étrangers, des laboratoires publics ou privés.
deliverable FOREVER (n° Forever WP2_D2-1-V4)
Marie-Agnès Pallas, John Kennedy, Ian Walker, Roger Chatagnon, Michel
Berengier, Joël Lelong
To cite this version:
Marie-Agnès Pallas, John Kennedy, Ian Walker, Roger Chatagnon, Michel Berengier, et al.. Noise emission of electric and hybrid electric vehicles : deliverable FOREVER (n° Forever WP2_D2-1-V4). [Research Report] IFSTTAR - Institut Français des Sciences et Technologies des Transports, de l’Aménagement et des Réseaux. 2015, 134 p. �hal-02177735�
Call 2012: Noise
Funded by Belgium/Flanders, Germany,
Ireland, Norway, Sweden, United Kingdom
FOREVER
Noise emission of electric and hybrid
electric vehicles
Deliverable FOREVER_WP2_D2-1_v4
April 2015
TRL (Transport Research Laboratory), United Kingdom
Austrian Institute of Technology (AIT), Austria
Institut Français des Sciences et Technologies des
Transports,
de
l'Aménagement
et
des
Réseaux
(IFSTTAR), France
Trinity College Dublin
University of Bath
CEDR Call2012: Noise
FOREVER
Future Operational impacts of Electric Vehicles on
European Roads
Noise emission of electric and hybrid electric
vehicles
Start date of project: 01.01.2013
End date of project: 31.12.2014
Author(s) this deliverable:
M.A. Pallas, IFSTTAR, France
J. Kennedy, TCD, Ireland
I. Walker, University of Bath, UK
R. Chatagnon, IFSTTAR, France
M. Bérengier, IFSTTAR, France
J. Lelong, IFSTTAR, France
Version: 4, 04.2015
Quality Review:
On behalf of the Author's Institute
Author: Name M.A. Pallas, IFSTTAR Signature
Technical
Reviewer: Name M. Bérengier, IFSTTAR Signature
On behalf of the FOREVER Consortium
Consortium
Leader: Name: Phil Morgan, TRL Signature
Technical
Table of contents
EXECUTIVE SUMMARY ... III
1 INTRODUCTION ... 1
1.1 CONTENT AND METHODOLOGY FOR THE IDENTIFICATION OF NOISE EMISSION LEVELS FROM ELECTRIC AND HYBRID -ELECTRIC VEHICLES ... 2
1.2 CONTENT AND METHODOLOGY OF THE PERCEPTION STUDY ON ELECTRIC VEHICLE NOISE ... 2
1.3 STRUCTURE OF THE REPORT ... 3
2 REVIEW OF MEASUREMENT METHODS AND MODELS OF VEHICLE NOISE EMISSION ... 5
2.1 MEASUREMENT METHODS:IDENTIFICATION OF THE POWERTRAIN AND TYRE-ROAD NOISE CONTRIBUTIONS ... 5
2.1.1 Contribution of the tyre-road noise: standards based on pass-by measurements ... 5
2.1.2 Contribution of the tyre-road noise: the close-proximity method (CPX method) ... 8
2.1.3 Comparison of the properties of ISO 11819-1/2/4 and CPB methods ... 9
2.1.4 Contribution of the powertrain noise: the ISO 362 standards ... 11
2.2 NOISE SOURCE ANALYSIS WITH A MICROPHONE ARRAY ... 15
2.3 MEASUREMENT OF THE MINIMUM NOISE EMISSION... 17
2.4 DESCRIPTION OF INDIVIDUAL VEHICLES IN THE NOISE ASSESSMENT METHODS ... 18
2.4.1 Federal Highway Administration Traffic Noise Model (FHWA-TNM) ... 19
2.4.2 ASJ-RTN model ... 20
2.4.3 Nord2000 model and Harmonoise/Imagine models ... 20
2.4.4 The Swiss OFEV models ... 21
2.4.5 The German model RLS 90 ... 22
2.4.6 The French model NMPB08 ... 23
2.4.7 The CNOSSOS-EU model ... 24
2.4.8 Summary of the characteristics of the vehicle noise emission models ... 26
3 REVIEW OF EXTERIOR NOISE EMISSION FROM ELECTRIC AND HYBRID/ELECTRIC VEHICLES ... 29
3.1 NON-STANDARD NOISE EMISSION DATA ISSUED FROM PERCEPTIVE STUDIES ... 29
3.2 NOISE EMISSION DATA RELEVANT FOR IMPACT NOISE STUDIES ... 32
3.3 SUMMARY OF FINDINGS OF THE LITERATURE REVIEW ON EV AND HEV NOISE EMISSION ... 43
4 NOISE EMISSION DATA ON ELECTRIC AND HYBRID ELECTRIC VEHICLES ... 47
4.1 EXPERIMENT AND RESULTS ... 47
4.1.1 Test site and experimental setup ... 47
4.1.2 Noise emission of a small electric passenger car ... 50
4.1.3 Noise emission of a large family hybrid passenger car ... 55
4.1.4 Noise emission of an electric truck ... 60
4.1.5 Main findings from the experiment with EVs and HEVs ... 63
4.2 ANALYSIS OF DATA COLLECTION AVAILABLE BY FOREVER PARTNERS ... 64
4.2.1 EVs and HEVs from Category 1 ... 65
4.2.2 EVs and HEVs from Category 2 ... 68
4.2.3 Main findings from the dataset ... 70
5 ADAPTATION OF CNOSSOS-EU FOR LIGHT EVS AND HEVS ... 73
5.1 PROPOSAL OF CNOSSOS-EV FOR ELECTRIC VEHICLES ... 73
5.2 CNOSSOS MODEL FOR HYBRID VEHICLES ... 78
6 INVESTIGATION ON CNOSSOS-EU FOR MEDIUM HEAVY VEHICLES (CATEGORY 2) ... 81
6.1 ASSESSMENT ON NOISE EMISSION FROM ICE MEDIUM-HEAVY VEHICLES ... 81
6.2 NOISE EMISSION FROM ICE MEDIUM HEAVY VEHICLES:LITERATURE REVIEW ... 85
7 PERCEPTION STUDY ... 89
7.1 CORRECTION OF PASS-BY DATA ... 90
7.2 GENERATION OF SOURCE SIGNALS ... 91
7.3 AURALIZATION OF ROAD TRAFFIC PROFILES ... 93
7.4 PARTICIPANT TESTING ... 95
8 CONCLUSIONS ... 99
ACKNOWLEDGEMENT ... 103
REFERENCES ... 103
APPENDIX A: NOISE EMISSION OF THE ELECTRIC PASSENGER CAR UNDER ACCELERATION, DECELERATION AND BRAKING, IN OCTAVE BANDS ... 109
APPENDIX B: NOISE EMISSION OF THE HYBRID PASSENGER CAR AT CONSTANT SPEED IN OCTAVE BANDS . 113 APPENDIX C: NOISE EMISSION OF THE ELECTRIC TRUCK AT CONSTANT SPEED, UNDER ACCELERATION AND DECELERATION IN OCTAVE BANDS ... 117
Executive summary
Context
Electric and hybrid-electric vehicles are often referred to as quiet vehicles, comparatively to conventional internal combustion engine (ICE) vehicles, although this assertion might be tempered in some cases. On one hand some low noise ICE vehicles can be encountered in the fleet in circulation. On the other hand the driving conditions can affect the powertrain and the rolling noise contribution, thus impacting the global noise emission differently depending on vehicle categories.
The electric and hybrid powertrain technologies are mostly employed on light vehicles, either for the carriage of passengers or for goods, but a more recent breakthrough of electro-mobility can also be observed in heavier vehicles, such as delivery trucks or buses. At first, these new vehicle types were mainly developed for urban situations, primarily for their qualities concerning air pollution reduction. However, due to the improvement of their electric range, they can also be encountered on national road networks.
The character of electric vehicle noise has the potential to be different from traditional internal combustion vehicle noise in terms of features such as directionality, frequency content and sound pressure level. The data available from the standard pass-by tests has been analysed and compiled into a noise database of vehicles appropriate for use in subjective participant studies. The aim of these studies was to investigate the changes in the subject responses of human listeners to EV noise from national routes.
Description of the work
The project FOREVER aims primarily to provide data and information on the potential future noise impacts of electric vehicles on national roads. Work Package 2 (WP2) of the project is intended to identify the noise emission levels from electric and hybrid-electric vehicles. This involves a review of the state-of-the-art in vehicle noise evaluation methods and how these can be applied to electric vehicles, considering the issue from the perspective of operation in controlled conditions rather than just strict type-approval conditions. The study includes practical testing carried out on a range of electric and hybrid-electric vehicles to determine noise emission levels. The objective is to derive input data for use within noise prediction models such as CNOSSOS-EU. Two vehicle categories, light1and medium heavy2vehicles, are considered in the study which focuses entirely on external noise.
The noise impacts from the perspective of human listeners, e.g. communities near national road ways, were also considered through a series of subjective participant trials. These studies investigated how the change in the character of noise emission of electric vehicles is perceived by human listeners. A system of perceptual dimensions similar to past research (Giudice, 2010) was used to assess the noise emission of electric vehicles.
The particular topic of the noise impact assessment on sound alerting systems, originally planned in the programme of WP2, could not be carried out since these alert systems are not standard equipment on low-noise vehicles yet and were not available on the vehicles tested in WP2.
Results on the noise emission levels from EVs and HEVs
A literature review has been conducted on the noise emission from electric vehicles (EVs) and hybrid electric vehicles (HEVs), which showed that:
• The studies motivated by perceptive outcomes carry out specific experiments, generally out of any standard procedure, only occasionally with some common features. Consequently, quantitative results cannot be strictly compared from one study to the other.
• The studies motivated by noise impact outcomes for dwellers rely either on on-board measurements or on roadside measurements. Most studies involve measurements with roadside microphones at standard position and pass-by procedures complying with international standards. These standard specifications are extended to pass-bys performed over a wider range of operating and speed conditions. Some studies complete the previous standard approach with microphone array measurements.
• One crucial point for the measurement of the noise emission from quiet vehicles is the background noise, which may limit the validity of the noise measures at low vehicle speed and is still more critical in some frequency bands. Even situations usually considered as quiet might be too noisy in this context.
• At high speeds all studies agree and assert that all vehicles behave similarly, since rolling noise is the dominating source. At constant low speed, most authors conclude that EVs and HEVs, the latter as far as no engine is working, are quieter than ICE cars. However, other studies show that on average there is no substantial difference between EVs/HEVs and ICE cars on the whole speed range. Results are also mixed when dealing with noise increase under acceleration.
• Few studies are available on hybrid and electric heavy vehicles. Studies involving either a heavy parallel hybrid truck or buses showed that a significant noise breakthrough occurred between the hybrid and electric modes, more clearly than between conventional ICE and hybrid vehicles, although the hybrid advantage may depend on the type of hybridization. Braking situations, activating the energy recovery system, can increase vehicle noise emission when compared with steady speed. Experimental tests were undertaken by IFSTTAR, with the measurement of the noise emission of a small electric car, a larger hybrid car and an electric truck at pass-by, involving microphones at the standard position (distance 7.5 m) and a microphone array. The results showed that:
• The EVs and HEVs generally use either a direct transmission or an automated gearbox and the transmission cannot be disengaged. The propulsion noise component and the rolling noise component cannot be separated from common pass-by noise measurement without complementary information. The use of indoor test condition and/or simultaneous on-board instrumentation should help to focus on the propulsion noise component.
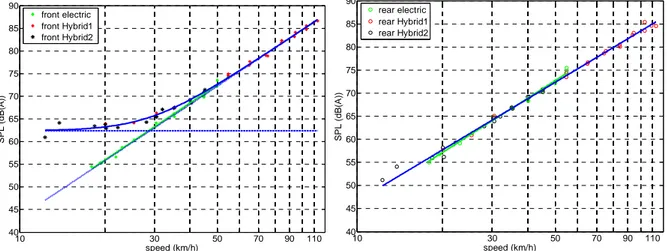
• At steady speed the global A-weighted noise pressure level at vehicle pass-by increases linearly with log(speed), for all vehicles in all-electric mode. The middle frequency bands are dominating over most of the speed range. A deceleration (without braking) does not change much the emitted noise if the deceleration rate is
moderate, but the noise was observed to increase significantly if the energy recovery is strong, with or without braking.
• At steady speed with the hybrid passenger car, global noise emission differences between the electric and the hybrid mode occur up to 40 km/h. There is no difference over 40 km/h. The noise level in braking situation is similar to moderate acceleration. In order to set out an appraisal on the noise emission of EVs and HEVs, appropriate data available by the project partners have been collected. Only measures at steady speed providing noise levels at 7.5 m from the track centre have been considered. They have been compared with the sound emission model provided in CNOSSOS-EU. The results are indicative, due to the restricted number of vehicles available in the data collection. They showed that:
• Concerning light vehicles in electric mode: the global noise emitted by all vehicles follows a linear trend with log(speed). The difference between the quietest and the noisiest vehicle is 4.5 dB(A) at any speed of the range 20-50 km/h. The noise increase is not linear in some frequency bands. In its present form, CNOSSOS-EU overestimates propulsion noise emission from light electric vehicles in all octave bands and, consequently, in global levels. A corrected version for EVs is required if a prediction of the noise impact from a traffic flow including EVs is needed.
• Concerning light vehicles in hybrid mode, the noise emitted by the few hybrid vehicles in the data collection exhibits a quite common behaviour.
• Concerning the medium heavy vehicles, the analysis concerns few vehicles, evaluated on one test site. For the vehicles in all-electric mode, large noise level differences are noticed between vehicles of dissimilar GVW and tyre size. For the vehicles in hybrid mode, the type of hybridization might be a key parameter for the powertrain noise contribution.
• Concerning CNOSSOS-EU for medium heavy ICE vehicles, the characteristics of the prediction model raises question, about the weight granted to propulsion noise over the whole speed range relatively to rolling noise. In addition, test results available by IFSTTAR with ICE vehicles are not consistent with this prediction, as well as other results published in the literature. Further investigation is needed on ICE prior to considering any correction to CNOSSOS-EU for electric and hybrid vehicles in this category.
An adaptation of CNOSSOS-EU has been proposed for light EVs and HEVs. Since the
number of vehicles available in the analysis was limited, the results given in the report should be taken as indicative and values provided represent a first step toward the specification of electric vehicles in CNOSSOS-EU. Confirmation by complementary studies is necessary.
The specifications for a corrected version of CNOSSOS-EU for light electric vehicles are:
• The approach is based on constant correction terms to be applied on the propulsion noise component given in CNOSSOS-EU for ICE cars, as long as another equation, physically consistent with the actual propulsion noise from electric vehicles, is not available.
• The values of these correction terms have been determined and are given in each octave band from 125 Hz to 4000 Hz.
• Conclusions on rolling noise are drawn and reported in WP3 of FOREVER (Gasparoni, 2014).
• In global levels, the weight of the propulsion noise component in the total noise from EVs remains small (if not negligible) in the total noise, which is not systematically true in some octave bands.
For light hybrid vehicles operating in hybrid mode, no correction is necessary and CNOSSOS-EU specifications are recommended. When operated in electric mode, hybrid vehicles behave like full-electric vehicles.
Results on the perceptive study on EVs
The character of electric vehicle noise has the potential to be different from traditional internal combustion vehicle noise in terms of features such as directionality, frequency content and sound pressure level. The data available from the standard pass-by tests has been analysed and compiled into a noise database of vehicles appropriate for use in subjective participant studies. The aim of these studies is to investigate the changes in the subject responses of human listeners to EV noise from national routes.
A key aim of the research has been to develop a controllable model of various road traffic mixes on a rational route way. Using this approach it has been possible to investigate the effect of increasing percentages of electric vehicles as a source of the noise emission on subjective responses to the noise.
As a start point for this process the standard pass-by measurement data was utilised. The challenge addressed and met in the FOREVER project was therefore to use these single mono recordings to generate an auralised road traffic environment in a rigorous and repeatable way. This represents a novel approach making use of the ISO standard measurement procedures to generate auralizations of road environments. This approach could be used as a dissemination tool or in further research into community responses to traffic noise exposure. Within the project various road traffic mixes of ICs and EVs were produced. A road profile corresponding to a national route way was used and the percentage of EVs was then varied from 0% to 20%, 40%, 60% 80% and 100%.
Research on the subjective response of participants to these various vehicle mixes suggests quite clearly that a widespread transition from conventional to electric vehicles on national roads would not harm the subjective experience of people near those roads, and indeed would likely improve that experience.
1 Introduction
Electric and hybrid-electric vehicles are often referred to as quiet vehicles, comparatively to conventional internal combustion engines (ICE) vehicles, although this assertion might be tempered in some cases. On one hand some low noise ICE vehicles can be encountered in the fleet in circulation. On the other hand the driving conditions can affect the powertrain and the rolling noise contribution, thus impacting the global noise emission differently depending on vehicle categories.
The electric and hybrid powertrain technologies are mostly employed on light vehicles, either for the carriage of passengers or for goods, but a more recent breakthrough of electromobility can also be observed in heavier vehicles, such as delivery trucks or buses. At first, these new vehicle types were mainly developed for urban situations, primarily for their qualities concerning air pollution reduction. However, due to the improvement of their electric range, they can also be encountered on national road networks.
The project FOREVER aims primarily to provide data and information on the potential future noise impacts of electric vehicles on national roads. Work Package 2 (WP2) of the project is intended to identify the noise emission levels from electric and hybrid-electric vehicles. This involves a review of the state-of-the-art in vehicle noise evaluation methods and how these can be applied to electric vehicles, considering the issue from the perspective of operation in controlled conditions rather than just strict type-approval conditions. The study includes practical testing carried out on a range of electric and hybrid-electric vehicles to determine noise emission levels. The objective is to derive input data for use within noise prediction models such as CNOSSOS-EU. Two vehicle categories, light3and medium heavy4vehicles, are considered in the study which focuses entirely on external noise5.
The noise impacts from the perspective of other road users, e.g. other drivers, are also considered through a series of subjective participant trials. These studies investigate how the change in the character of noise emission of electric vehicles is perceived by human listeners. A system of perceptual dimensions similar to past research (Giudice, 2010) is used to assess the noise emission of electric vehicles.
In recent studies some authors have demonstrated that, when driven in electric mode, low-noise vehicles may be so quiet that they can be dangerous for pedestrians and bicyclists (Hanna, 2009). Others pointed out that vehicle accident statistics are still insufficient or incomplete and cannot provide a reliable outcome (JASIC, 2009)(Verheijen, 2010) (Sandberg, 2010)(Morgan, 2011). Nevertheless, several studies proved that quiet approaching vehicles are harder to hear than traditional ICE (internal combustion engine) vehicles, leading to a suspected higher risk for other road users (for example (Garay-Vega, 2010)(Wall Emerson, 2011)). That is why some nations or country unions are preparing guidelines/requirements/regulations for Acoustic Vehicle Alerting Systems (AVAS) to be installed on hybrid electric and electric vehicles. Car manufacturers are also working to introduce alert sounds to warn vulnerable road users. If these additional sounds have a positive impact on safety, can they inversely produce a negative effect on the environment? This particular topic, originally planned in the programme of WP2, could not be carried out 3
Vehicles with a gross vehicle weight 3.5 t. 4
since these alert systems are not standard equipment on low-noise vehicles yet and were not available on the vehicles tested in WP2.
1.1 Content and methodology for the identification of noise
emission levels from electric and hybrid-electric vehicles
For gasoline and diesel engine vehicles, various measurement methods relating to vehicle noise emission have been investigated in the past and some of them have been or are being standardized. For example, pass-by and close proximity methods (ISO 362-1, 2007), (ISO 362-2, 2009), (ISO/CD 362-3), (EN ISO 11819-1, 2002), (ISO/CD 11819-2). Other methods, involving microphone arrays and array processing, have been implemented to focus on individual noise sources. All of these methods can be employed to determine the main noise emission characteristics in the various vehicle categories (passenger cars, vans, medium and heavy trucks, buses, etc.), particularly in terms of powertrain noise and tyre-road noise to be introduced in the predicting models which are used, for instance, to build noise maps. Finally, other procedures have been developed more recently, specifically for the assessment of low-noise vehicles, in order to ensure a minimum noise level for safety purpose (SAEJ2889-1, 2012)(ISO/CD 16254). These assessment methods are detailed in the state-of-the-art section of this report. When originally developed for combustion engine vehicles, their adequacy to electric and hybrid-electric vehicles is checked.
The noise emission from several electric and hybrid-electric vehicles has been measured by IFSTTAR within the Work Package period, considering various driving situations: constant speed, moderate or full acceleration, deceleration and braking. It includes standard measurement of pass-by events and noise source description using a microphone array. Similar data already available by partners has been collected to widen the project dataset. This vehicle sample is used to provide noise emission description in various vehicle categories. Global and frequency levels are considered.
The direct effects of electric and hybrid-electric vehicles on the environment in the vicinity of dwellings built along national roads will be assessed in Work Package 4 of FOREVER, on the basis of equivalent sound pressure levels (European noise indicator Lden). To this end,
the European CNOSSOS-EU prediction model can be used. However, electric and hybrid-electric vehicles are not considered in its present version. Thus, as a first step, a global description of the method implemented in the model is proposed in the present report, emphasizing particularly the parameters which could be adapted or modified in order to take into account the specific characteristics of electric and hybrid vehicles. Finally, a proposal is formulated to take EVs and HEVs into account within CNOSSOS-EU for light vehicles at steady speed. The approach followed to provide this proposal is detailed, including motivations and limitations. A specific investigation on medium heavy vehicles is also carried out.
1.2 Content and methodology of the perception study on electric
vehicle noise
The character of electric vehicle noise has the potential to be different from traditional internal combustion vehicle noise in terms of features such as directionality, frequency content and sound pressure level. The data available from the standard pass-by tests has been analysed and compiled into a noise database of vehicles appropriate for use in subjective participant studies. These studies investigate how the change in the character of
noise emission from a national route due to the addition of electric vehicles might be perceived by residential communities.
The resources available for this element of the project research are relatively small. Due to the nature of the partners involved in this task, namely Trinity College Dublin and University of Bath, it was felt that increased benefit and resources could be found by integrating the work of the FOREVER project with graduate level research projects on going in both universities. This enabled the partners to draw on a greater pool of resources than afforded by the original project budget. TCD’s main role in WP2 was the development of a rigorous real world auralization of road traffic environments which include electric vehicles. This dataset was produced and then provided to University of Bath for use in a participant study. The auralizations generated from the experimental measurements were used to assess how people living close to national roads might subjectively respond to increases in the proportion of EVs in passing traffic. Auralizations of road traffic noise were produced that include 0%, 20%, 40%, 60%, 80% and 100% EVs in the traffic mix. As well as the 6 different mixes of conventional and EV noise described above, participants also heard bandpass-filtered versions of each to help identify which (if any) frequency components of the traffic sounds contribute to differences in the subjective perception of traffic with different amounts of EV component.
The extent to which these responses differed as a function the proportion of EVs in each auralization revealed the extent to which the presence of EV sound increases or decreases the subjective noise pollution of traffic on national roads. The data from the bandpass-filtered versions helped identify the frequency components most likely responsible for changes in subjective experience and annoyance. These data thereby allowed us to draw conclusions for the potential impact of electric vehicle noise emission on current community noise legislation and, in the case of the data from the filtered stimuli, potentially help with the development of physical countermeasures to the disturbance caused by traffic noise with increased EV use.
1.3 Structure of the report
The report is structured as follows:• Section 2 is a detailed state-of-the-art on measurement methods of vehicle noise emission and on the vehicle models used in several road traffic noise prediction models, aiming at providing information to the subsequent project tasks and work packages:
o Subsection 2.1 presents standard methods used to describe the rolling noise and the powertrain noise of conventional vehicles and considers their interest toward electric and hybrid electric vehicles.
o Subsection 2.2 presents the microphone array methodology which can be used to characterize vehicle noise sources at vehicle pass-by.
o Subsection 2.3 reports on noise assessment approaches specific to low noise vehicles.
o Subsection 2.4 sums up how individual vehicles are described in several national or transnational noise assessment methods.
• Section 3 is a review of literature related to exterior noise emission levels from electric and hybrid electric vehicles.
• Section 4 reports on the practical trials performed with electric and hybrid electric vehicles within the project FOREVER, in order to assess their noise emission in various operating conditions. It also describes similar data already available by partners, and draws overall conclusions in vehicle categories (light and medium heavy vehicles).
• Section 5 proposes a correction to be used in CNOSSOS-EU as a noise emission model for describing the light electric vehicles in environmental noise impact studies. It also includes comments on hybrid vehicles.
• Section 6 is dedicated to medium heavy vehicles. It investigates the adequacy of CNOSSOS-EU for ICE vehicles in this category and the implications for HEVs and EVs prediction models.
• Section 7 outlines the procedure for the generation of road traffic auralizations with various mixes of ICs and EVs. It also outlines the participant study investigating the subjective differences in response to these environments.
2 Review of measurement methods and models of vehicle
noise emission
In the prediction models used to assess the noise impact from road infrastructures, the noise emitted by the road traffic basically relies on a generic acoustical description of the individual vehicles, itself often separated in a powertrain noise component and a rolling noise component. Both of them are generally estimated from a large number of vehicles by implementing specific measurement methods, which are reviewed in the first part of this section. Then, the emission models of individual vehicles available in various noise assessment methods is surveyed and compared, as a preliminary of WP tasks on EVs and HEVs.
2.1 Measurement methods: identification of the powertrain and
tyre-road noise contributions
2.1.1 Contribution of the tyre-road noise: standards based on pass-by
measurements
In the European project SILENCE, subproject F was devoted to road surfaces as a key element for the generation of road traffic noise. It included a review on measurement methods used to assess the contribution of rolling noise. The subsection on tyre-road noise measurement of the present report is based on information provided in the report F.D13 provided in the European project SILENCE (Haider, 2006), complemented by comments on their use with EVs and HEVs.
2.1.1.1 Statistical Pass-By Method (SPB)
This method is covered by the ISO 11819-1 standard (ISO, 2002). The purpose of this standard is to evaluate different road surface types by measuring traffic noise for various compositions of road traffic. The method is applicable to traffic travelling at constant speed, and is used for two main purposes:
• to classify road surfaces according to their influence on traffic noise
• to evaluate the influence on traffic noise of road surfaces at particular sites.
Measurements must be performed under controlled weather conditions, and the main meteorological characteristics have to be measured within specified accuracy. This condition is also required in the other standard methods presented in the next paragraphs.
The measurement (at a specified roadside location) of the maximum A-weighted sound pressure levels (LAmax) and of the vehicle speeds is performed on a significant number of
individual vehicle pass-bys. The following vehicle categories are considered to be sufficient for the description of the noise characteristics of road surfaces:
• Category 1 : Passenger cars (excluding other light vehicles)
• Category 2a : Dual-axle heavy vehicles
• Category 2b : Multi-axle heavy vehicles
Different speed ranges are defined with respect to the categories of roads on which the traffic flows. These categories are usually associated with some areas (interurban, urban,
• low road speed category: conditions which relate to traffic operating at an average speed of 45 km/h to 64 km/h
• medium road speed category: conditions which relate to traffic operating at an average speed of 65 km/h to 99 km/h
• high road speed category: conditions which relate to cars operating at an average speed of 100 km/h or more.
A reference speed is given for each of the speed ranges and vehicle categories. A minimum number of measured vehicles are required to reduce random errors:
• Category 1 : min. 100
• Category 2a : min. 30
• Category 2b : min. 30
• Category 2a and 2b together : min. 80
For each vehicle category, a regression line is calculated on the maximum A-weighted sound pressure levels versus the logarithm of speed. From this regression line, the average maximum A-weighted sound pressure level (Lveh) is determined at the reference speed. If a
mixed traffic flow is measured, a Statistical Pass-By Index (SPBI) can be calculated in order to aggregate the Lveh of the different vehicle categories. This index, not suitable for
determining actual traffic noise levels, is calculated as follows:
+
+
=
a Lb b b L a a Lv
v
W
v
v
W
W
dB
SPBI
1 2 0.1 2 2 1 2 1 . 0 2 1 2 1 . 0 110
10
10
log
10
)
(
(1) where• L1, L2a, L2b: vehicle sound levels for vehicle categories 1, 2a and 2b
• W1, W2and W2b: weighting factors which are equivalent to the assumed proportions
of vehicles categories in the traffic. The values of these factors are defined in (ISO, 2002)
• v1, v2a, v2b : reference speeds of individual vehicle categories (also defined in (ISO,
2002))
The SPB method is widely used for road surface classification and has the following properties, as listed in (Haider, 2006):
Advantages:
• Measurement of complete noise output of road vehicles
• Realistic listening situation
• Includes vehicles of all types
• Allows for weighting of vehicle categories
• Large statistical sample
• Accuracy, reproducibility, repeatability
Disadvantages:
• SPB is a spot method
• Difficulty to apply in case of high traffic density or, conversely, too low traffic in some vehicle categories
• Reference speed vs. covered speed range
• Practicability and cost-effectiveness
2.1.1.2 The SPB method using a Backing Board
This part of ISO 11819 standard, described by the ISO DPAS 11819-4 (ISO, 2012), describes the Backing Board method (BB), which is a modified version of the SPB method using a microphone mounted on a backing board instead of a microphone in usual free-field conditions (see Figure 1). In order to limit the diffraction effects, the microphone is not situated at the centre of the backing board, but for example in the lower right corner of the board (33 cm from the right edge and 23 cm from the lower edge in the case of the board illustrated by Figure 1).
The measuring principle is the same as in Part 1 of ISO 11819, the BB method is suitable for measurements performed in an urban built-up environment or in the presence of reflective obstacles, such as safety barriers, noise barriers, embankments… The noise coming from the front is reflected by the backing board in a controlled way so that it can be taken into account by applying a correction to the measured value (a doubling of the sound pressure caused by the backing board increases the A-weighted sound pressure level by 6 dB).
Figure 1: ISO 11819-4 – Example of backing board. [source IFSTTAR]
2.1.1.3 Controlled Pass-By Method (CPB)
The CPB method (AFNOR, 2000), which can be considered as a variant of the SPB method, is used when the requirements of the SPB are not fulfilled, especially:
• when the number of passing vehicles in one of the categories is too low (in particular, test installations of road surfaces not open to the general traffic)
• when the vehicle pass-bys cannot be easily separated.
Compared to SPB method, the CPB method offers the following properties (Haider, 2006):
Advantages:
• Complete control over vehicle sample
• Controlled speed, driving and surface conditions
• Faster and more cost-effective than SPB method
Disadvantages:
• representative test vehicles required
• test sites preferred
2.1.2 Contribution of the tyre-road noise: the close-proximity method
(CPX method)
The CPX method is cited below for completeness, although it is not implemented in the work achieved in the Forever project. In the experimental tasks, only the noise emitted at vehicle pass-by is investigated.
The CPX method is an on-board measurement method, sharing the same objectives as the SPB but with the specific intent to complement it in some limitations. In particular it gives the possibility to characterize road surfaces at almost any arbitrary site and over longer distances, checking the longitudinal and lateral homogeneity of road sections (ISO, 2013-1). It uses a test vehicle, either self-powered or towed, equipped with reference tyres6 and at least two microphones located close to the tyre/road interface. Average third-octave and global A-weighted sound pressure levels are provided over 20 m long road segments. The vehicle speed is recorded and corrections are used to provide noise levels at nominated reference speeds. Then, further averaging may be performed over several road segments and several runs. Finally, the standard CPX level is provided for a given reference tyre (t=P or H) and a reference speed (V):
For light vehicles : CPXPV = LcpxP,V (2)
For heavy vehicles : CPXHV = LcpxH,V (3)
CPXP and CPXH may be combined to give a composite CPX level for a mixed traffic of light
and heavy vehicles at the reference speed V, referred to as the CPX Index (CPXI), expressed as:
V V
V CPXP CPXH
CPXI =0,5⋅ +0,5⋅ (4) In terms of advantages and disadvantages, the main characteristics of the CPX method are the following (Haider, 2006):
Advantages:
• possibility to perform measurements over large distances
• good immunity with respect to background noise and reflections
• small traffic dependence
• good practicability 6
Disadvantages:
• method only designed for tyre/road noise identification
• not particularly adapted for heavy vehicle tyre/road noise identification
• does not account for propagation effects
• representativeness of test tyres
• good reproducibility requires a certification of the CPX equipment.
2.1.3 Comparison of the properties of ISO 11819-1/2/4 and CPB methods
The ISO 11819-1/2/4 standards intend to assess rolling noise. Therefore the use of quiet vehicles (from the point of view of the emitted power unit noise) is undoubtedly an advantage, especially in the following applications:
• when the ISO 11819-1/4 are used to characterize the road surfaces at low speed (for instance in urban or suburban areas)
• when the ISO 11819-2 is used with a self-powered vehicle. The use of a quiet vehicle can avoid contaminating the measurements with power-unit noise.
Table 1 summarizes the advantages/disadvantages of the ISO 11819-1/2/4 standards and CPB method for different criterions (Haider, 2006), when conventional vehicles with internal combustion engine (ICE), electric powered (EV) and hybrid/electric (HEV) vehicles are investigated.
Table 1: Extension of the table displayed in the SILENCE report (Haider, 2006) to EV and HEV vehicles
Criterion NF EN ISO 11819-1 (SPB)
ISO/DIS 11819-2 (CPX) ISO/PAS 11819-4 (BB) CPB
ICE HEV EV ICE HEV EV ICE HEV EV ICE HEV EV
Speed range 30-130 km/h covered ++ ++ ++ ++ ++ ++ ++ ++ ++ ++ ++ ++ Sensitivity to engine noise influence ++ ++(H) --(E) -- --(H) --(E) -- ++ ++(H) --(E) -- ++ ++(H) --(E) --Resistance to background noise -- -- -- - - - -- -- -- -- --
--Usable for urban traffic
composition ++ ++ ++ - - - ++ ++ ++ ++ ++ ++
Accounts for heavy
trucks noise ++ ++ ++ -- -- -- ++ ++ ++ + + +
Short homogeneous test
sections possible ++ ++ ++ -- -- -- ++ ++ ++ ++ ++ ++
Length of measured road
section -- -- -- ++ ++ ++ -- -- -- -- --
--Time consumption ++ ++ ++ - - - ++ ++ ++ ++ ++ ++
Comparability to other
locations ++ ++ ++ ++ ++ ++ ++ ++ ++ + + +
Suitability for road
surface classification + +(H) ++(E) ++ + +(H) ++(E) ++ + +(H) ++(E) ++ + +(H) ++(E) ++
2.1.4 Contribution of the powertrain noise: the ISO 362 standards
The ISO 362 standards specify an engineering method for measuring the noise emitted by road vehicles of specific categories. The specifications are intended to reproduce the noise level generated by the principal noise sources during normal driving in urban traffic. These standards are:
• EN ISO 362-1: 2007 (ISO, 2007). This part of ISO 362 concerns the road vehicles of categories M (power-driven vehicles having at least four wheels and used for the carriage of passengers) and N (power-driven vehicles having at least four wheels and used for the carriage of goods)
• EN ISO 362-2: 2009 (ISO, 2009). This part of ISO 362 concerns the road vehicles of category L3, L4 and L5 (motor vehicles having fewer than four wheels). Vehicles in this category are not in the scope of the project FOREVER.
• ISO CD 362-3: 2012 (ISO, 2012-2). This part of ISO 362 describes an indoor testing of M and N categories.
The vehicles of category L1 and L2 (mopeds) are covered by the ISO 9645 standard, not reported here.
2.1.4.1 The EN ISO 362-1 standard
The EN ISO 362-1 standard describes an engineering method for measuring the noise emitted by road vehicles of categories M and N under typical urban traffic conditions. In order to take into account all the various situations encountered in urban driving conditions, a lot of parameters are introduced in the procedure. It requires a particular attention on the measurement characteristics:
• The measurement has to be carried out in open field conditions, without reflective obstacles in the vicinity of the test area (< 50 m). The test area has to be at least 20 m wide and 20 m long and covered with a reflective pavement according to the ISO 10844 standard7.
• Microphones are classically located in the standard position (1.2 m above the ground and 7.5 m from the centreline). Their electroacoustical characteristics have to comply with the ICE 61672-1 standard8.
• The signal recording is activated when the vehicle runs between two measurement lines located 10 m before and after the microphone position (cf. Figure 2).
• Measurements have to be performed under controlled weather conditions. Figure 2 illustrates the general disposition of the test site.
7
Figure 2: EN-ISO 362-1: test site requirements. The shaded test area must be fitted with a surface complying with ISO 10844. These test site requirements are also valid for EN-ISO 362-2
measurements.
The noise measurements to be carried out and the operating conditions depend on the vehicle category. The key point concerns acceleration tests performed over the 20 m test area and the related operating method. Its main features are summed up below.
For vehicles of categories M1, N1 and M2 with maximum authorized mass < 3500 kg: The two key parameters are the power-to-mass ratio index PMR and a wide-open-throttle reference acceleration defined as:
41 . 1 ) log( 59 . 1 , = PMR −
awotref for PMR 25 (5)
09 . 0 ) log( 63 . 0 , = PMR −
awotref for PMR < 25 (6)
The noise is measured in two operating conditions:
• an acceleration test: pre-tests are required to determine the operating conditions
appropriate to the vehicle. Typically, driving conditions are determined to allow the vehicle to fulfil both an acceleration target given by awot,refand a target speed 50 km/h
when some specific point on the vehicle is facing the microphone. The A-weighted maximum noise pressure level is recorded.
• a constant speed test at 50 km/h. The A-weighted maximum noise pressure level is
recorded.
Finally, a weighted mean of the noise levels with acceleration and at steady speed provides an estimate of the urban noise level Lurban, reproducing partial throttle acceleration conditions.
10 m
10 m
10 m
10 m
10 m
7.5 m
7.5 m
C
C’
A
A’
B
B’
Microphones
For vehicles of categories N2, N3, M3 and M2 with maximum authorized mass > 3500 kg:
The wide-open-throttle test is the only test for these heavy vehicle categories. The vehicle
runs on the 20 m test area with full acceleration and the target speed is 35 km/h. The engine speed must be included within a predefined interval at the end of the test area. The A-weighted maximum noise pressure level directly provides the estimate of the urban noise level Lurban..
2.1.4.2 The EN ISO 362-2 standard
This part of ISO 362 describes an engineering method for measuring the noise emitted by road vehicles of categories L3, L4 and L5 under typical urban traffic conditions. These vehicle categories are reported here for completeness although outside the scope of the FOREVER project. In the same way as specified in the EN ISO 362-1 procedure, the aim is to reproduce the noise generated in normal urban driving conditions (typically on roads with speed limits of 50 and 70 km/h).
The requirements of this procedure are similar to those described above, with two key parameters: a wide-open-throttle reference acceleration (awot,ref ) and the power-to-mass
ratio (PMR) index.
For L3 vehicles9with PMR > 25:
52 . 2 ) log( 47 . 2 , = PMR −
awotref for 25 < PMR 50 (7)
16 . 4 ) log( 33 . 3 , = PMR −
awotref for PMR > 50 (8)
The maximum A-weighted noise pressure level is measured in acceleration conditions akin to the above reference acceleration, respectively at constant speed, for a test speed in front of the microphone position of 40 km/h (for PMR 50) or 50 km/h (for PMR > 50). The final noise result Lurban is a weighted combination of the respective levels reported under
acceleration and at constant speed, reproducing partial throttle acceleration conditions. For vehicle of category L3 with PMR 25, the only operating condition is a wide-open-throttle acceleration test.
Note that the EN ISO 362-2 standard gives the possibility to perform indoor test operation using a dynamometer test bench simulating the road operation of the vehicle. This facility shall be installed in a hemi-anechoic room. The indoor method eliminates restrictions due to ambient outdoor conditions.
2.1.4.3 The EN ISO 362-3 standard
This standard specifies an engineering method for measuring the noise emitted by road vehicles of categories M and N by using a semi-anechoic chamber. The specifications are intended to achieve a correlation between testing the exterior noise of road vehicles in indoor conditions and the outdoor testing as described in the EN ISO 362-1 standard.
The general requirements and specifications are similar to those described in the EN 362-1 standard. The main difference concerns the test room requirements. The EN ISO 362-1
procedure imposes that tests shall be performed in free-field conditions. To reproduce this acoustic criterion indoors, the room-design must be able to provide a semi-anechoic space with the same effective propagation characteristics as an open space over a reflecting surface. An example of test room is shown in Figure 3.
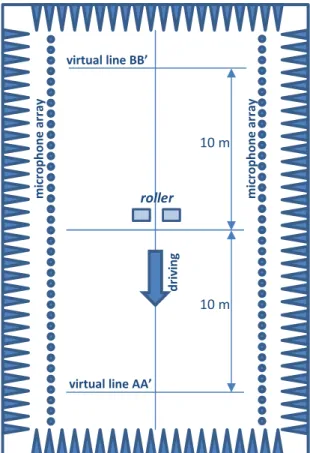
The measurement requires a set of microphones placed along a line at the distance of 7.5 m from the longitudinal centreline and extending 10 m on both sides of the vehicle. The standard outdoor pass-by noise characteristics are synthesized, either by combining indoor noise measures with outdoor rolling noise measures (variant A) or from indoor measurement only (variant B).
Figure 3: Example of a test room for indoor pass-by synthesis.
2.1.4.4 Comments on EVs/HEVs and the ISO 362-1/2/3
The ISO 362/1/2/3 is used for type approval. The vehicle operating conditions accepted in the standard intend to reproduce the contribution of the principal noise sources in normal urban driving conditions, rendering noisy realistic situations. As an example for the selection of the standard specifications, inquiries conducted on dwellers in Germany are cited, which indicate that the expressed noise annoyance and disturbance primarily concern urban main streets where the allowed speed is 50 km/h and during vehicle acceleration transients. Statistics pointing out that these are the most frequent traffic conditions on the main roads are given as well.
In the case of a future traffic composed of a significant part of EVs, it could be interesting to study whether the driving conditions and speeds associated with high annoyance would differ
roller
10 m
10 m
virtual line AA’ virtual line BB’ m ic ro p h o n e ar ra y m ic ro p h o n e ar ra y d ri vi n g
from the case with conventional engine vehicles, and thus check the accordance of the standard procedure with the population feeling in that case. In the conclusions of the European project CityHush, P. Stenlund (2011-1) recommended to perform the wide-open-throttle test of ISO 362 at a lower start speed for the electric cars equipped with a weak engine (PMR < 40), and proposed 30 km/h as an appropriate speed.
Finally, the testing of quiet vehicles requires a low background noise level in order to provide meaningful vehicle noise measures, implying that favourable environmental conditions may be difficult to fulfil on common outdoor test sites. The ISO 362-3 can provide a useful solution to this perspective.
2.2 Noise source analysis with a microphone array
A microphone array is an acoustic measurement device composed of a set of omnidirectional microphones. By an appropriate combination of the microphone signals, it comes down to a directive measurement device, able to separate signals coming from distinct space areas, for instance to separate signals from a source area on a vehicle from its neighbouring sources. The microphone distribution in space is decisive for the array performance. The array processing often used with microphone arrays for the analysis of vehicle noise sources at pass-by is the delay-and-sum beamforming.
Principle of beamforming
Let an array be composed of N microphones of respective coordinates (xn, yn, zn) with
n = 1…N. Let a monopole source be located at point S of coordinates (xS, yS, zS) (see Figure
4). In nearfield conditions where the wave fronts radiated by the source are spherical, the signal received on sensor n is:
−
=
c
r
t
s
r
t
p
Sn Sn nπ
4
1
)
(
(9)where rSnis the distance from the source S to sensor n, and c is the sound velocity.
Figure 4: Diagram of the microphone array, the source S and the focal point F
Delay-and-sum beamforming consists in compensating the propagation delays on the respective microphone signals in order to align the signals in phase, assuming the source to be at a given point F, and then averaging the signals. The output signal of the beamformed array focused on focal point F, in the maximum likelihood sense, is:
= =
+
=
N n Fn N n Fn n Fn nr
c
r
t
p
r
w
t
F
p
0 11
)
,
(
(10)where rFn is the distance between the focal point F and the sensor n. The wn, such that
= = N n n w 1
1, are the shading coefficients. The array favours signals coming from a source located at the focal point, while signals from sources located elsewhere are attenuated. This attenuation depends on:
• the array geometry (space distribution of sensors, size of the array)
• the source frequency
• the relative positions of the focal point and the source
• the coefficients wn
More details can be found in (Johnson, 1993). The distance between neighbouring microphones must be small enough to fulfil the Shanon condition for correct wave sampling at all frequencies. In order to keep constant spatial performance of the array over the useful frequency range, the shading coefficients can be specified as frequency dependent.
For separating several sources distributed in a plane, a 2-dimensional array has to be used. By scanning the source domain with the focal point, the actual location of the sources can be detected and the source strengths can be estimated. This method requires a multi-channel data acquisition system for recording the signals.
A limitation of the method at low frequency relates to the spatial resolution, which can be insufficient to separate close sources on a vehicle.
Application to moving sources and vehicles
In the case of a moving source, microphone signals are affected by variable frequency shifts through the Doppler effect and by unstationary conditions. A dedopplerization procedure allows the user to compensate for the frequency shifts and to track the moving source as well, thus increasing the exposure duration and the accuracy of the source analysis. This step requires information on the position and speed of the vehicle, taken simultaneously to the acoustical recordings.
At the end of the source scanning process at vehicle pass-by, a noise map of the side noise emission is built, per frequency band or in global noise levels (see Figure 5). It can be improved by the use of deconvolution methods in order to cancel blurring introduced by the array pattern. With further analysis, noise emission models can be determined for the main noise source areas.
Compared with common measurement methods involving a single microphone, microphone array methods have the following properties:
Advantages:
• Identification of the spatially-distinct noise sources on the vehicle
• Low sensitivity to background noise
• Production of noise emission maps of the vehicle at pass-by
Disadvantages:
• poor spatial resolution at low frequencies
• inaccurate estimation of the noise source location and strength if the physical source differs strongly from a compact source / monopole (in particular forward or backward highly directive source)
• higher equipment cost, processing and computational load
Figure 5: Exemple of a two-dimensional microphone array (left) and global noise map of a hybrid car (right). [source IFSTTAR]
2.3 Measurement of the minimum noise emission
Standards have been recently published, specifically devoted to low noise vehicles. They concern the measurement of a minimum noise emission, with the background of preserving the safety of pedestrians through the audibility of the vehicle.
Considering that electric and hybrid vehicles may be too silent to be detected by pedestrians when stopped, moving at low speed or commencing motion, the standard SAE J2889-1 has been published in 2012 to determine the minimum noise emission of vehicles (SAE, 2012). A new version is currently prepared under reference ISO/CD 16254 (ISO, 2013-2). Both are technically similar. One part of these standards concerns the evaluation of an external sound generation system, if available. The present subsection reports the measurement specification of the minimum vehicle noise emission, apart from those specific to the sound system.
For outdoor measurement, the characteristics of the test site are similar to those of the pass-by tests previously described, with a 20 m long test area, free of reflecting objects. For the full vehicle testing, the microphone is located at 2 metres from the track centre and 1.2 metre above the ground level. Indoor measurement is also allowed. The vehicle operating conditions include:
• vehicle stopped in front of the microphone: the minimum A-weighted sound pressure level Lstopis reported.
• slow speed cruise at 10 km/h: the maximum A-weighted sound pressure level Lcrs
during pass-by is reported.
One-third-octave results shall be reported at the time of each A-weighted sound pressure level specified above. A measure with the vehicle commencing motion is intended for the evaluation of the sound system.
A specificity of these standards concern how the background noise is taken into account and corrections are proposed. The background noise reference is the minimum A-weighted sound pressure level recorded in a 10-second sample, as well as the corresponding one-third-octave frequency spectrum. Since background noise level is crucial and may become problematic in case of low noise source measurement in outdoor environment, the use of correction terms to be applied to the measured noise levels is allowed from a 10 dB down to a 3 dB difference between the overall test value and the background noise level, as illustrated in Table 2 for background noise levels larger than 25 dB(A).
Table 2: Correction to be applied to the test results according to SAE J2889-1 and ISO/CD 16254 for a background noise level larger than 25 dB(A) and peak-to peak fluctuation smaller than 2 dB(A)
Test result minus background noise level Correction
> 10 dB 0 dB 8 dB to 10 dB 0.5 dB 6 dB to 8 dB 1.0 dB 4.5 dB to 6 dB 1.5 dB 3 dB to 4.5 dB 2.5 dB < 3 dB X
These standards are intended to be used in relation with regulations specifying a minimum noise level for low noise vehicles.
2.4 Description of individual vehicles in the noise assessment
methods
Various road traffic noise prediction models have been developed in different countries for the noise assessment of road infrastructures (Garg, 2014). These models generally include both a vehicle noise emission model and a propagation model. This subsection reviews the sole source description used for road traffic noise in these prediction models, representing the sound emitted by an average individual vehicle of the traffic. These vehicle noise emission models have different features and are adapted to specific road network and road surfaces, traffic flow and vehicle types. The sound representation of the vehicles in the following models is briefly described:
• the American model developed by the Federal Highway Administration (FHWA)
• the Japanese ASJ-RTN model
• the Nord2000 model developed by the Nordic European countries
• the Harmonoise/Imagine model, developed by several western European countries in the frame of a European research project
• the Swiss model OFPE
• the German model RLS 90
• the French model NMPB08
• the CNOSSOS-EU model
At the end of the subsection, the main features of these vehicle noise emission models are compared in a summary table.
In the further work of the project FOREVER, the CNOSSOS-EU vehicle model is deepened in relation with electric and hybrid vehicles.
2.4.1 Federal Highway Administration Traffic Noise Model (FHWA-TNM)
The FHWA-TNM (FHWA-TNM, 1998) is the highway traffic noise prediction model available in the United States. As sources of noise, it provides the maximum A-weighted sound pressure levels and one-third octave-band spectra of the noise radiated by a vehicle at a 15 m distance from the road. These input data result from measurement campaigns carried out to determine vehicle noise emission, considering different vehicle types, road pavements, vehicle speeds and throttle positions. These levels were analysed to find out a general equation governing the radiated sound levels, generally referred to as REMEL (Reference Energy Mean Emission Levels). The FHWA-TNM model considers five categories of vehicles:
• automobile (gross vehicle weight < 4.5 t)
• medium trucks
• heavy trucks
• buses
• motorcycles
The energy radiated is split into two separate noise sources, respectively located at a height of 0 m and 1.5 m, except for heavy trucks whose higher source is at 3.66 m. The ratio of sound energy distributed to each sub-source is variable. Four road pavements and two throttle positions (cruising or full-throttle) are considered. To compute the sound pressure level in dB(A), FHWA-TNM uses three constant coefficients (A, B, C). The A-weighted SPL at 15 m is given by:
(
/10 /10 /10)
10 10 ) 6214 . 0 ( log 10 ) (v v A B C L = + [dB(A)] (11)where
v
is the vehicle speed in km/h. Fourteen additional coefficients need to be considered to convert the A-weighted noise levels to third octave band spectra. All the seventeen coefficients depend on the vehicle type, road pavement and vehicle throttle position.This model does not estimate engine noise and tyre noise separately but gives the total sound pressure level radiated by a conventional engine vehicle at a 15m distance from the road.
A proposal of REMEL input data for electric vehicles was recently made; it is presented in the literature review in section 0.
2.4.2 ASJ-RTN model
The Japanese traffic noise model considers each vehicle constituting the traffic as a single point source (Yamamoto, 2010). No separation between engine and tyre/road noise is considered. Depending on the expected precision of the model, two categories of vehicles (light and heavy vehicles) or four (passenger cars, small-sized vehicles, medium sized vehicles, large sized vehicles) – and optionally a motorcycle category – are considered in two running conditions (steady and non-steady speed). Two different road pavements (dense and porous asphalt), road gradients and source directivity are taken into account. The A-weighted sound power level emitted by a vehicle is expressed as:
dir grad surf WA v a b v L L L L ( )= + log( )+∆ +∆ +∆ [dB(A)] (12) where:
•
v
is the vehicle speed in km/h• a and b are regression coefficients
• ∆Lsurf [dB(A)] is the correction for porous asphalt (ref. to dense asphalt)
• ∆Lgrad [dB(A)] is the correction for road gradient
• ∆LA [dB(A)] is the correction for sound radiation directivity. Octave and third octave band levels can also be estimated using equation:
) ( ) ( ) , (v f L v L f LWA = WA +∆ WA [dB(A)] (13)
The values for the regression and correction coefficients can be found in (Yamamoto, 2010).
2.4.3 Nord2000 model and Harmonoise/Imagine models
These models use different approaches for sound propagation but the source modelling is common (Jonasson, 2006), (Jonasson, 2004). Four vehicle categories10 are considered in Imagine: light vehicles, medium heavy vehicles, heavy vehicles, and two-wheelers. The separate equations used to estimate the sound power levels govern engine and tyre/road noise respectively. For both components, correction factors can be applied to simulate non-standard road surfaces, road gradients, vehicle transient running conditions and other particular conditions. The general equation for the sound power level due to propulsion noise is:
)
,
(
)
,
(
)
(
)
(
)
,
(
L
,v
f
L
,v
f
v
v
v
f
B
f
A
f
v
L
wproad wpother ref ref p p wp+
∆
+
∆
−
+
=
(14) where : • is the speed [km/h] • v = 70 km/h • f is the frequency in Hz 10• ( ) and ( ) are coefficients obtained from tables provided in (Jonasson, 2004) for Harmonoise model and (Jonasson, 2006) for Nord2000 model.
• Δ , ( , ) ∆L , (v, f)is the correction factor accounting for the effect of the road surface on the propagation of propulsion noise.
• Δ , ! ( , )∆L , "# (v, f) is the correction factor accounting for vehicle acceleration, road gradient, percentage of diesel vehicles and proportion of delivery vans (for light vehicles only)
The general equation of the sound power level due to the tyre/road interaction noise is: ) , ( ) , ( ) log( ) ( ) ( ) , (v f A f B f v v L , v f L , v f
Lwr = r + r ref +∆ wrroad +∆ wrregion (15)
where:
• ( )A (f) and ( ) B (f)are coefficients provided in (Jonasson, 2004) for Harmonoise model and (Jonasson, 2006) for Nord2000 model.
• Δ , ( , )∆L , (v, f) and Δ , %& '( , )∆L , ( )(v, f) are correction factors accounting for various environmental and traffic parameters such as air temperature, road humidity, road pavement, number of axles per vehicle, number of tyres per axle, tyre width and proportion of delivery vans.
The propulsion and tyre/road noise sound power levels are assigned to two equivalent point sources. One is located at 0.01 m above the road and the second one at 0.3 m (light vehicles) or 0.75 m (heavy vehicles). The lower source carries 80% of the rolling noise and 20% of the propulsion noise. The upper source carries 80% of the propulsion noise and 20% of the rolling noise, for all vehicle categories.
2.4.4 The Swiss OFEV models
The StL-86+ Model (OFEV, 1987)(OFEFP, 1995)
The StL-86, dedicated to the prediction of road traffic noise and developed by the Swiss Federal Office for the Environment (FOEN), is based on data collected during the 80’s. In 1995, the FOEN updated the method which was re-called StL-86+.
The general equation giving the A-weighted equivalent level at a distance of 1 m is:
) log( 10 150 1 . . 1 . 50 1 log 10 3 M v B v A Leq = + + +
η
− + (16) where:•
A
andB
are empirical constants (A
= 43 ;B
= 20)•
v
is the speed• ηis the proportion of heavy trucks present in the total traffic
•
M
is the flow rate (vehicle/h)A correction factor K is proposed in order to take into account the increase of emitted noise for slopes larger than 3%:
The SonRoad Model (OFEV, 2004)
This model, developed by EMPA and published in 2004, is derived from ISO 9613-2 specifications. In this model, the vehicle is represented by a point source at 0.45 m above the ground. The engine and tyre/road components are calculated separately as a function of speed, slope, road surface and traffic flow characteristics. Two categories of vehicles are considered (light vehicles and trucks). The global LAmax levels (estimated at the distance of
7.5 m from the road centreline and at 1.2 m high) are given by the following expression:
r s r p A v L v L v L max( )= ( )⊕ ( )+∆ +∆ (18) where:
• Lp corresponds to the propulsion noise component :
+ + = 5 . 3 0 1 log ) ( v v B A v Lp p p (19)
• Lr corresponds to the tyre/road noise component : ) log( )
(v A B v
Lr = r + r (20)
• Ap, Bp, Ar and Br are coefficients defined for each vehicle category
• Δ*is a correction factor taking into account the noise increase due to slopes:
• Δ*= 0,8g where
g
is the percentage of slope• ∆r is a correction factor taking into account the type of road surface.
The noise spectrum is provided in one-third octave bands.
2.4.5 The German model RLS 90
The RLS 90 model (Richtlinie für den Lärmschutz an Straßen – Guidelines for Noise Protection on Roads) is the German prediction method for new roads and for existing roads with substantial changes (i.e. new lanes) (RLS 90, 1990) (Hamet, 1996).
This model provides A-weighted equivalent noise pressure levels on a period of 1 hour, for a traffic flow including a specified part of heavy vehicles, at a distance of 25 m and a height of 4 m, in the reference conditions:
• horizontal, infinitely long road
• road surface reference which is non-grooved poured asphalt concrete
The equivalent noise level for a light vehicle at the steady speed vPkw is expressed by:
[
1 (0.02 )]
log 10 7 . 27 ) ( Pkw Pkw Pkw v v L = + + (30 vPkw 130 km/h) (21)whereas for a heavy truck (> 2.8t) at the steady speed vLkw the equivalent level is given by:
[ ]
LkwLkw
Lkw v v
L ( )=23.1+10log (30 vLkw 80 km/h) (22)
Correction factors are provided for road surface types different from the reference surface and for roads with gradients.


![Figure 13: A-weighted maximum sound pressure level at constant speed pass-by (black curve) and under several acceleration rate (colour curves) for the electric Peugeot 106, on a microphone at 7.5 m and 1.2 m height [source IFSTTAR]](https://thumb-eu.123doks.com/thumbv2/123doknet/12377230.330072/48.892.236.657.157.415/weighted-pressure-constant-acceleration-electric-peugeot-microphone-ifsttar.webp)