HAL Id: hal-01716703
https://hal.archives-ouvertes.fr/hal-01716703
Submitted on 28 Feb 2018HAL is a multi-disciplinary open access archive for the deposit and dissemination of sci-entific research documents, whether they are pub-lished or not. The documents may come from teaching and research institutions in France or abroad, or from public or private research centers.
L’archive ouverte pluridisciplinaire HAL, est destinée au dépôt et à la diffusion de documents scientifiques de niveau recherche, publiés ou non, émanant des établissements d’enseignement et de recherche français ou étrangers, des laboratoires publics ou privés.
Influence of angularity of coarse fraction grains on
internal erosion process
Didier Marot, Fateh Bendahmane, Hong Haï Nguyen
To cite this version:
Didier Marot, Fateh Bendahmane, Hong Haï Nguyen. Influence of angularity of coarse fraction grains on internal erosion process. International Conference on Scour and Erosion (ICSE6), Aug 2012, Paris, France. �hal-01716703�
Influence of angularity of coarse fraction grains on
internal erosion process
Didier MAROT
1, Fateh BENDAHMANE
1, Hong Haï NGUYEN
11
Institut GeM, l'Université Nantes Angers Le Mans LUNAM, CNRS IUT de Saint-Nazaire, BP 420, 44606 Saint-Nazaire Cedex, France
e-mail : [email protected], [email protected], [email protected]
In earth structures and their foundations, two types of erosion can be distinguished: interface erosion and suffusion. This paper deals with suffusion process also named internal instability, which takes place inside the soil matrix. In this process, finer particles of a soil migrate within its own pore spaces. These fine particles can be cohesionless particles or clay particles. With the objective to study the effect of angularity of coarse fraction grains on suffusion a series of tests was performed on different clayey sand. Three sand type samples were tested which are different by the grain size distribution and also by the angularity of grains. A specific triaxial device was used in order to force fluid through the samples in downward direction under constant hydraulic gradients.
It is shown that the angularity of coarse fraction grains may contribute to increase the erosion resistance of the tested soils by a factor of 5. Moreover for the tested soils, the grain shape has an effect on hydraulic conductivity decrease. The angularity of coarse fraction grains may intensify the geometric blocking of eroded clay particles.
Finally a study is conducted to compare the different ways to characterize the angularity of grains: by an analysis of grain pictures, by using an angulometer or by measuring the internal friction angle.
Key words
Geotechnical engineering, suffusion sensitivity, laboratory experiments, clayey sand.
I INTRODUCTION
In hydraulic earth structures and their foundations, the flow of a fluid can produce a migration of the solid particles which can generate a modification of the mechanical and hydraulic properties of soil.
In the case of not fissured soils, two types of internal erosion are distinguished [Fell, 2007]: backward erosion and the suffusion. The first process consists in a regressive pulling up of the particles from the downstream of the soil to an external middle with an upward development [Lafleur, 1999; Bendahmane, 2008; Marot, 2009]. The suffusion phenomena concerns only the fine particles and results in a diffuse redistribution of particles within the soil. The global grain size distribution of the soil changes slightly but the hydraulic conductivity can evolve notably [Lafleur, 1999; Bendahmane, 2008; Marot, 2009].
Suffusion and backward erosion result from the seepage flow in the soil pores. Consequently, their initiation and their development depend on the geometry of the interstitial vacuums. This space is conditioned by the granular assembly, itself depending on the distribution of the grain size, the fabric and the shape of grains. The analysis of the influence of grain size distribution was the subject of several criteria for the evaluation of the erosion initiation [Wan, 2008; Li, 2008; among others]. The influence of the mechanical loading conditions was studied notably by [Skempton, 1994] and [Moffat, 2011]. There are few research projects on the influence of the grain shape, however according to [Voivret, 2008] the shape of grains is an intrinsic characteristic of granular mediums which could significantly affect their mechanical behaviour. Moreover in 1981, Kovacs proposed to calculate the diameter of the average pore by using a shape coefficient whose values ranging between 6 for the spherical particles and from 7 to 9 for the more angular particles. Thus shape of grains seems to have an influence on pore diameter size which is a key parameter of seepage flow in porous media.
In this study, we propose different methods to quantify the shape of the grains of three coarse fractions: Loire sand, Fontainebleau sand and glass beads. The influence of the shape of the coarsest grains on the suffusion process was studied for mixtures all composed of the same clay and different coarse fractions.
II EXPERIMENTAL DEVICES
Two experimental devices were used: one to characterize the grain shape and the second to quantify the influence of the grain shape on suffusion.
II.1 Triaxial bench for suffusion tests
Figure 1 shows the testing device used to study the suffusion process. The device consists of a triaxial cell coupled to a hydraulic system designed to generate seepage flow through the specimen in downward direction in hydraulic-gradient-controlled conditions. A complete description of the device is given by [Bendahmane, 2008].
Figure 1: Schematic diagram of the triaxial erodimeter. Figure 2: Schematic diagram of optical sensor.
The quantity of eroded particles can be very small. Thus the measurement by weighing or by visual observation is not accurate enough to detect the initiation of suffusion. Therefore, this triaxial device is equipped with the multichannel optical sensor described below. The optical sensor is placed at the end of the draining pipe at the base of triaxial set-up. The small dimensions of the device allow placing it vertically close to the base of the sample and this position avoids any deposition of the eroded particles between sample and optical sensor. A complete description of the device is given by [Marot, 2011]. Thanks to a previous calibration, the optical sensor allows measuring the clay concentration, C, within the fluid which is expressed by the ratio of clay mass particles and water mass within the fluid. It is worth noting that this sensor allows to distinguish between the sand grain and fine particle in the effluent.
II.2 Methods used for the characterization of grain angularity
Each grain can have a specific shape, in consequence the used methods have to characterize the shape of representative number of grains. Two methods are used: optical and mechanical. The optical method consists in the use of an optical microscope (maximum enlargement: 40) associated with a digital camera and a software of picture analysis. The digital image analysis is performed on 100 pictures for each tested aggregate and consists in calculating the roundness and circularity defined respectively by:
A P Roundness . . 4 2 (1)
2 1 1
n i moy i r r n y Circularit (2)where P is the grain perimeter, A is the grain cross section, ri is the grain radius, rmoy is the average radius
grain and n is the number of the measured radius.
The mechanical method consists in carrying out tests, on one hand by direct shear box, and on the other hand by gravitating flows with a sand angulometer.
The shear tests are carried out on dry aggregates, with density index Id near to 1 (Id = [emax – e]/[emax - emin]
where emax, emin are the maximum and minimum values respectively of the void ratio e). For various
aggregates of the same grain size distribution, the internal friction angle obtained by this test depends on the form and the coarseness of the grains. The used testing method is described by standard [NF P 94-071-1, 1994].
The angulometer is constituted by a standardized funnel and the test consists in measuring the flow duration (Ecm) of various materials. With the objective to assure test representativeness, each test is
performed with a mass of grains about 1kg. The more grains are angular, the more duration is important. These tests are carried out in conformity with standard [NF EN 933-6, 2002]. The angularity index (IA) is the
ratio of the flow duration of an aggregate to the flow duration of mixture of glass beads with an identical grain size distribution.
III TEST PROCEDURE FOR SUFFUSION TESTS
III.1 Tested materials and specimen preparation
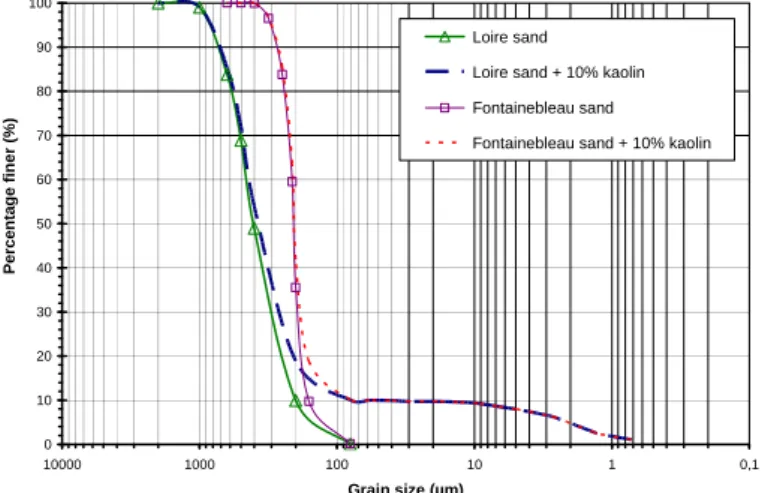
As the sensor accuracy allows a fairly precise detection of clay particle erosion (for a clay concentration up to 1.6 mg/g, the maximum relative error is 3%; for a concentration between 1.6 and 12 mg/g the maximum relative error is 5% and a concentration higher than 12 mg/g and up to 90 mg/g, the maximum relative error is 3%, [Marot, 2011]), several suffusion tests are performed on different mixtures of 10% of kaolin and 90% sand. As shown in Figure 3, the grain size distributions of tested mixtures are gap graded. With such type of gap graded soils, the coarse fraction is composed of sand grains and the fine fraction corresponds to the clay fraction. Liquidity and plasticity limits of kaolin are 55% and 22%, respectively. Three sand types are tested, the first is a Fontainebleau sand (grain size distribution within the range 75 µm – 425 µm, mean diameter
D50=207 µm, uniformity coefficient=1.33; grain density=26.5 kN/m 3
). A second sand, referred to as Loire sand, has a different grain size distribution (grain size distribution within the range 80 µm-1 mm,
D50=440 µm, uniformity coefficient=3.13, grain density=26 kN/m 3
). The third sand (i.e. modified Loire sand) is composed of grains from the Loire sand using 10 different grain-size fractions in order to correspond to the grain-size distribution of Fontainebleau sand.
0 10 20 30 40 50 60 70 80 90 100 0,1 1 10 100 1000 10000 Grain size (µm) Percenta ge finer (%) Loire sand Loire sand + 10% kaolin Fontainebleau sand Fontainebleau sand + 10% kaolin
Figure 3: Grain size distribution of sands and tested mixtures.
By using the method proposed by [Wan, 2008] for assessing the potential of suffusion, the three mixtures would be defined as unstable.
III.2 Testing program
The specimen preparation phase is divided into three steps; production of the specimen, saturation, and finally consolidation. The sand grains are first mixed with a moisture content of 8%. Then, while mixing continues, powder clay is progressively added and mixing is then carried on for an additional 10 minutes. After ensuring homogeneity of the grain size distribution by comparing measurements on several fractions of the mixture, the installation of specimens inside the cell required preliminary forming. The specimens are prepared using a single layer semi-static compaction technique. The mixture is placed in a mould of 50 mm diameter and 50 mm height and subsequently compressed under the action of two pistons until the initial fixed dry density (before consolidation) is reached. This initial dry density value is 17 kN/m3, and after consolidation under 100 kPa, the dry density is 17.5 kN/m3. In the triaxial cell device, the specimen is placed on a 4 mm pore opening grid. This pore opening allows the migration of all particles of sand and clay. A smaller pore opening grid would prevent the migration of sand grains, which in turn, would limit the initiation of suffusion process [Marot, 2009].
The saturation phase begins when a small 20 kPa confinement pressure is applied to prevent any preferential leakage between the specimen and the membrane. Carbon dioxide is used to improve dissolution of gases into water, and finally saturation is completed by demineralized and deaerated water. The whole saturation phase requires approximately 24 hrs.
The isotropic confining pressure 3 is increased in steps in conformity with standard [NFP 94-074, 1994]
procedures to reach 100 kPa.
With the objective to recover grains which could fall in the funnel-shaped draining system during the specimen preparation, a very small quantity of water is injected with low pressure by a lateral pore situated under the 4 mm pore opening grid and it is recovered by the effluent tank. Finally, the specimen is subjected to a hydraulic flow in a downward direction using demineralized and deaerated water in order to keep the injected fluid characteristics identical. With the objective to study the initiation and the development of suffusion, three tests (named F1 to F3) are performed on mixture of Fontainebleau sand and kaolin and three tests are performed on Loire sand and kaolin mixture (tests named L1 to L3). Such mixtures are different by the grain size distribution and also by the grain shape of coarse fraction. To study the influence of grain shape, one test is performed on modified Loire sand (LM) and a mixture of glass beads is prepared with the grain size distribution as the Fontainebleau sand. The used test procedure is the same for these tests as for the aforementioned tests, however no test can be performed on mixture of clay and glass beads because all these specimens fail during saturation phase.
Table 1 indicates the values of applied hydraulic head and hydraulic gradient for each performed tests.
Soil specimen Hydraulic head
(cm) Hydraulic gradient i (m/m) F1 3 0.6 F2 4 0.8 F3 12.5 2.5 L1 12.5 2.5 L2 25 5 L3 100 20 ML 4 0.8
Table 1: Applied hydraulic head and hydraulic gradient for suffusion tests.
IV TEST RESULTS AND DISCUSSION
IV.1 Characterizations of the angularity of aggregates
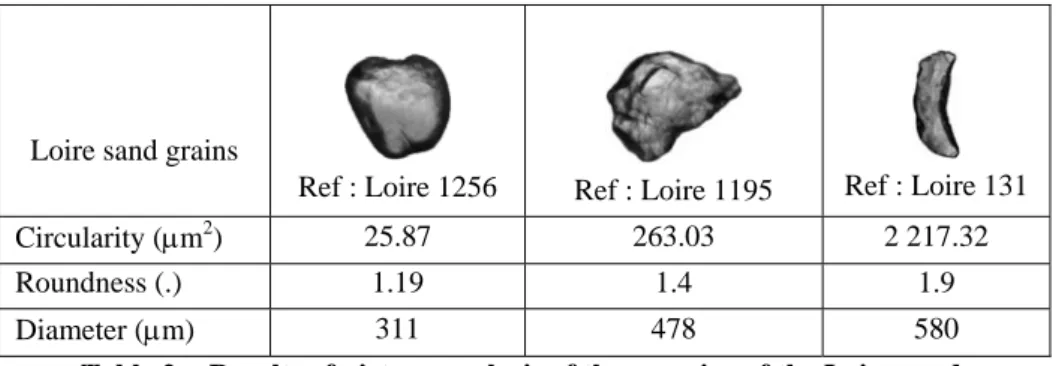
Roundness (Equation (1)) and circularity (Equation (2)) was computed by analysing digital images of grains. Circularity is very sensitive to the grain shape and its median value characterizing an aggregate can be strongly influenced by some grains like illustrates by the example of three grains of Loire sand (see Table 2).The comparison between the first grain (Ref. 1256) and the third grain (Ref. 131) shows that circularity is multiplied by a factor 85 whereas the associated roundness is multiplied by a factor 1.6.
Loire sand grains
Ref : Loire 1256 Ref : Loire 1195 Ref : Loire 131
Circularity (m2
) 25.87 263.03 2 217.32
Roundness (.) 1.19 1.4 1.9
Diameter (m) 311 478 580
Table 2: Results of picture analysis of three grains of the Loire sand.
For each aggregate, about 100 pictures are analysed in order to determine a mean value of roundness and circularity. The mean values of circularity and roundness for the Loire sand, Fontainebleau sand and glass
0.0 0.1 0.2 0.3 0.4 0.5 0.6 0.7 0 200 400 600 800 1000 1200 1400 C onc ent rat ion C (m g/ g) Time (s) F1, i = 0.6 F2, i = 0.8 F3, i = 2.5 1.E-06 1.E-05 1.E-04 0 200 400 600 800 1000 1200 1400 H y dra u lic c o nduc ti v it y k (m /s ) Time (s) F1, i = 0.6 F2, i = 0.8 F3, i = 2.5 10-4 10-5 10-6
beads are presented in Table 3. The corresponding values of standard deviation (in brackets in Table 3) underline the dispersion of measurements, notably for circularity values. The results show that glass beads don’t have roundness equal to 1, therefore their shape isn’t perfectly spherical. The Loire sand is the most angular studied aggregate (in comparison with the glass bead, it has a roundness 1.26 times higher and a 50 times larger circularity). The Fontainebleau sand is characterized by an intermediate value situated between the two other aggregates (compared to the glass bead, roundness 1.23 times higher and circularity multiplied by 18).
Aggregate
glass bead Fontainebleau sand Loire sand
Circularity (m2
) 3 (22) 63 (52) 178 (305)
Roundness (.) 1.13 (0.06) 1.39 (0.15) 1.42 (0.19)
Table 3: Results of analysis of 100 pictures for each aggregate. Mean value (value of standard deviation in brackets).
The values of the internal friction angle are: 30° for glass beads, 37° for the Fontainebleau sand, 44° for the Loire sand and 43° for the modified Loire sand.
The angulometer measurements first consists to measure the average flow duration during the test, Ecm. The
flow durations for glass beads, Fontainebleau sand and Loire sand are respectively: 17s, 22s and 23s. So the corresponding values of IA were 1, 1.29 and 1.35.
Whatever indicator is considered to characterize grain shape, the same relative classification of the three aggregates is obtained. The Loire sand displays the largest values (roundness, circularity, internal friction angle, gravitating flow duration and Index IA), glass beads are characterized by the smallest values and the
Fontainebleau sand by intermediate values. IV.2 Characterization of suffusion erodibility
Variations with time of kaolin concentration are plotted in Fig. 4(a) for tests F1, F2 and F3. Test F1 is performed with a hydraulic gradient i=0.6, and no erosion is detected. With i=0.8 (test F2), the kaolin concentration in effluent increases steadily to reach 0.1 mg/g after 2 minutes of downward flow. After reaching a peak, the kaolin concentration, C, decreases very slowly over time (7 10-2 mg/g at t=30 min). With a hydraulic gradient of i=2.5 (test F3), kaolin concentration in the effluent is about 0.5 mg/g.
Figure 4(b) shows the variations of hydraulic conductivity with time. For tests F1 to F3 initial value of hydraulic conductivity is between 10-5 m/s to 1.8 10-5 m/s. For test F1, the hydraulic conductivity stays constant for the whole duration of test, about 1.5 10-5 m/s, whereas for F2 and F3 tests it decreases with time.
(a) (b)
Figure 4: Instantaneous values of (a) kaolin concentration in effluent and (b) hydraulic conductivity for kaolin – Fontainebleau sand mixtures.
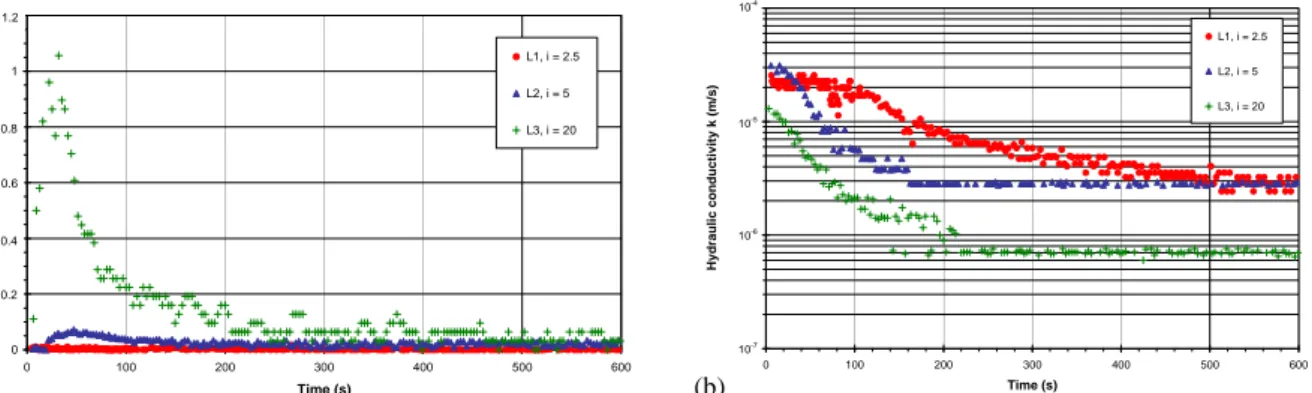
Tests results on Loire sand and kaolin mixtures are plotted on Figure 5 in terms of the evolution with time of: (a) concentration of kaolin in the effluent and, (b) hydraulic conductivity. For i=2.5 (test L1) a very low
1,E-07 1,E-06 1,E-05 1,E-04 0 100 200 300 400 500 600 Time (s) H y drauli c conductivi ty k (m/ s ) L1, i = 2.5 L2, i = 5 L3, i = 20 10-4 10-5 10-6 10-7 0 0,2 0,4 0,6 0,8 1 1,2 0 100 200 300 400 500 600 Time (s) Co nc en tratio n C (mg /g) L1, i = 2.5 L2, i = 5 L3, i = 20 1.2 0.8 0.6 0.4 0.2 0,00 0,02 0,04 0,06 0,08 0,10 0,12 0 100 200 300 400 500 600 700 800 Time (s) Con c ent rat ion C ( m g/ g) F2 ML 0.12 0.10 0.08 0.06 0.02 0.0 0.04
kaolin concentration (< 10-2 mg/g) is measured in the effluent. During test L2, i.e. for i=5, the kaolin concentration in the effluent increases sharply to reach 7 10-2 mg/g in forty seconds, followed by a rapid kaolin concentration decrease with time (at t=140 s, C=0 mg/g). For a high value of hydraulic gradient, i=20 (test L3) the kaolin concentration increases up to 1.1 mg/g after a period of 30 seconds. It is followed by a decrease over a few minutes (C=0 mg/g at t=470 s). Figure 5(b) shows that the hydraulic conductivity decreases with time, and in this case of kaolin Loire sand specimens the minimal value of hydraulic conductivity occurs well after the maximum value of eroded clay concentration is observed.
(a) (b)
Figure 5: Instantaneous values of (a) kaolin concentration in effluent and (b) hydraulic conductivity for kaolin – Loire sand mixtures.
IV.3 Influence of grain size distribution and coarse fraction grain shape
Both tests F3 and L1 are performed with i=2.5. The comparison of the results exhibits difference in the maximum value of eroded clay concentration (Cmax=0.5 mg/g for test F3 and Cmax < 10
-2
mg/g for test L1). This great difference may be due to the effect of grain size distribution and also coarse fraction grain shape.
Specimen tested in tests F2 and ML have the same grain-size distribution (Fontainebleau sand) and both tests are performed with i=0.8. The comparison of the results reveals that the maximum eroded clay concentration is Cmax=0.02 mg/g with modified Loire sand (ML), and Cmax=0.1 mg/g with Fontainebleau
sand (see Figure 6). As the grain shape is the only variable for both tests carried out under similar conditions, it is suggested that the increase of the resistance of the tested soils by a factor of five may be due to the effect of grain shape.
Figure 6: Instantaneous values of kaolin concentration in effluent kaolin-Fontainebleau sand mixture and kaolin-modified Loire sand mixture.
As shown in Figure 7, a greater magnitude of hydraulic conductivity decrease can be observed with the modified Loire sand in comparison with Fontainebleau sand. Thus the angularity also has an effect on hydraulic conductivity decrease. In conformity with previous conclusions [Reddi, 2000; Bendahmane, 2008; Marot, 2009, 2011] this decrease in hydraulic conductivity is attributed to particle filtration which may induce a clogging process.
It is worthwhile to stress that in the case of kaolin-Loire sand mixture, no significant clay concentration in effluent and no significant decrease of hydraulic conductivity are measured for applied hydraulic gradient
1,E-06 1,E-05 1,E-04 0 100 200 300 400 500 600 700 800 Time (s) H y dr au li c co nd uc ti v it y k ( m /s ) F2 ML 10-4 10-5 10-6
Figure 7: Instantaneous values of hydraulic conductivity
kaolin-Fontainebleau sand mixture and kaolin-modified Loire sand mixture.
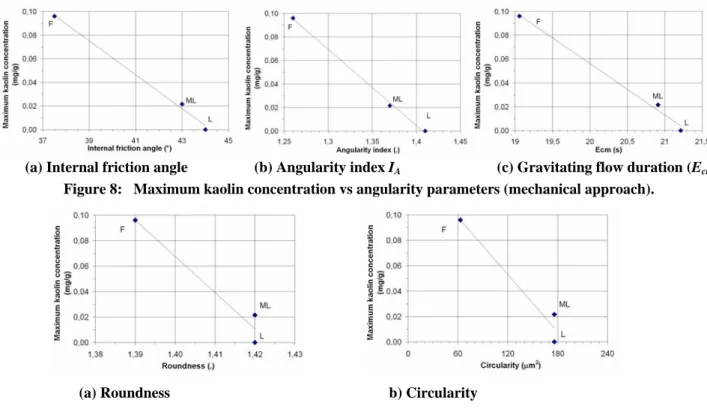
Figures 8 and 9 show the maximum values of kaolin concentration measured during suffusion tests versus the parameters characterizing the grain shape. Parameters determined by mechanical approach (internal friction angle, gravitating flow duration and angularity index) are used in Figure 8 and parameters determined by optical approach (circularity, and roundness) are used in Figure 9. Maximum kaolin concentration decreases in function of these five parameters, and in the case of parameters determined by mechanical approach, linear correlations can be built.
(a) Internal friction angle (b) Angularity index IA (c) Gravitating flow duration (Ecm)
Figure 8: Maximum kaolin concentration vs angularity parameters (mechanical approach).
(a) Roundness b) Circularity
Figure 9: Maximum kaolin concentration vs angularity parameters (optical approach).
As grains in Loire sand and in modified Loire sand are identical, roundness and circularity don’t permit to distinguish these two aggregates. Moreover, according to the great values of standard deviation of these optical parameters, the mechanical approach has to be preferred to characterize the influence of grain angularity on suffusion process.
V CONCLUSION
Two series of tests were performed in order to characterize the suffusion sensibility of three mixtures of kaolin-aggregates and also to measure grain angularity of the different used aggregates.
Characterization of grain angularity was carried out by using optical and mechanical methods. Optical method was based on measurements of roundness and circularity and mechanical approach consisted to measure internal friction angle, gravitating flow duration and angularity index. These methods led to the same relative classification of the grain angularity for the three aggregates. By using a triaxial erodimeter,
the suffusion sensitivity of three mixtures of kaolin-aggregates was determined. Results clearly demonstrate that suffusion process depends on the grain angularity of coarse fraction. With a same grain size distribution, angularity of coarse fraction grains contributes to increase the suffusion resistance.
The values of maximum kaolin concentration in effluent measured during suffusion tests were compared with measurements of grain angularity of coarse fraction. Both optical and mechanical methods allow obtaining correlations between maximum kaolin concentration and angularity. However as the mechanical method takes into account the influence of grain shape and also the influence of grain-size distribution, this method seems to be the more appropriated to characterize the influence of the grain shape on the process of erosion by suffusion.
In the cases of volume erosion and interface erosion in cohesionless soils, further studies are required to characterize the influence of grain angularity of both fine and coarse fractions. With this objective, erosion tests could be performed on mixtures composed by a coarse fraction with a known shape and several fine fractions.
VI ACKNOWLEGMENTS
This research project was sustained by the World Bank (Project TRIG, University of Danang, Vietnam), by the French National Research Agency (Project ERINOH) and the French Institute for Applied Research and Experimentation in Civil Engineering (IREX).
VII REFERENCES
Association Française de Normalisation. (1994). – Essais à l’appareil triaxial de révolution. Standard NFP 94-074. AFNOR, Saint-Denis, France.
Association Française de Normalisation. (1994). – Sols : Reconnaissance et Essais - Essai de cisaillement rectiligne à la boîte - Partie 1: Cisaillement direct. Standard NF P 94-071-1. AFNOR, Saint-Denis, France.
Association Française de Normalisation. (2002). – NF EN 933-6. Essais pour déterminer les caractéristiques géométriques des granulats. AFNOR, Saint-Denis, France.
Bendahmane F., Marot D., Alexis A. (2008). – Parametric study of suffusion and backward erosion.
Journal of Geotechnical and Geoenvironmental Engineering, 134(1):57-67.
Fell R., Fry JJ. (2007). -Internal erosion of dams and their foundations, Taylor & Francis Group, London, 245p.
Kovacs G. (1981). – Seepage hydraulic, Elsevier Scientific Publishing Co, Amsterdam.
Lafleur J. (1999). – Selection of géotextiles to filter broadly graded cohesionless soils. Geotextiles and
Geomembranes, 17:299-312.
Li M., Fannin J. (2008). – Comparison of two criteria for internal stability of granular soil. Canadian
Geotechnical Journal, 45: 1303-1309.
Marot D., Bendahmane F., Rosquoët F., Alexis A. (2009). – Internal flow effects on isotropic confined sand-clay mixtures. Soil & Sediment Contamination, an International Journal, 18(3):294-306.
Marot D., Bendahmane F., Konrad J.M. (2011). – Multichannel optical sensor to quantify particle stability under seepage flow. Canadian Geotechnical Journal, 48:1772-1787. doi:10.1139/T11-074.
Moffat R., Fannin R.J. (2011). – A hydromechanical relation governing internal stability of cohesionless soil. Canadian Geotechnical Journal, 48(3): 413-424. doi:10.1139/T10-070.
Reddi, L.N., Lee, I., and Bonala, M.V.S. (2000). – Comparison of internal and surface erosion using flow pump test on a sand-kaolinite mixture. Geotechnical Testing Journal, 23(1): 116-122.
Skempton, A.W., and Brogan, J.M. (1994). – Experiments on piping in sandy gravels. Géotechnique, 44(3): 440-460.
Voivret C. (2008). – Texture et comportement des matériaux granulaires à grande polydispersité, Thèse de doctorat, Université Montpellier 2.
Wan C.F., Fell R. (2008). – Assessing the potential of internal instability and suffusion in embakment dams and their foundations. Journal of Geotechnical and Geoenvironmental Engineering, 134(3):401-407.